
Abstract
This chapter is concerned with approaches and techniques used in studying those aspects of parasitoid and predator life-cycles that are relevant to the topics covered by other chapters in this book.
Access provided by Autonomous University of Puebla. Download chapter PDF
2.1 Introduction
This chapter is concerned with approaches and techniques used in studying those aspects of parasitoid and predator life-cycles that are relevant to the topics covered by other chapters in this book. To illustrate what we mean, consider the female reproductive system of parasitoids, discussed in some detail in Sect. 2.3. As pointed out by Donaldson and Walter (1988), at least some knowledge of its function, in particular of the dynamics of egg production, is crucial to a proper understanding of foraging behaviour in parasitoids. The state of the ovaries may determine: (1) the duration of any pre-oviposition period following eclosion; (2) the rate of oviposition, (3) the frequency and duration of non-ovipositional activities, e.g., host-feeding, and (4) the insect’s response to external stimuli, e.g., odours, hosts (Collins & Dixon, 1986) (Sect. 1.5.1). Note that egg load (defined in Sect. 1.2.2) is now often incorporated into foraging models, as it has become clear that key foraging decisions depend upon the insect’s reproductive state (Jervis & Kidd, 1986; Mangel, 1989; Chan & Godfray, 1993; Heimpel & Rosenheim, 1995; van Baalen, 2000; Heimpel & Casas, 2008). It also follows from the above that a female parasitoid’s searching efficiency depends upon the functioning of its reproductive system and this may in turn influence parasitoid and host population processes (Chap. 7).
Comparative studies have provided useful insights into the factors that determine patterns of cross-species variation in the life-history traits of parasitoids, predators and spiders. The results of these investigations are only touched upon in this chapter; for further details, see Blackburn (1991a, b), Gilbert and Jervis (1998), Mayhew and Blackburn (1999), Strand (2000), Jervis et al. (2001, 2003), Mayhew and Glaizot (2001), Traynor and Mayhew (2005) and Mayhew (2016) on parasitoids, Dixon (2000, and references cited therein) on predatory coccinellids and Prenter et al. (1999); Lowe et al. (2020); Macías-Hernández et al. (2020). Godfray (1994) and Quicke (1997) should also be consulted for information on comparative aspects of parasitoid biology.
Much of the chapter is devoted to methods of recording variation in key life-history traits. Investigators should be mindful of the potential for trade-offs to occur between life-history variables, as predicted by general life-history theory (e.g., Roff, 2002). Examples of phenotypic trade-offs are given in the various sections on fecundity, adult longevity, development and growth and immature survival. Partly because of such trade-offs, caution should be exercised in using individual life-history traits as proxy measures of fitness (Roitberg et al., 2001). Genetic aspects of trade-offs are discussed in Chap. 3.
2.2 Anatomical Studies on Natural Enemies
2.2.1 Introduction
A general introduction to insect structure and function can be found in most standard entomological texts, e.g., Wigglesworth (1972), Chapman (1998, 2013), Richards and Davies (1977), Commonwealth Scientific and Industrial Research Organisation (1991). Individual topics are covered in texts such as Snodgrass (1935) on morphology, and Engelmann (1970) and Kerkut and Gilbert (1985) on insect reproduction. There are also texts such as Hodek (1973), Gauld and Bolton (1988), Quicke (1997), McEwen et al. (2001), Quicke (2014) and Ramírez and Michalik (2019) that deal with aspects of the anatomy and morphology of particular taxonomic groups of insect natural enemy. This section is concerned with methods used for investigating the internal anatomy of predators and parasitoids, the emphasis being placed on the female reproductive system.
2.2.2 Techniques
2.2.2.1 Dissection
Many insect natural enemies, particularly parasitoids, are so small that routine investigations of their internal anatomy might, at first sight, seem impossible to undertake. One approach to anatomical investigation is to fix and then embed insects in wax or resins, and then to cut, using a microtome, serial sections of the body. This method is, however, technically difficult and there usually arise problems such as distortion (e.g., due to hardness of the cuticle), inadequate fixation and the difficulty of reconstructing sections into a three-dimensional model. A far easier approach is to dissect the insect.
In order to carry out dissection, the following equipment will be required: a stereomicroscope with incident lighting (preferably fibre optics, see below), ordinary or cavity microscope slides, insect saline (e.g., 7.5 g NaCl/L) and some fine pins. The latter are best securely mounted either in glass tubes (4 mm diameter and approx. 50 mm long) or in matchsticks.
For parasitoid wasps (Trichogrammatidae, Mymaridae and others up to 25 mm long), place one droplet of insect saline on to a microscope slide and place the insect in the droplet. Use insects that have been recently killed either with ether, carbon dioxide, with some other suitable killing agent, or by freezing. Individuals that have been dead for more than an hour at room temperature, and also those that have been preserved in alcohol, are very difficult to dissect, so storing insects in a deep freeze is highly recommended. When dissecting, ensure that the insect’s body is dorsal side up, feet down. With one pin, restrain the insect from floating or otherwise moving in the saline, either by piercing its thorax, or by holding the pin across the female’s petiole. With the second pin, make small lateral incisions in the distal part of the gaster, preferably where there is an intersegmental membrane. Place the point of the second pin firmly upon the tip of the insect’s gaster and pull the latter gently away from the remainder of the gaster. The abdominal wall should part in the region of the incisions, and the abdominal contents should then spill out into the saline droplet. With a little practice, this technique will permit examination of the entire reproductive system, and also of the mid and hind gut. By carefully noting the positions of all the various organs during dissection, it should be possible to reconstruct the spatial arrangement of the organs and associated structures (Fig. 2.1). More difficult manipulation may be required in the case of parasitoid wasps with long ovipositors that are housed within the body as a spiral (e.g., Eurytomidae) or extended forward in a ‘horn’ above the thorax (e.g., Inostemma species (Platygastridae)).

Dissection of the gaster of female Nasonia vitripennis (Pteromalidae). The point of a micropin is used to pull away the tip of the gaster and reveal the internal organs
Three points need to be borne in mind when using the aforementioned technique. First, the insect must be kept covered in saline solution at all times. If it dries out, it cannot be satisfactorily reconstituted. Second, if water rather than saline is used, some structures may expand and become seriously distorted. Finally, unless a fibre-optic system is being used, avoid using an under-stage light source (useful for assisting the examination of some structures) for periods longer than a few minutes, as the specimen will dry out very quickly.
The above technique can be used for small predators and small dipteran parasitoids, but with large insects such as carabid beetles and hover-flies a small, water-filled, wax-bottomed dish should be used instead of a microscope slide and saline droplet. Gilbert (1986) describes a technique for dissecting adult hover-flies (Syrphidae) (Fig. 2.2a) that can also be applied to dipteran parasitoids and predatory beetles and bugs. The insect is placed on its back (dorsal surface) (on a slide or wax-bottomed dish, dry or under saline) and is secured with an entomological pin inserted through the thorax. Using a second entomological pin, a small tear is made in the intersegmental membrane at the junction of the thorax and abdomen. The end of one arm of a fine forceps is then inserted into this hole and the forceps are then used to grip the first abdominal sternite. Then, using a micropin (preferably one having a point that has been slightly bent near its tip), make lateral incisions in the abdomen, following the line of the pleura to the terminalia. Finally, peel back the abdominal sternites to reveal the internal organs (Fig. 2.2b, c). The crop (very large in hover-flies) can be removed in its entirety using forceps, and its contents (pollen and/or nectar) subsequently examined and analysed. The reproductive system can be examined in situ, under saline. Carabid beetles are dissected in a similar fashion, except that the insect is placed on its front (ventral surface). Figure 2.3 shows the gut of a typical carabid beetle.

Source Gilbert (1986). Reproduced by permission of Cambridge University Press
Dissections of hover-fly (Syrphidae) abdomen: a dissection procedure; b internal anatomy of female, c internal anatomy of male.

Source Forsythe (1987). Reproduced by permission of The Richmond Publishing Co. Ltd.
The gut of a typical carabid beetle.
It is very difficult to interpret the structure of an insect’s reproductive system, or that of other organs, if the structure has been fixed and preserved. If a permanent record of a dissection is needed, the insect’s organs are best photographed or drawn as soon as possible. Semi-permanent mounts can be made with water-soluble mountants such as polyvinyl pyrrolidone (Burstone, 1957) or glycerol, but anatomical features are better observed in freshly dissected insects. Anatomical features are enhanced by the use of specialist optics such as phase contrast, interference and dark ground illumination, with a transmission compound microscope.
2.2.2.2 Microscopy
There is a limit to the information that can be obtained from dissection. Histological and histochemical techniques will reveal the location of lipids, carbohydrates, nucleic acids and many more specific materials in, for example, the reproductive organs (see also Sect. 2.14). Such techniques have been crucial to our understanding of oögenesis in parasitoids (King et al., 1971; Davies et al., 1986; Reed et al., 2007, Huang et al., 2008 and Bodin et al., 2009). Combined with electron microscopy, they can reveal the detailed structure of secretory tissues, egg oöplasm (e.g., Le Ralec, 1995), and can demonstrate the effects of diet and temperature on structures such as mitochondria and cell membranes. Davies (1974), for example, showed how in Nasonia vitripennis the ultrastructure of flight muscle alters with the age of the adult insect and with variations in adult diet.
2.2.3 Ovipositor and Male Genitalia
The ovipositor of female parasitoids may need to be examined in detail in order to understand the mechanics of oviposition, while the secondary genitalia of male dragonflies may need to be examined in order to study sperm competition (Sect. 4.5.2). Light microscopy and scanning electron microscopy (SEM) are usually employed to study these structures. In order to examine whole mounts with light microscopy, clear and stain them following standard protocols, whereas to examine sections, e.g., of ovipositors, embedding, sectioning and staining needs to be carried out; standard protocols (embedding in Spurr’s medium and staining, e.g., with Toluidine Blue) were followed, for example, by Austin (1983) and Quicke et al. (1992). Greater detail of external morphology can be seen using SEM (e.g., King & Fordy, 1970; Jervis, 1992; Quicke et al., 1992). Specimens of small Hymenoptera and of Diptera are best prepared for SEM by critical-point drying them (Postek et al., 1980), whereas specimens of larger and more hard-bodied insects require only air drying.
Snodgrass (1935) described the basic structure of both male and female insect genitalia, while Scudder (1971) interpreted the structure of the ovipositor in hymenopterans. For details of ovipositor structure and function in parasitoids, including in some cases the mechanism of egg movement, see Jervis (1992), Field and Austin (1994), Quicke et al. (1994), Le Ralec et al. (1996), Austin and Field (1997), Kozanek and Belcari (1997), Gerling et al. (1998), van Lenteren et al. (1998), Rahman et al. (1998), Le Lannic and Nenon (1999), Vilhelmsen et al. (2001), Heraty and Quicke (2003), Zacaro and Porter (2003), Vilhelmsen (2003), van Lenteren et al. (2007) and Cerkvenic et al. (2017).
Parasitoids, in common with other insects, possess a diversity of sensilla on the ovipositor (Gutierrez, 1970; King & Fordy, 1970; Weseloh, 1972; Hawke et al., 1973; Greany et al., 1977; van Veen, 1981; Jervis, 1992; Kozanek & Belcari, 1997; Cônsoli et al., 1999). The function (i.e., mechanoreception, chemoreception) of the sensilla can be provisionally inferred from their external morphology, but corroboration needs to be obtained by examining them in detail using transmission electron microscopy, by observing female oviposition behaviour, and by carrying out electrophysiological studies. The role of ovipositor sensilla in host acceptance by parasitoids (Sect. 1.5.5) has long been appreciated.
The functional morphology of male genitalia in dipteran and hymenopteran parasitoids has not been extensively studied (Domenichini, 1953; Sanger & King, 1971; Teder, 1998 and Chiappini & Mazzoni, 2000). Recent research in this area has been performed with some egg parasitoids (Paoli et al., 2013; Ramírez-Ahuja et al., 2020). The structure and function of the genitalia of male dragonflies (Waage, 1979, 1984; Artiss, 2001 and Cordoba-Aguilar, 2002), spiders (Eberhard et al, 1998; Rivera-Quiroz et al., 2020) and other insects (Huber et al., 2007) is better understood.
2.3 Female Reproductive Organs
2.3.1 Ovaries
The reproductive organs of hymenopteran (Figs. 2.1, 2.4a, b, d, 2.5) and dipteran (Fig. 2.4c, e) parasitoids comprise a pair of ovaries which themselves comprise several ovarioles in which the eggs (oöcytes) develop. In parasitoid wasps (King & Richards, 1969) and flies (Coe, 1966) the ovarioles are of the polytrophic type. Within each follicle, nurse cells (trophocyte cells: fifteen or more in hymenopteran parasitoids) surround the developing oöcyte, providing it with nutrients (Fig. 2.6a). The oöcyte becomes increasingly prominent as it passes down the ovariole. Each oöcyte, together with its associated trophocyte cells, originates from a single cell. It seems that, in order to develop eggs as rapidly as possible, the protein production machinery of all the trophocyte cells passes materials into the oöcyte. The follicle cells, which may also pass materials from the haemolymph, secrete the chorion (egg membrane). As the oöcyte matures, the trophocyte cells break down. The follicular epithelium creates a small pore (the micropyle) in the chorion, through which the sperm enters to penetrate the egg membrane and effect fertilisation.

The reproductive systems of some parasitoid wasps and flies: a gravid female Coccophagus atratus (Aphelinidae) 24 h after emergence (source Donaldson & Walter, 1988); b Trachysphyrus albatorius (Ichneumonidae) (source Pampel, 1914, in Price, 1975); c Hyperecteina cinerea (Tachinidae) (source Clausen et al., 1927, in Price, 1975); d Enicospilus americanus (Ichneumonidae) (source Price, 1975); e Leschenaultia exul (Tachinidae) (source Bess, 1936 in Price, 1975). a Reproduced by permission of Blackwell Publishing; b, c, d and e by permission of Plenum Publishing Corporation

The reproductive systems of some parasitoid wasps: a Gonatocerus sp. (Mymaridae); b Cotesia sp. (Braconidae); c unidentified Eulophidae

Examples of ovariole structure in natural enemies: a polytrophic type, in Nasonia vitripennis (Pteromalidae) (source King & Ratcliffe, 1969); b telotrophic type as found in coccinellid beetles and heteropteran bugs (source de Wilde & de Loof, 1973). a Reproduced by permission of The Zoological Society of London; b by permission of Elsevier Science
To examine the ovarioles of a dissected insect, remove the ovaries (their attachment to the abdominal wall may need to be severed), place them on a microscope slide in a drop of insect saline, and tease the ovarioles apart with micropins. Then gently place a cover-slip over the ovaries. The number of ovarioles can then be counted and their contents viewed.
In both hymenopteran and dipteran parasitoids, the number of ovarioles per ovary varies both interspecifically (Flanders, 1950; Price, 1975; Jervis & Kidd, 1986; Quicke, 1997; Harvey et al., 2014) and intraspecifically (e.g., van Vianen & van Lenteren, 1986; Harvey et al., 2014; Liu et al., 2014; Ameri et al., 2015). Ovarian structure often differs markedly between koinobiont and idiobiont parasitoids. For instance, koinobionts are often much more highly fecund than idiobionts, and this is reflected in the number of ovarioles per ovary, which is often far greater than in idiobionts (Flanders, 1950; Price, 1972; Jervis et al., 2001, 2008; Harvey, 2008). Many chalcidoid wasps have an average of three ovarioles per ovary (Encarsia formosa has an average of eight to ten, depending on the population studied), whereas in ichneumonoid wasps the range of interspecific variation is much wider (Iwata, 1959, 1960, 1962; Cole, 1967; Quicke, 1997). In some species of Ichneumonidae ovariole number alters according to whether the females are of the first or the second field generation, female body size being taken into account, i.e., there is a seasonal dimorphism (Cole, 1967). In predatory coccinellids, as in parasitoids, there is both intra- and interspecific variability in ovariole number (Iperti, 1966; Stewart et al., 1991). Welch (1993) reviews ovariole number in Staphylinidae.
Predator ovaries fall into several categories. Those of chrysopid lacewings and carabid and gyrinid beetles have polytrophic ovarioles (e.g., Fig. 2.7), but coccinellid beetles and predatory heteropteran bugs have telotrophic ovarioles (Fig. 2.6b). In the latter, the trophocyte cells, instead of accompanying the oöcyte as it moves down the ovariole, remain in the swollen distal end and remain attached to the egg by a lengthening cytoplasmic strand that conveys the nutrients. Telotrophic ovarioles are therefore short, but they are often numerous.

Source Principi (1949). Reproduced by permission of W. Junk, Publishers
Schematic representation of reproductive system in female Chrysopa septempuncata (Neuroptera), dorsal aspect.
A measure of female reproductive potential can be obtained by counting the total number of oöcytes (mature and immature) within the ovaries and oviducts (Sect. 2.7.1). It is a fairly simple procedure to count the number of mature eggs in species that possess enlarged lateral oviducts in which the eggs accumulate (Sect. 2.3.2), but care is needed in the case of species that store (albeit for a brief period) some or all of their eggs within the basal part of the ovariole. With practice, it is possible to recognise mature eggs by their slightly opaque appearance resulting from the presence of yolk within (i.e., in anhydropic species, Sect. 2.3.4). Immature oöcytes, particularly the smaller ones, are more difficult to count. A stain such as acetocarmine can be used to reveal them more clearly: the stain is taken up by these oöcytes, because they lack a chorion (in mature oöcytes, only the surrounding follicle becomes stained; the follicle is eventually lost prior to the mature egg entering the oviduct).
2.3.2 Oviducts
The ovarioles empty into the lateral oviducts (Figs. 2.4, 2.5, 2.8). In most Hymenoptera, each lateral oviduct includes an obvious glandular region, the calyx (Fig. 2.8), which secretes materials onto the egg as it is laid (Rotheram, 1973a, b). In some Braconidae and Ichneumonidae, the calyx is the source of polydnaviruses (baculoviruses of the family Polydnaviridae) (Stoltz & Vinson, 1979; Stoltz, 1981; Strand et al., 1988; Fleming, 1992; Bézier et al., 2009; Herniou et al., 2013). The latter, which replicate in the cells of the calyx, play a role in preventing encapsulation of the parasitoid egg (Sect. 2.10.2) and in modifying the host’s growth, development, morphology and behaviour (Vinson & Iwantsch, 1980a; Stoltz, 1986; Strand et al., 1988; Beckage, 1998a, b; Webb, 1998; Strand & Burke, 2014; Ye et al., 2018). Chelliah and Jones (1990) raised an antibody against the extracted polydnaviral proteins of Chelonus sp. and then used it to reveal the location of such proteins in the wasp’s reproductive system.

The calyx region of lateral oviduct in: a Cotesia sp. (Braconidae); b Aprostocetus sp. (Eulophidae) (also showing one pair of colleterial glands); c Torymus sp. (Torymidae) (also showing two pairs of colleterial glands); d Macroneura vesicularis (Eupelmidae) (showing calyx lobes, i.e., the very long structures, and two pairs of colleterial glands)
In some synovigenic parasitoid wasps the lateral oviducts can accommodate a small number of eggs, e.g., 9–12 per oviduct in Coccophagus atratus (Donaldson & Walter, 1988) (anhydropy, Sect. 2.3.4). In others the oviducts are greatly elongated, to form distinctive ‘uteri’, and can accommodate very large numbers of small eggs (Figs. 2.4d and 2.5b) (hydropy, Sect. 2.3.4).
The lateral oviducts join to form the common oviduct, a largely muscular structure that in turn becomes confluent with the vagina and (in wasps) the ovipositor stylets. In some tachinid parasitoids, egg storage (and incubation) occurs in the common oviduct, e.g., Cyzenis albicans (Hassell, 1968). In wasps, forward-pointing spines in the vagina push the egg into the ovipositor at or before oviposition (Austin & Browning, 1981). As it passes down the ovipositor, the egg is squeezed to a small diameter, a process that has been shown to trigger embryonic development (Went & Krause, 1973). Embryonic development of haploid (male) eggs of the ichneumonid parasitoid Pimpla turionellae can also be triggered by experimental injection, not involving egg deformation, of calcium ionophore A23187 (Wolf & Wolf, 1988). The chorion of the hymenopteran egg is remarkably flexible, so experiments on the initiation of embryogenesis can be carried out on mature eggs that have been removed from the ovarioles or lateral oviducts of a wasp. The eggs can be manipulated in various ways on a microscope slide, in saline solution, to show, for example, what degree of compression is required to trigger embryogenesis. In the tachinid Cyzenis albicans eggs, when laid, contain a fully formed first-instar larva (Hassell, 1968).
2.3.3 Shape, Size and Number of Eggs
The shape of eggs in parasitoid wasps and flies varies considerably between groups (Iwata, 1959, 1960, 1962; Hagen, 1964; Quicke, 1997). Egg types found among parasitoid wasps include those with a simple ovoid shape, those that are greatly elongated (Fig. 2.9a, b), those with a distinctive stalk at the micropyle end, and those with a double-bodied appearance (Fig. 2.9c). For a review of the range of egg types found among parasitoids, see Hagen (1964) and Quicke (1997).

Eggs of parasitoid Hymenoptera. Eggs dissected out of the reproductive systems of parasitoid Hymenoptera: a unidentified Mymaridae; b Cotesia sp. (Braconidae); c unidentified Encyrtidae. Stereomicroscopic images of laid eggs: d Habrobracon hebetor (Braconidae); e Goniozus nephantidis (Bethylidae) (Photographs d and e: K.S. Shameer)
Some eggs (hydropic-type eggs, Sect. 2.3.4) characteristically increase greatly in size following deposition in the host’s haemocoel. Among Braconidae, for example, eggs of Euphorinae expand in volume a thousand times (Ogloblin, 1924; Jackson, 1928), and those of Praon palitans (Aphidiinae) over six hundred times (Schlinger & Hall, 1960).
Within a parasitoid wasp species, the number and the size of mature oöcytes in the ovaries are, in general, positively correlated with the size of the female (e.g., O’Neill & Skinner, 1990; Rosenheim & Rosen, 1992; Visser, 1994; but see Fitt, 1990). This observation has important implications for foraging models, since larger females may, theoretically, obtain larger fitness returns per host and also, compared with smaller females, they can utilise a series of hosts in more rapid succession (Skinner, 1985; O’Neill & Skinner, 1990).
The number of mature oöcytes in the ovaries is a function of the number of ovarioles, which is also correlated with body size within a species (e.g., Branquart & Hemptinne, 2000). Data on oöcyte number, oöcyte size and ovariole number have been gathered for a limited number of species. In spiders, it was shown that the amount of metabolic energy invested per egg is species specific and strongly influences egg size (Anderson, 1990).
In the damselfly Coenagrion puella, the carabid beetle Brachinus lateralis, and the hover-fly Episyrphus balteatus, egg size is not correlated with female size (Juliano, 1985; Banks & Thompson, 1987a; Branquart & Hemptinne, 2000), but it is positively correlated with body size across species of Gerridae and predatory Coccinellidae (Kaitala, 1991; Dixon, 2000).
The size of a female’s eggs may alter during her lifetime. Giron and Casas (2003b) demonstrated that Eupelmus vuilletti reduces egg provisioning with age: with increasing age, there is a marked decrease in reproductive investment with respect to egg size, and sugar, protein, lipid and energy content. Egg size was a good predictor of offspring fitness, measured as survival of neonate larvae. Wallin et al. (1992) showed that in carabid beetles egg size decreases with increasing oviposition rate.
Between parasitoid species, ovariole number is a good predictor of fecundity, as Price (1975) has shown for Ichneumonidae and Tachinidae (Fig. 2.10). It remains to be tested whether or not a correlation exists between body size and ovariole number, on a broad, between-species basis.

Source Price (1975). Reproduced by permission of Plenum Publishing Corporation
The relationship between fecundity (note log scale) and the number of ovarioles per ovary in species in the Ichneumonidae and in the Tachinidae. Data points represent means for individual species.
Blackburn (1991a) and Jervis et al. (2003) showed, through comparative analyses, that among parasitoid wasps there is not a positive relationship between adult size and lifetime fecundity (fecundity is defined in Sect. 2.7.1), although Blackburn (1991a) detected such a relationship when he controlled for egg size. When adult size is controlled for, species with a high fecundity (the maximum number of eggs reported to have been laid by an individual of a species) tend to have smaller eggs, indicating a trade-off between fecundity and egg size (small eggs require less of a material investment) (further discussed in Blackburn, 1991a). Mayhew and Blackburn (1999) showed, also through a comparative analysis, that koinbionts produce smaller eggs than do idiobionts.
The interspecific relationships among predatory Syrphidae and among Coccinellidae with respect to ovariole number, mature oöcyte number, oöcyte size and female body size, and their biological significance, are discussed by Gilbert (1990) and Dixon and Guo (1993). Note that in predatory coccinellids large species produce proportionately smaller eggs, relative to their body size, than smaller ones. For a discussion of the adaptive significance of the egg size‒body size relationship in the Coccinellidae, see Dixon (2000).
2.3.4 ‘Ovigeny’ and Related Traits
2.3.4.1 Ovigeny Index
Among insects, even among members of the same order, there may be considerable variation in the degree to which the female’s lifetime potential egg complement is mature when she emerges into the environment following pupal development. For example, the orders Lepidoptera and Hymenoptera each include, at one extreme, species that emerge with a fully developed lifetime egg complement and, at the other extreme, species that emerge with only immature oöcytes (Flanders, 1950; Dunlap-Pianka et al., 1977; Jervis et al., 2001). There are even intraspecific, intra-population genetic variations in this trait (Wajnberg et al., 2012). The ‘ovigeny index’, which is expressed as the proportion of the initial mature egg load that make up the lifetime potential fecundity (Sect. 2.7.1), was devised by Jervis et al. (2001) to quantify variation in the degree of egg development shown by insects both interspecifically and intraspecifically. Ovigeny index = 1 (‘strict pro-ovigeny’ sensu Jervis et al., 2001) indicates that all the female’s oöcytes are mature upon emergence, whereas ovigeny index = 0 (‘extreme synovigeny’) denotes emergence with no mature oöcytes. A continuum of ovigeny index values exists among parasitoid wasps, ranging from strict pro-ovigeny, through weak then strong synovigeny, to extreme synovigeny (Jervis et al., 2001); the same probably applies to parasitoid Diptera and also insect predators as a whole.
The numerator in the calculation of ovigeny index—initial egg load (the number of mature, i.e., fully chorionated [layable] eggs in newly emerged females)—is in many species easily measured through dissection. Lifetime potential fecundity, the denominator in the calculation of ovigeny index, is measured by adding the number of immature oöcytes (also measured through dissection) to the initial egg load. Alternatively, it can be approximated by measuring the average lifetime realised fecundity (Sect. 2.7.1) achieved under conditions of high host abundance (hosts supplied ad libitum) and high food availability/quality.
The ovigeny index can be used as a simple measure of the allocation of resources to reproduction at the start of adult life (Sect. 2.13.2), and thus to seek some of the classic trade-offs predicted by general life-history theory (Bell & Koufopanou, 1986; Smith, 1991; Stearns, 1992; Roff, 2002). For example, in parasitoid wasps, ovigeny index and life-span are negatively correlated both within species (Jervis et al., 2001, using data in Ellers & van Alphen, 1997) and across species (Jervis et al., 2001, 2003), suggesting that there is a cost, to life-span, of concentrating reproductive effort into early adult life (Jervis et al., 2001). At least within species, the negative correlation is attributable to the differential allocation of capital resources between initial eggs on the one hand, and fat body reserves (which contribute to maintenance metabolism) on the other (Ellers & van Alphen, 1997) (Sect. 2.13.2). Ovigeny index has also been used to explore the body size-related trade-off between current and future reproduction (Ellers & Jervis, 2003).
Other life-history variables found to be correlates of ovigeny index are: egg resorption capability (associated with a low index), egg type (hydropy is associated with a high index, anhydropy with a low index), and body size (negatively correlated with ovigeny index, both between and within species) (Jervis et al., 2001, 2003; Ellers & Jervis, 2003). Host-feeding species tend to have a low index, as do idiobionts (Jervis et al., 2001). Ovigeny index is hypothesised to be correlated with the degree of resource carry-over (i.e., from pupa to adult) (Sect. 2.13.2): an index of 1 indicates that the materials used for lifetime reproduction derive entirely from larval resources, whereas indices of <1 indicate that the materials used for lifetime reproduction derive only partly from carried-over resources, the females relying upon external nutrient inputs to mature their remaining oöcytes). This difference in life-history strategy closely parallels the concept of ‘capital’ versus ‘income’ breeding (Drent & Daan, 1980; Boggs, 1992, 1997a). The ovigeny index can also be affected by abiotic factors such as temperature. For example, Moiroux et al. (2018) found that ovigeny index in the synovigenic parasitoid Aphidius ervi increased when immature stages or adults were exposed to higher temperatures. If more broadly applicable, these results could have implications on parasitoid reproductive behaviour and demographics in the field, especially under conditions experienced during climatic extremes (Harvey et al., 2020; Ma et al., 2021).
For details of the criteria used in deciding whether a species is strictly pro-ovigenic or synovigenic, see Jervis et al. (2001). Note that some species categorised by authors as pro-ovigenic are, in reality, weakly synovigenic (Mills & Kuhlmann, 2000; Jervis et al., 2001).
2.3.4.2 Autogeny/Anautogeny in Synovigenic Insects
Presumably due to there being insufficient resource carry-over from the larval stage, some synovigenic species can mature some eggs without first feeding (i.e., are autogenous), whereas others must feed (i.e., are anautogenous). It is likely that the vast majority of koinobiont endoparasitoids that produce hydropic eggs are autogenous (Jervis & Kidd, 1986; Harvey, 2005; Pennacchio & Strand, 2006; Jervis et al., 2008). Hover-fly (Syrphidae) species are synovigenic-autogenous (Gilbert, 1991). The tachinid Cyzenis albicans is synovigenic-autogenous (Hassell, 1968). Predatory coccinellids are synovigenic-anautogenous. The green lacewing Chrysoperla carnea is anautogenous when reared only on prey, but is autogenous when given a non-prey food, together with prey, during larval life (McEwen et al., 1996). In anautogenous host-feeding species, the females must consume host haemolymph in order to mature eggs (Jervis & Kidd, 1986).
2.3.4.3 Hydropy and Anhydropy
Flanders (1942) distinguished between two types of egg in parasitoid wasps, hydropic and anhydropic, based on the function of the chorion. Hydropic eggs, which are restricted to endoparasitoid species, usually swell to a considerable degree within hours or a few days of being deposited within the host’s haemolymph (Schlinger & Hall, 1960). Compared with the mature ovarian eggs, the swollen eggs in euphorine Braconidae are 1000 times larger in terms of volume. The swelling occurs as a result of the uptake, via the thin, permeable chorion, of components of the host’s haemolymph (Ferkovich & Dillard, 1987). In hydropic egg-producing parasitoids, the permeable chorion is connected physically to the embryo via an extra-embryonic membrane, which absorbs nutrients from host haemolymph during embryogenesis (Grbić & Strand, 1998). Anhydropic eggs, which occur among ectoparasitoid as well as endoparasitoid species, have a relatively thick, rigid, impermeable chorion, and any apparent swelling they undergo is slight and mostly the result of the embryo having developed into the first-instar larva.
Hydropic eggs contain little yolk, which is mainly comprised of lipids (Le Ralec, 1995). Their oöplasm contains numerous ribosomes and mitochondria, both organelles apparently being derived from the female’s trophocytes, via the nutritive pore (King et al., 1971; Le Ralec, 1995). Proteins, rather than being acquired from the host’s haemolymph, are synthesised de novo within the oöplasm, from amino acids which have been obtained from the host (Ferkovich & Dillard, 1987). The major contribution by the mother to its progeny is thus a protein synthesis apparatus to enable complete embryonic development (Le Ralec, 1995). Anhydropic eggs, by contrast, contain much yolk. Their oöplasm contains numerous lipoid bodies. Proteins, mainly composed of vittelin, are also present, but their character varies among species. In species whose females consume host haemolymph (‘host-feed’, Sect. 1.8), the protein bodies are typical of insects generally (King & Richards, 1969; Kunkel & Nordin, 1985; Le Ralec, 1995) but in species that do not host-feed they appear to be atypical, although their biochemical composition has yet to be clarified (Le Ralec, 1995). In anhydropic egg-producing species, the mother contributes to its progeny sufficient sources of both energy-rich (lipid) and nitrogen-rich (protein) materials to enable embryonic development to be completed. Harvey (2008) compared reproduction and development in two species of closely related secondary (hyper)parasitoids in the ichneumonid subfamily Cryptinae, Lysibia nana and Gelis agilis, both of which attack cocoons of Cotesia glomerata. Each species produces anhydropic eggs and both have ovigeny indices of 0. However, whereas adult female G. agilis obligatorily host-feeds before producing eggs, L. nana does not. This reveals that phylogeny plays some role in explaining the expression of some reproductive traits but not others.
It is reasonable to conclude from the above that the greatest degree of parental (female) investment per egg is made by anhydropic egg-producing species. Indeed, Godfray (1994) and Mayhew and Blackburn (1999) assumed the selection pressures for divergence in egg size among parasitoids to be linked to the selection pressures for divergence in egg type (hydropy/anhydropy), with the result that small egg size is associated with hydropic egg production, and large egg size associated with anhydropic egg production. Jervis et al. (2001, 2003, 2008) therefore took hydropy and anhydropy to be proxy measures of such investment when seeking a link between egg type and the timing of egg production (ovigeny index). In a comparative analysis of over 60 parasitoid wasp species, hydropic egg-producing species were shown to have, on average, a significantly higher ovigeny index than anhydropic species. Given that Jervis et al. (2003) have shown ovigeny index to equate with initial egg load, the aforementioned result accords well with the trade-off, between egg number and egg size across species, predicted for animals generally by life-history theory (Smith & Fretwell, 1974), and established empirically for parasitic (mainly parasitoid) wasps by Berrigan (1991). Therefore, the hydropy/anhydropy distinction would seem to be a valid comparative measure of parental investment per egg. A more convincing case in support of this assumption could be made if egg type and egg volume were shown to be positively correlated. An alternative approach would be to show that hydropy and anhydropy are linked to cross-species variation in body size. The rationale behind the existence of such a relationship is that in parasitoid wasps, egg volume and body size are positively correlated, irrespective of the method by which volume is calculated (Berrigan, 1991; Blackburn, 1991a). Ideally, future research into interspecific patterns of maternal egg provisioning should involve measuring allocation per egg in terms of total energy and of the amounts of key nutrients, using the techniques applied by Giron and Casas (2003b) to Eupelmus vuilletti.
2.3.4.4 Egg Resorption
In synovigenic-anhydropic parasitoids, oöcytes, when they become mature, are not immediately discharged into the lateral oviduct. Usually a maximum of only a few (three in Encarsia formosa; van Lenteren et al., 1987) mature eggs can be stored per ovariole at any moment in time. These eggs, however, can be retained for only a brief period of time, as they have limited storage life, and space has to be made for other mature oöcytes to enter the lateral oviduct. If a female is deprived of hosts for a sufficiently long period (i.e., hosts are absent or are otherwise very scarce), she does not jettison such eggs but begins resorbing them, commencing with the oldest (see below) (see also Stokkebo & Hardy, 2000). In Nasonia vitripennis only the pycnotic residue of the follicle cell nuclei remains after resorption (King & Richards, 1968), although in a few species females may deposit partially resorbed eggs (Flanders, 1950). In some cases, even developing oöcytes may be resorbed (reviewed by Jervis & Kidd, 1986, and van Lenteren et al., 1987). By resorbing eggs, the female can use the energy and materials obtained from the eggs to maintain herself and to sustain ovigenesis until hosts are again available. Through egg resorption, eggs are returned to the body of the wasps with only a partial loss of energy and materials, instead of the total loss that would occur if the eggs were jettisoned. In the mymarid parasitoid Anaphes nitens, the rate of egg resorption is higher in starved wasps than wasps fed with honey (Carbone et al., 2008). This suggests that the presence of carbohydrates (sugars) inhibits the need for parasitoids to resorb nutrients in their eggs, and suggests that egg resorption is a last-resort survival tactic (Jervis & Kidd, 1986). Egg resorption can be a form of egg limitation in synovigenic parasitoids, since whilst a female is in the process of resorbing eggs, she may be temporarily incapable of ovipositing even if hosts become available (Jervis & Kidd, 1986, 1999; Heimpel & Rosenheim, 1998).
Eggs that are undergoing resorption can be detected at the proximal ends of the ovarioles by their unusual shape (and sometimes colour in hemipteran bugs) compared with unaffected eggs (Fig. 2.11a, b). Because of the partial removal of the chorion, eggs that have recently begun to be resorbed may, unlike unaffected eggs, increase in size when dissected out in water, and will certainly take up stains such as acetocarmine or trypan blue more readily (King & Richards, 1968).

Egg resorption in synovigenic-anhydropic parasitoid wasps: a Nasonia vitripennis (Pteromalidae) (source King & Richards, 1968); b Habrobracon hebetor (Braconidae). (source Grosch, 1950) [In both cases, the ovarioles of a non-resorbing female are shown on left, and those of a resorbing female are shown on right]. a Reproduced by permission of The Zoological Society of London; b by permission of The Marine Biological Society, Woods Hole, Massachusetts
As they are being resorbed, eggs shrink and finally disappear, leaving remnants of the exochorion. The latter are probably voided through the egg canal at the next oviposition, although in some Encyrtidae part of the chorion (the aeroscopic plate) remains in the ovariole or is voided into the haemocoel (Flanders, 1942).
The time of onset of resorption in host-deprived wasps varies, depending on the availability of food. A female Nasonia vitripennis or Goniozus nephantidis that is starved will begin resorbing eggs earlier than a female that is given honey (Edwards, 1954; Stokkebo & Hardy, 2000). Heimpel et al. (1997a) recorded egg resorption in starved Aphytis melinus but not in honey-fed ones over the 36-h experimental period. In host-deprived, honey-fed females of Nasonia vitripennis oöcyte development continues, albeit slowly. Among starved female Phanerotoma franklini, some females apparently did not live long enough to resorb eggs, whereas sugar-fed females monitored to natural death began to resorb eggs after around 30 days, and by 40 days had resorbed all of their eggs (Sisterton & Averill, 2002).
The rate of egg resorption can be measured using the chemical colchicine, which stops cell division by interfering with microtubule formation, and therefore halts production of further mature eggs. Rates measured for parasitoids vary from one to several days (Edwards, 1954; Bartlett, 1964; Benson, 1973; Anunciada & Voegelé, 1982; van Lenteren et al., 1987). In completely starved Nasonia vitripennis, when the terminal oöcyte of one ovariole has begun to be resorbed, it is followed by those in other ovarioles. With continued starvation, the penultimate oöcyte will also start being resorbed, first in one ovariole and then in the others, and so on (King & Richards, 1968).
If a female parasitoid is deprived of hosts for a long enough period for resorption to commence, the number of mature oöcytes in the ovaries (egg load), will depend on both: (a) the rate of oögenesis (which will be much lower in starved females than in females that have access to non-host foods, Sect. 2.7.3) and (b) the rate of resorption (King, 1963; van Lenteren et al., 1987).
2.3.5 Egg Limitation
As discussed in Chaps. 1 (Sect. 1.16.2) and 7, the degree to which a parasitoid is egg limited is an important consideration when studying parasitoid foraging behaviour, from the standpoints of fitness gain and searching efficiency. The size of the parasitoid’s mature egg load determines the number of eggs the female can lay at a given moment in time (Heimpel & Rosenheim, 1995) (Fig. 2.12). What, then, sets the upper limit to egg load: is it the rate of ovigenesis or the storage capacity?

From Heimpel and Rosenheim (1998). Reproduced by kind permission of Elsevier Science
The changes in egg load and the cumulative number of eggs laid by a strictly pro-ovigenic and a strongly synovigenic species in relation to successive oviposition events.
If, in a species that is not currently resorbing eggs, not all the ovarioles are found to contain a mature egg at any instant in time when ovigenesis is at its maximum, i.e., there is asynchrony among ovarioles, then the ceiling to egg load is set by the rate of ovigenesis, not by the storage capacity. On the other hand, if at any time all the ovarioles contain a full-sized egg and the lateral oviducts are also full of eggs, then the ceiling is likely to be set by storage capacity (in which case one must ask: does ovigenesis cease when the maximum storage capacity is reached?). Coccophagus atratus apparently belongs to the second category. If females of this species are withheld from hosts but fed on honey following eclosion and are dissected after varying periods, the egg load is found to increase during the first 24 h of adult life and thereafter remain constant (Fig. 2.13). Since in this species there is no evidence for egg resorption, egg numbers are probably limited by the storage capacity of the ovarioles/lateral oviducts, with ovigenesis ceasing when there is no room for further eggs (Donaldson & Walter, 1988). In the solitary koinobiont endoparasitoid Venturia canescens, egg storage capacity in the oviducts is reached in host-deprived females around five days after eclosion (Harvey et al., 2001). At this point oögenesis ceases until females parasitise multiple hosts, when it resumes. By contrast, in some idiobiont parasitoids, egg limitation is taken to the extreme. For example, the cryptine facultative hyperparasitoid Gelis agilis has only two ovarioles per ovary and can store no more than two anhydropic eggs in them at a given time. As a result, daily and lifetime fecundity under optimal ‘good world’ laboratory conditions are still exceedlingly low, with females only able to lay a maximum of 2‒3 eggs a day and rarely more than 50 during a lifetime (Harvey, 2008). It would be interesting to know what conditions facilitate the switching on and off of ovigenesis under both natural and laboratory conditions, and if this is correlated with reproductive traits of the parasitoids being studied.

Source Donaldson and Walter (1988), reproduced by permission of Blackwell Publishing
The number of full-sized eggs in the ovaries of Coccophagus atratus (Aphelinidae), recorded at various intervals after female eclosion (mean ± SE, n = 10).
To measure the rate of ovigenesis in a synovigenic parasitoid in relation to different treatments, expose each of several large cohorts of standardised (e.g., newly emerged) females to a particular environmental condition, e.g., type of diet, temperature level, and follow the cohorts through until the last females die. Each day, dissect part of each cohort and examine the condition of the ovaries in the females, recording the number of mature eggs. The age-specific and average daily rate of ovigenesis (plotted as an ovigenesis schedule) can be compared for the different treatments. A detailed protocol for an investigation of this type, concerned with the effects of different temperatures, may be found in Kajita and van Lenteren (1982).
2.3.6 Motivation to Oviposit
A number of theoretical models indicate that the motivation to oviposit (and to host-feed) depends upon egg load. How does a parasitoid perceive the size of its egg load? Donaldson and Walter (1988), in a detailed study on ovipositional activity and ovarian dynamics in Coccophagus atratus, showed that when females were exposed to an abundance of hosts, they deposited eggs within defined bouts of ovipositional activity that were initiated only when the female had accumulated approximately eighteen full-sized eggs (Fig. 2.4a). This finding suggests that egg load, possibly perceived via stretch receptors in the lateral oviducts (Collins & Dixon, 1986), affects the motivation to oviposit.
2.3.7 Spermathecal Complex
The spermatheca (Figs. 2.1, 2.2, 2.4, 2.7, 2.14 and 2.15) is the sperm storage organ of females. Syrphidae, Tachinidae and Pipunculidae have three (Fig. 2.2b; Kozanek & Belcari, 1997), whereas Hymenoptera have only one (Quicke, 1997). In Hymenoptera, the spermatheca is situated at or near the confluence of the lateral oviducts. The spermathecal complex comprises a capsule (the storage vessel or ‘spermathecal reservoir’), a gland or pair of glands which may help to attract, nourish and possibly activate sperm, and a muscular duct through which sperm are released (or witheld) as an egg passes along the common oviduct (vagina).

The spermatheca in parasitoid wasps: a Aprostocetus sp. (Eulophidae) (showing pigmented capsule); b Eurytoma sp. (Eurytomidae) (capsule and gland united, showing the gland’s collecting duct); c Nasonia vitripennis (Pteromalidae) (showing sperm)

Source Copland (1976). Reproduced by permission of Pergamon Press
The reproductive system of female Aphelinus (Aphelinidae), showing the position of the spermatheca, the venom gland, Dufour’s gland, the venom gland reservoir and other structures.
In parasitoid wasps, the spermatheca is noticeably pigmented yellow, dark red or black (a possible adaptation for protecting sperm from the adverse affects of UV light), a useful feature to look out for when dissecting females. Using transmitted light, it is usually possible to observe, at high magnifications, the movement of any sperm present within the capsule. To detect such movement, observations must be made within 5 min of dissecting the recently killed female. Hardy and Godfray (1990) determined whether or not field-caught foraging parasitoids were virgins, by examining the spermatheca of dissected females. They were able to distinguish between empty spermathecae, those containing living sperm (present as a writhing mass) and those containing dead sperm (inadvertently killed by the dissection process). The spermathecae of Pipunculidae are enclosed within the sclerotised base of the ovipositor, and so are difficult to examine and dissect.
Thus far, most empirical attention has focused on egg limitation in parasitoids as a possible impediment to achieving maximum fecundity (egg limitation in parasitoids is discussed in Chap. 1). However, more recently it has been shown that the number of sperm carried by some male parasitoids can also be a limiting factor in reproduction (Boivin, 2013). Suggested studies on sperm use, limitation, depletion and competition are described in Chap. 4 (Sect. 4.5).
2.3.8 Accessory Glands
In many female insects there are obvious glands, occurring as a pair or two pairs of pouches, associated with the anterior end of the common oviduct (vagina), which are termed accessory or colleterial glands (Figs. 2.4a, e, 2.7 and 2.8) (King & Ratcliffe, 1969; Quicke, 1997). It is generally understood that they produce secretions which coat the egg as it is laid. These glands are present in nearly all chalcidoid parasitoids; different families have different numbers and arrangements (King & Copland, 1969; Copland & King, 1971, 1972a, b, c, d; Copland et al., 1973; Copland, 1976), but hardly anything is known about their function. They have been implicated in the formation of feeding-tubes of host-feeding Hymenoptera (Flanders, 1934) but they seem to be equally developed in species that do not host-feed. Some Torymidae have the largest glands, and Eupelmus urozonus (Eupelmidae) has both large glands and enormous extensions from the calyx. Noting the condition of the glands in dissected females under various experimental treatments may be instructive as to their function.
2.3.9 Dufour’s (Alkaline) Gland
The Dufour’s or alkaline gland (Figs. 2.4a, b, d, 2.15 and 2.16) is well developed in the Hymenoptera. It discharges into the anterior common oviduct at the base of the ovipositor. In parasitoids it is the source of the parasitoid marker substances (pheromones) discussed in Sects. 1.64 and 1.9.4. The Dufour’s gland is normally a thin-walled sac containing an oily secretion. It is a long tubular structure in most chalcids but may be extremely small in some braconid wasps, e.g., Cotesia glomerata, concealed among the bases of the ovipositor stylets. Gas chromatography can be used to reveal the chemical composition of gland secretion; Marris et al. (1996) showed that in Venturia canescens there are quantitative between-strain differences in composition, indicating that different genetic lines produce characteristic cocktails of marker pheromone.

Dufour’s or alkaline gland in parasitoid wasps: a Eurytoma sp. (Eurytomidae); b Colastes sp. (Braconidae)
2.3.10 Venom Gland (Acid Gland, Poison Gland)
The venom gland (= acid gland, poison gland), like the Dufour’s gland, empties into the base of the ovipositor (Fig. 2.4a, b, d). It is either a simple structure as in Chalcidoidea (Fig. 2.17), a convoluted tubular structure as in Ichneumonidae, or a structure of intermediate complexity as in some Braconidae (Fig. 2.17) (see also Quicke, 1997). The venom of some idiobionts induces permanent paralysis, arrested development or death in the host, whereas that of koinobionts induces temporary paralysis or no paralysis at all (see Quicke, 1997, for a discussion of these and other effects). Associated with the venom gland is a reservoir that has muscular walls; the reservoir may have additional secretory functions (Robertson, 1968; van Marle & Piek, 1986). The venom gland has been reported to be a source of viruses or virus-like particles. The structure and function of the venom gland system of hymenopterans has been investigated by several workers (Ratcliffe & King, 1969; Piek, 1986; see also Quicke, 1997, and references contained therein), but there is considerable scope for further investigative work into gland structure and function.

The venom gland in parasitoid wasps: a unidentified Mymaridae, showing simple gland and reservoir; b Cotesia sp., showing more complex, (i.e., bifurcate) gland and reservoir
2.4 Male Reproductive System
An example of the reproductive system in male hymenopterans is shown in Fig. 2.18. The system comprises a pair of testes and usually a pair of accessory glands. For further details, see Quicke (1997). The possible role of secretions from the latter in parasitoid mating behavior is discussed in Sect. 4.3.6.

Source Sanger and King (1971). Reproduced by permission of The Royal Entomological Society of London
Schematic representation of reproductive system in male Chalcidoidea.
2.5 Sex Ratio
This aspect of parasitoid and predator biology (including the causes of biased primary and secondary sex ratios), is dealt with in Chaps. 1 (Sect. 1.11) and 3 (Sect. 3.4) (see also Chaps. 4 and 5). The role of Wolbachia endosymbionts in biasing sex ratios is touched upon in Chaps. 3, 4, and 6. Some of the biotic and physical factors discussed elsewhere in this chapter (below) may influence secondary sex ratio. For a protocol for studying the effects of (constant and variable) temperatures on progeny sex ratio in parasitoids, see Kfir and Luck (1979).
2.6 Locating Eggs in Hosts
Parasitoid eggs may need to be located, by researchers, in or on hosts for a variety of reasons, including the measurement of fecundity and parasitism (Sects. 2.7.3, 7.2, and 7.3), investigations of parasitoid behaviour (Sects. 1.6.6, 1.9, 1.10, and 1.14) and studies of parasitoid communities (Sects. 6.2.9, and 6.3.5). The degree of difficulty experienced in locating eggs will depend upon factors such as the relative sizes of the host and the parasitoid egg, the amount of fat body tissue, whether the eggs lie within organs or in the haemocoel, the size of other organs, and the degree of sclerotisation of the host integument (Avilla & Copland, 1987). The eggs of endoparasitoids are generally much more difficult to locate than those of ectoparasitoids.
Preferably, hosts should be killed either: (a) by narcotising them (e.g., using CO2, ethyl acetate), in which case they should be dissected shortly afterwards, or (b) by placing them in a deep freeze, in which case they can remain dissectable for several months. Attempting to locate eggs in hosts that have been preserved in alcohol is likely to prove very difficult indeed.
If endoparasitoid eggs prove difficult to locate, parasitised hosts should be kept alive long enough for the eggs to swell (i.e., in hydropic species) and/or the first-instar larvae to form, the parasitoid immature stage in either case becoming more easily visible.
2.7 Fecundity
2.7.1 Introduction
The term fecundity refers to an animal’s reproductive output, in terms of the total number of eggs produced or laid over a specified period, and should be distinguished from fertility which refers to the number of viable progeny that ensue. From the standpoint of population dynamics, fertility is the more important parameter, as it is the number of progeny entering the next generation. However, because fertility can be relatively difficult to measure (Barlow, 1961), fecundity measurements are often used instead.
A distinction is drawn between potential fecundity and realised fecundity. A species’ potential fecundity is usually taken to be the maximum number of eggs that can potentially be laid by females. For example, in the laboratory we might take a strictly pro-ovigenic parasitoid (Sect. 2.3.4), dissect its ovaries at eclosion and then count the number of eggs (all mature) contained within. This number is the insect’s potential lifetime fecundity. Synovigenic parasitoids emerge with some immature eggs, so in these insects potential fecundity is the number of mature eggs (the initial egg load) plus the number of immature eggs.
Potential fecundity can be compared with the number of eggs actually laid over the life-span when excess hosts are provided in the laboratory, i.e., lifetime realised fecundity. The figure for lifetime realised fecundity is likely to fall short of the estimate for lifetime potential fecundity. This applies especially to females whose realised fecundity is measured in the field, where female life-span is likely to be significantly shorter (Leather, 1988).
Fecundity is a variable feature of a species, influenced by a range of intrinsic and extrinsic (physical and biotic) factors. The evaluation of a natural enemy for biological control requires a study of the influence of these factors (and of possible interaction effects between certain factors) on potential and realised fecundity, and if possible, fertility. The data can be used in estimating a species’ intrinsic rate of increase which is discussed later in this chapter (Sect. 2.11). Fecundity (potential or realised) is also used as a measure of individual fitness in insects (e.g., Hardy et al., 1992; Visser, 1994; Ellers et al., 1998; Roitberg et al., 2001).
When assessing the influence of a particular biotic factor on lifetime realised fecundity, it is important to determine to what extent variation in fecundity can be explained by variation in longevity. For example, take the positive relationship between female size and fecundity. The greater longevity of larger females compared with smaller females could be the sole reason why larger females are more fecund. Females may have the same average daily egg production irrespective of body size, but by living longer, larger females lay more eggs over their life-span (Sandlan, 1979). For a discussion of fecundity‒longevity relationships within and among species of predatory coccinellids, see Dixon (2000).
It is possible to obtain measures of realised fecundity without actually counting eggs: Takagi (1985) and Hardy et al. (1992) counted the number of adult offspring produced and took account of the intervening mortality processes, so deriving estimates of the number of eggs originally deposited. In some arthropod predators, such as spiders, it is easy to measure realised fecundity by rearing individual mated females and by removing and rearing out their egg sacs throughout the course of their adult life (Öberg, 2009; Drapela et al., 2011).
2.7.2 Cohort Fecundity Schedules
A (realised) fecundity schedule for a parasitoid or predator species can be constructed by taking a cohort of standardised females (standardised in terms of physiological age, size, and oviposition and sexual experience) and exposing them individually to some chosen set of constant environmental conditions from adult emergence until death. The number of eggs laid per female per day is then plotted, giving the age-specific realised fecundity of the species (Fig. 2.19; see also Fig. 2.65). The data obtained from the experiment can also be used to calculate both the lifetime realised fecundity of the species (used by evolutionary ecologists as a measure of fitness, see Roitberg et al., 2001), and the average daily oviposition rate (lifetime realised fecundity divided by the average longevity). Using the same data, the cumulative realised fecundity of the parasitoids can also be plotted against either female age (Fig. 2.20) or cumulative degree-days (Minkenberg, 1989) (Sect. 2.9.3). It is expressed as the proportion of the highest mean total number of eggs laid by females of any one treatment (e.g., temperature or host density treatment), this total representing the maximal fecundity realisable by females. The usefulness of the cumulative realised fecundity measure is that it tells us to what extent parasitoids achieve their maximum lifetime fecundity (~fitness) under particular conditions, and allows easier comparison of the effects of different treatments. Using the data from a fecundity schedule, the parameters mx (age-specific fecundity) and lx (age-specific survival) can be used in the calculation of the intrinsic rate of increase (rm) of the parasitoid population (Sect. 2.11). If fecundity schedules are constructed for cohorts held under different host or prey availability regimes, the number of hosts or prey parasitised or eaten can be recorded and the data used to plot age-specific and lifetime functional responses (the numbers parasitised or eaten versus the numbers available; Sect. 1.14), as was done by Bellows (1985a).

(Source Sahragard et al. 1991). Reproduced by permission of Blackwell Verlag GmbH
The age-specific fecundity schedule for two parasitoid species: a Aphidius matricariae maintained at different temperatures and at constant host density conditions (source Hag Ahmed, 1989); b Dicondylus indianus (Dryinidae) maintained at different host densities (4–60) and constant temperature conditions. The plot of host density 2 treatment is shown along with that of the host density 4 treatment (vertical bars = SE).

Source Sahragard et al. (1991). Reproduced by permission of Blackwell Verlag GmbH
The cumulative realised fecundity of the dryinid wasp Dicondylus indianus, measured over the lifetime of females, at different levels of host availability. Fecundity is expressed as the proportion of the highest mean total number of eggs laid by females of any one treatment, this total representing the maximal fecundity that could be realised.
An important consideration when using the aforementioned experimental design is that as time goes on, the data are limited to progressively fewer females. To obtain fecundity data that are statistically meaningful, particularly data for the latter part of adult life, a very large starting density of parasitoid or predator females may be required. This, however, may increase the investigator’s workload to an unacceptable level.
In most parasitoids and in predators, the realised fecundity schedule (and also the ovigenesis schedule, see Sect. 2.3.5) will show a rise in the number of eggs produced or laid per day until a maximum rate of productivity is reached. Thereafter a gradual decrease occurs until reproduction ceases altogether at or shortly before the time of death (see Kindlmann et al., 2001, for a discussion of this ‘triangular fecundity function’) (Fig. 2.19) If there is a period of post-reproductive life, it is usually very short (see Jervis et al., 1994, for exceptions). Fecundity schedules vary between species, depending on the reproductive strategies of the insects, e.g., strict pro-ovigeny and different degrees of synovigeny (Sect. 2.3.4). As described below, environmental factors (temperature, humidity, photoperiod, light quality, light intensity, host or prey availability) modify these patterns in a number of ways, and ideally the role of each factor in influencing the schedule ought to be investigated separately. This, however, may not be practicable, in which case the usual procedure is to expose a predator or parasitoid to an excess of prey or hosts (replenished or replaced daily), at a temperature, a relative humidity, or a light intensity similar to the average recorded in the field (Dransfield, 1979; Bellows, 1985a).
2.7.3 Effects of Biotic Factors on Fecundity
2.7.3.1 Host Density (Parasitoids)
If fecundity schedules are constructed for a parasitoid species over a range of host densities, females will be found to lay on average more eggs per day at higher host densities than at low densities (Fig. 2.21). Also, the lifetime pattern of oviposition, i.e., the shape of the curve, varies with host density. There may be a shift in the fecundity schedule, with wasps concentrating oviposition into the earlier part of adult life (Fig. 2.19b). At high host densities, hosts are more readily available for the wasps to attack, whereas at low densities oviposition rates are lower because the wasps have to search a greater area (and probably for a longer period of time), so expending energy that might otherwise be used in ovigenesis (Sahragard et al., 1991). Venkatesan et al. (2009) reported that in the laboratory a parasitoid:host ratio of 1:1 resulted in maximum fecundity and number of progenies, and increasing the densities of either of these two had an inverse effect on oviposition. As far as lifetime fecundity is concerned, the relationship with host density is either a curvilinear one, resembling a Type 2 functional response (defined in Sect. 1.14), or a sigmoid one, resembling a Type 3 functional response.

The relationship between fecundity (measured as both the mean number of eggs laid per day and the total number of eggs laid over adult life) and host availability in the parasitoid Aphidius smithi (Braconidae) (Error bars = SE). Based on data taken from Mackauer (1983)
A difficulty that may arise when using low host densities is ovicide, i.e., the removal of eggs from parasitised hosts, although the number of (ecto)parasitoid species that practice ovicide is considerably smaller than the number of predator species that do so. Among parasitoids, ovicide has been observed in several families of primary parasitoids and hyperparasitoids (Strand & Godfray, 1989; Mayhew, 1997; Netting & Hunter, 2000; Pérez-Lachaud et al., 2004; Nakashima et al., 2016). Predaceous females of chrysopid lacewings are well known for eating their own eggs in laboratory cultures (Principi & Canard, 1984), as are some coccinellids (Michaud, 2003). Where cannibalism is suspected, video-recording techniques may help in determining the number of eggs lost in fecundity experiments.
2.7.3.2 Food Consumption
Non-predaceous Females
The females of many parasitoid and some predator species (e.g., Chrysoperla carnea (Chrysopidae) and adults of all aphidophagous Syrphidae) feed as adults solely on materials such as honeydew, nectar and pollen (Chap. 8), and consume substitute foods such as diluted honey in the laboratory (Chap. 8; see also Benelli et al., 2017). Even arthropod taxa that are often to be considered as wholly predaceous, such as spiders, often consume pollen or nectar to supplement dietary prey (Taylor & Foster, 1996; Taylor & Pfannestiel, 2009; Kuja et al., 2012). Females that are either deprived of food or experience a reduced intake (but are given water) lay fewer eggs or no eggs at all. Some non-host/prey foods have a more beneficial effect on fecundity than others (Krishnamoorthy, 1984; Principi & Canard, 1984; Wratten et al., 2003; Heimpel & Jervis, 2004; Jervis et al., 2004; Heimpel, 2019).
For an experimental investigation into the effects of adult nutrition on the fecundity schedule of a parasitoid to be ecologically meaningful, the effects of food provision need to be considered in the light of variations in host availability. This is done by taking a cohort of standardised females and providing the insects with one of a range of host densities (see Host Density, above) and with a chosen diet for the duration of their lives, the hosts and food being replenished daily. If the effects upon ovigenesis of combined host deprivation/food provision are to be investigated, then, obviously, hosts are not provided to one set of females. One likely effect of providing food to females is that, at low host densities, females maintain a higher rate of oviposition than they can when deprived of food. As far as the effects of food provision on lifetime fecundity are concerned, it will be necessary to carry out a statistical analysis to show whether or not any improvement in lifetime fecundity brought about by feeding is simply a result of an increase in longevity and not an increase in the daily rate of ovigenesis (Sect. 2.8.3).
Predaceous Females
We would expect the fecundity of predaceous females to be strongly influenced by prey availability. This relationship was modelled in a simple way by Beddington et al. (1976) and Hassell (1978). If it is assumed firstly that some of the food assimilated by the female needs to be allocated to maintenance metabolism (and will therefore be unavailable for ovigenesis), and secondly that there is insufficient carry-over of food reserves from larval development for the laying of any eggs (i.e., synovigeny-anautogeny), then there will be a threshold prey ingestion rate, c, below which reproduction ceases, but above which there is some positive dependence between fecundity F and ingestion rate I. If it is assumed thirdly that this relationship is linear, then (Beddington et al., 1976):
where e, λ and c are constants; e is the average biomass per egg. There is empirical support for this model (Mukerji & LeRoux, 1969; Mills, 1981; Fig. 2.22). In Mills’ (1981) experiment five feeding levels were used, the daily ration of individual females corresponding to between 1 and 2 times the average female weight.

To express fecundity in terms of prey density, we first assume ingestion rate to be proportional to the number of prey eaten, Na, such that:
where k is a constant which depends upon the biomass (size) of each prey. Combining Eqs. 2.1 and 2.2 with the simplest functional response model, Holling’s (1966) disc equation (Sect. 1.14), gives:
This model predicts that fecundity will rise at a decreasing rate (i.e., will decelerate) towards an upper asymptote as prey density increases, in the manner of the Type 2 functional response (Sect. 1.14), and also that the curve will be displaced forwards along the prey axis, i.e., away from the origin. There is empirical support for this relationship, both from laboratory studies (Dixon, 1959; Ives, 1981; Matsura & Morooka, 1983 (Fig. 2.23a, b) and from field studies (Wratten, 1973; Mills, 1982) (Fig. 2.24a, b). Anautogenous, obligate host-feeding parasitoids will have a similar fecundity/host density curve. In autogenous predators, however, ovigenesis and oviposition can occur without the female first feeding on prey, so the curve of these insects will not be displaced along the prey axis.

Fecundity as a function of prey density (functional response): a in the coccinellid beetle Adalia decempunctata (source Beddington et al., 1976, who used data from Dixon, 1959); b in the mantid Paratenodera angustipennis: (i) first ovipositions, (ii) second ovipositions (oötheca = egg mass). Below the intercept of the curve (fitted by eye) with the prey axis, the insects allocate matter to maintenance processes only (source Matsura & Morooka, 1983). a Reproduced by permission of Blackwell Scientific Publications Ltd; b by permission of Springer Verlag

Fecundity as a function of prey density: a relationship between logarithm of number of eggs laid by the coccinellid Adalia bipunctata, and logarithm of density of aphids in the field (data from Wratten, 1973); b relationship between number of eggs laid per adult Adalia bipunctata and aphid density in the field (source Mills, 1982). a Reproduced by permission of Blackwell Scientific Publishing Ltd; b by permission of The Association of Applied Biologists
In the bug Anthocoris confusus, the viability (fertility) of eggs also varies with prey availability (Evans, 1973; Beddington et al., 1976). This relationship may be due to the female allocating less biomass per developing egg at lower prey densities, i.e., e in Eq. (2.1) is not a constant (Beddington et al., 1976). In the Western black widow spider, however, urban-living spiders were in worse physical condition, laid fewer eggs, and invested less metabolic resources per egg than desert-living widow spiders despite greater prey availability in the former habitat. Therefore, resource abundance is not always a reliable indicator of fecundity and fitness in predatory arthropods (Johnson et al., 2012).
There are also grounds for questioning the assumption that k in Eq. (2.2) is a constant (Beddington et al., 1976). If this assumption is correct, then the relationship between fecundity and the number of prey actually killed will be rectilinear, which is the case for Coccinella undecimpunctata aegyptiaca (Fig. 2.25). However, as noted in Chap. 1 (Sect. 1.14), when the rate of encounter with prey is high, some predators consume proportionately less of each prey item. This behaviour will alter the shape of the fecundity versus prey killed curve, from rectilinear to curvilinear (Beddington et al., 1976). The shape of the fecundity versus prey density curve will also be altered, having an earlier ‘turnover’ point and also being more ‘flat-topped’ (Beddington et al., 1976).

Supplying predators with non-prey foods together with prey might lower the ingestion rate threshold, since less of the prey biomass assimilated by the female needs to be allocated to maintenance metabolism. If so, the fecundity‒prey density curve of an anautogenous species will be shifted backwards along the prey axis, i.e., towards the origin. The shape of the curve is also likely to be altered.
2.7.3.3 Prey and Host Quality
Prey quality is likely to affect fecundity, as has been shown for Coccinellidae, Carabidae, Anthocoridae, and host-feeding Aphelinidae (Hariri, 1966; Blackman, 1967; Hodek, 1973; Wilbert & Lauenstein, 1974; Spieles & Horn, 1998; Evans et al., 1999; Venzon et al., 2002). Some coccinellids and carabids are unable to reproduce at all if confined to a diet of certain prey species (Hodek, 1973; Spieles & Horn, 1998; Evans et al., 1999). Among parasitoids, Goniozus nephantidis, a larval parasitoid of Opisina arenosella, laid the most eggs and produced the most progeny on largest caterpillars of both the natural and a factitious host species (Shameer et al., 2002).
Blackman (1967) found that adults of the coccinellid beetle Adalia bipunctata fed on Aphis fabae during both larval development and adult life were less than half as fecund as those fed on Myzus persicae. Also, their eggs were smaller and less fertile. By carrying out another experiment in which adult beetles were fed on the opposite prey species to that fed upon by the larvae, Blackman (1967) tested whether the prey species given to larvae affected the fecundity of the adult. It did not: fecundity depended strongly upon the species fed upon by the adult. Similarly, Sigsgaard et al. (2001) tested growth, survival and fecundity of the dwarf spider Atypena formosana (Linyphiidae) fed on different prey species, and found that the spiders performed significantly better and produced more progeny when reared on some prey species than others. However, it is not clear from either study whether the effects of prey availability were monitored. The results of a study by Hariri (1966) are shown in Fig. 2.26. Evans et al. (1999) showed that when two species of predatory coccinellids are exposed to limited numbers of their preferred aphid prey, fecundity is enhanced if females are supplied with an additional prey species (a weevil), despite the fact that females given weevils alone cannot produce eggs. In predators such as coccinellids the pre-oviposition period may be either shortened or prolonged, depending on the prey species fed upon by the female (Hodek, 1973).

Source Hariri (1966). Reproduced by permission of W. Junk Publishers
Fecundity of the coccinellid beetle Adalia bipunctata maintained on different prey species, Acyrthosiphon pisum and Aphis fabae.
2.7.3.4 Consumption of Food Supplements and Substitutes (Predaceous Females)
As we have suggested, fecundity is very likely to vary with the availability (and the quality) of plant-derived and other non-host/prey foods (especially so in the case of species having a high requirement for such nutrient input), taken either as supplements (when prey are available) or as substitutes (when prey are absent). Several predators have been shown to have a higher rate of egg production when given non-host foods as a supplement (e.g., Cocuzza et al., 1997a; Crum et al., 1998), but except for some artificial diets, non-prey foods are a poor substitute for prey materials, in terms of their effects on fecundity (e.g., Cocuzza et al., 1997a; Evans et al., 1999) (this may not apply to predator species whose diet is normally comprised largely of plant materials). In Aphytis melinus the benefit, to fecundity, of host-feeding cannot be realised unless females also feed on sugar (Heimpel et al., 1997a; Chap. 8).
2.7.3.5 Mutual Interference
Mutual interference between female parasitoids results in a reduction in individual searching efficiency (Sect. 1.15.3) which will result in a reduction in the rate of oviposition, i.e., fecundity. In the predator Anthocoris confusus fecundity declined with increasing adult density, despite the fact that prey density was high at all times and was unlikely to limit egg production through prey exploitation (Evans, 1976; Fig. 2.27). To determine whether mutual interference was a result of confining predators in his experimental cages, Evans (1976) measured fecundity in relation to predator density in females in a large cage within which they were free to move from plant to plant. A significant decrease in fecundity with increasing predator density was still recorded.

Source Evans (1976). Reproduced by permission of Blackwell Publishing
The relationship between fecundity and predator density in the predator Anthocoris confusus. There was a decline in fecundity despite aphid prey density being high at all times, i.e., the cause of the decline was mutual interference, not exploitation of prey.
Mutual interference, and therefore interference-mediated reductions in fecundity, cannot be assumed to occur in all predators. For example, Hattingh and Samways (1990) found no evidence for mutual interference in adults of three species of Chilocorus (Coccinellidae). Feeding rate did not decrease and dispersal did not increase with increasing beetle density. Among parasitioids, mutual interference between adult females during the host- and clutch-guarding phases in the bethylid G. nephantidis led to considerable reductions in the number of offspring produced, even though each female was experimentally provided with a host (Sreenivas & Hardy, 2016).
2.7.3.6 Female Body Size
In the laboratory, lifetime fecundity, and also reproductive correlates such as ovariole number and egg load (the latter usually recorded either at or shortly after eclosion), have been shown to increase with increasing body size within species (Fig. 2.28) (e.g., Sandlan, 1979; Mani & Nagarkatti, 1983; Ernsting & Huyer, 1984; Nealis et al., 1984; Scott & Barlow, 1984; Waage & Ng, 1984; Bellows, 1985b; Juliano, 1985; Liu, 1985a; Takagi, 1985; Collins & Dixon, 1986; Opp & Luck, 1986; van Vianen & van Lenteren, 1986; Banks & Thompson, 1987a; Moratorio, 1987; van den Assem et al., 1989; Heinz & Parrella, 1990; O’Neill & Skinner, 1990; le Masurier, 1991; Hardy et al., 1992; Rosenheim & Rosen, 1992; Sequeira & Mackauer, 1992b; Croft & Copland, 1993; Zheng et al., 1993b; King & King, 1994; Visser, 1994; Weisser et al., 1997; Ellers et al., 1998; Olson & Andow, 1998; Taylor et al., 1998; Harvey et al., 2000b, 2001; Mills & Kuhlmann, 2000; Martínez-Martínez & Bernal, 2002; Pexton & Mayhew, 2002). There are, however, a few exceptions to this pattern (e.g., Rotheray & Barbosa, 1984; Bigler et al., 1987; Corrigan & Lashomb, 1990; Visser, 1994; Coombs, 1997; Mills & Kuhlmann, 2000).

The positive correlation between fecundity measures (egg load, lifetime fecundity) and body size in females: a egg load in Nasonia vitripennis (source O’Neill & Skinner, 1990); b lifetime fecundity in Notiophilus biguttatus; elytra width is expressed in micrometer units (100 units = 5.0 mm) (source Ernsting & Huyer, 1984); c lifetime fecundity in Lariophagus distinguendus (Pteromalidae) (source van den Assem et al., 1989). a Reproduced by permission of The Zoological Society of London; b by permission of Springer Verlag; c by permission of E.J. Brill (Publishers) Ltd
Some of the restricted number of field studies conducted to date have demonstrated a positive intraspecific relationship between body size and fecundity (Visser, 1994; Kazmer & Luck, 1995; Ellers et al., 1998, 2001; Lauzière et al., 2000; Bezemer & Mills, 2003; Kasamatsu & Abe, 2015; Wang & Keller, 2020).
In Nasonia vitripennis the slope of the egg load‒body size relationship recorded 48 and 72 h after emergence was steeper in unfed females than in fed ones (Rivero & West, 2002). This result could explain why at least some researchers have recorded a difference between the size‒fecundity plots of field and laboratory populations of a species. Small-sized wasps emerge with smaller fat reserves, and so rely more than large wasps upon obtaining food to fuel ovigenesis (Rivero & West, 2002). Because in the field food can often be limiting (Heimpel & Jervis, 2004), small-sized wasps suffer disproportionately in terms of their realised fecundity.
In some species, the relationship between fecundity and body size correlates over only part of the size range, with fecundity reaching a maximum in insects above a threshold size, e.g., Aphidius ervi (Sequeira & Mackauer, 1992b). It is therefore important, in experiments, to provide the complete field range of host sizes to parasitoids, so as to avoid obtaining a misleading impression of the ‘true’ size‒fecundity relationship. In predators, larger females have a shorter pre-oviposition period than smaller ones (Zheng et al., 1993b), and this may contribute to their higher lifetime fecundity.
Body size is usually measured in terms of the width or length of some body part, such as the head, thorax, or hind tibia. Some authors also assess size by dry or fresh body weight. More recently, a new estimate of body condition has been devised, which combines linear and volumetric parameters of body size into a single scaled mass measurement (Peig & Green, 2009). Body size, mass or condition is influenced, within species, by:
-
1.
Larval feeding history, i.e., prey availability, host size, host species during development, quality of host diet (note that this includes plant resistance effects, i.e., bottom-up effects), clutch size, superparasitism (Dixon, 1959; Russel, 1970; Hodek, 1973; Dransfield, 1979; Sandlan, 1979; Cornelius & Barlow, 1980; Beckage & Riddiford, 1983; Principi & Canard, 1984; Scott & Barlow, 1984; Waage & Ng, 1984; Juliano, 1985; Liu, 1985a; Sato et al., 1986; Eller et al., 1990; Bai & Mackauer, 1992; Harvey et al., 1993, 1994, 2000b; Zheng et al., 1993a, b; van Dijk, 1994; Bernal et al., 1999; Martínez-Martínez & Bernal, 2002) (Fig. 2.29).
Fig. 2.29 
Source Zheng et al. (1993b)
The effect of larval feeding history on fecundity in the lacewing Chrysoperla carnea. The data points indicate the average number of eggs laid, per 2-day period, of females provided with different levels of prey availability as larvae. Zheng et al. (1993b) showed that when lacewing larvae are fed fewer prey than they can potentially consume, they develop into smaller and less fecund adults than when they are given an overabundance of prey. Adults of C. carnea are non-predaceous, feeding on nectar, pollen and honeydew, and fecundity is also affected by consumption of these foods. Therefore, female fecundity is determined both by larval feeding history and by adult food consumption.
-
2.
The temperature during larval development (Ernsting & Huyer, 1984; Nealis et al., 1984; van Dijk, 1994) (Fig. 2.30).
Fig. 2.30 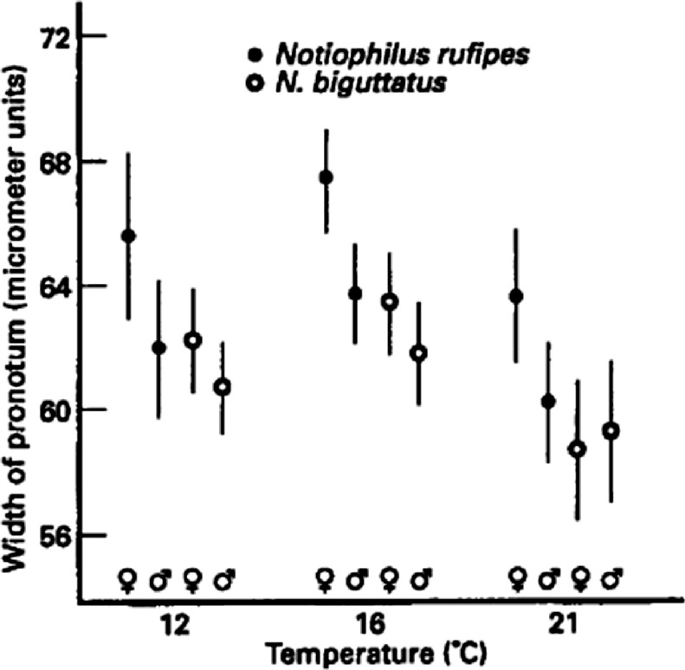
Source Ernsting and Huyer (1984). Reproduced by permission of Springer Verlag
The effect of temperature during larval development upon adult size (as measured by pronotum width) in two species of carabid beetle and for males and females. Means and the corresponding 95% confidence limits are shown, expressed in micrometer units (100 units = 2.5 mm). The data show a decline in adult size at either side of an optimum temperature for total biomass production. The effects upon size are translated into variations in fecundity.


If an experiment, for whatever purpose, requires females to be of different sizes/fecundities, by far the simplest way of sorting insects according to size is to measure the parasitoids or predators when they are pupae (pupal and adult size being strongly correlated), so avoiding any difficulties and/or harmful side effects associated with handling the adults.
2.7.3.7 Mating
Female predators and dipteran parasitoids, if they are either unmated or sperm depleted, lay much smaller numbers of eggs (e.g., very few in coccinellids, Dixon, 2000, half as many in the bug Podisus maculiventris, De Clercq & Degheele, 1997) or none at all. Eggs, if laid, are infertile. To achieve their full reproductive potential, females of some species may need to mate several times (Sem’yanov, 1970; Ridley, 1988). By contrast, if a female arrhenotokous hymenopteran parasitoid lacks sperm for whatever reason, she can lay viable (male) eggs, so her fecundity should not be affected by mating. Mating was found not to affect egg load in the braconid wasp Phanerotoma franklini, but in this case mating was not confirmed to have occurred in all cases (Sisterton & Averill, 2002).
In experiments aimed at testing for the effects of mating, it is essential to establish that mating really has taken place. Caging females with a male is no guarantee that the insects have either engaged in mating behaviour or that the females have been inseminated. Some species or arthropod groups are easier to observe mating than others. For instance, some parasitoid wasps and spiders readily mate when males are placed with females, whereas in other species females repeatedly resist mating attempts made by males or mating takes place out of sight within the confines of cocoons (Chap. 4). It is therefore imperative to visually observe successful mating to ensure that it has taken place. If an effect of mating upon fecundity is found, the question arises, in the case of females, as to whether ovigenesis has been enhanced because of the nutrient contribution made by the male, in the form of sperm or spermatophore.
2.7.3.8 Field Predation
Predator-induced mortality of adult parasitoids and predators may cause realised fecundity to be reduced well below the level achieved under laboratory conditions. The extent of the reduction can be estimated by marking and releasing individuals and cohorts of parasitoids and predators, recording predation events (Heimpel et al., 1997b), and then relating the field survivorship data to the natural enemies’ fecundity schedule recorded under optimum laboratory conditions.
2.7.4 Effects of Physical Factors on Fecundity
2.7.4.1 Temperature
The rate of egg production, and hence the age-specific and the lifetime fecundity of predators, and parasitoids, will vary in relation to temperature (van Lenteren et al., 1987; Braman & Yeargan, 1988; Miura, 1990; Li & Jackson, 1996; Hentz et al., 1998; Ellers et al., 2001; Pervez & Omkar, 2004; Pandey & Tripathi, 2008; Murthy et al., 2008; Aung et al., 2010; Watt et al., 2016; Fig. 2.31). The influence of temperature on the fecundity schedule of a natural enemy species can be investigated by taking cohorts of standardised females and exposing each of them to one of a range of temperatures for their lifetimes. Females of all the cohorts are exposed to the same conditions of host/prey, food and water availability (hosts and prey need to be replaced daily), humidity and photoperiod, etc. A constant humidity will probably be the most difficult of all these factors to maintain. Temperature may influence the rate of prey consumption (Mills, 1981; Pickup & Thompson, 1990), so temperature-related variation in prey consumption should be looked for.

Source van Lenteren et al. (1987). Reproduced by permission of Blackwell Verlag GmbH
The number of mature oöcytes per ovariole in the parasitoid Encarsia formosa (Aphelinidae) kept for several days after eclosion without hosts, either without food or on a diet of honey, at two different temperatures.
The effect of temperature upon egg load in a synovigenic insect can be investigated by following the protocol, used for Aphytis parasitoids, of Rosenheim and Rosen (1992). Parasitoid pupae are isolated, and adults, when they emerge, are kept with a supply of food (honey), at each of a range of temperatures for 24 h. The adults are then dissected and the numbers of mature eggs they contain are counted. The results of Rosenheim and Rosen’s (1992) study are shown in Fig. 2.32, which also shows the influence of body size upon early-life potential fecundity (Sect. 2.7.3).

Source Rosenheim and Rosen (1992). Reproduced by permission of Blackwell Publishing
The influence on egg load of parasitoid size and the temperature at which females have previously been held from eclosion, in Aphytis lingnanensis (Aphelinidae).
The effects of climate warming and especially climate extremes are making studies exploring the effects of temperature and other abiotic parameters more and more relevant in the studies of natural enemy-prey/host and multitrophic interactions. The frequency, duration and intensity of climate extremes, such as heat waves, has increased markedly over the past 30 years (Perkins et al., 2012). Because insects and other arthropods are ectotherms, they are potentially exposed to stresses that are becoming unprecedented in their recent evolutionary history (Harvey et al., 2020; Ma et al., 2021). Temperature can alter functional responses in parasitoids and predators and reduce their ability to exploit and suppress their hosts or prey (Romo & Tylianakis, 2013; Kalinkat et al., 2015; Chen et al., 2019a). Over time, this can lead to phenological mismatches between the natural enemies and their prey or hosts (Damien & Tougeron, 2019).
It is generally the case that there is an optimum temperature range outside of which the insect either cannot maintain ovigenesis and oviposition or is unable to do so for long (Force & Messenger, 1964; Greenfield & Karandinos, 1976; Figs. 2.19a and 2.33). Although there is great variation from species to species, the limits to the favourable range for oviposition are often narrower than those for ovigenesis (Bursell, 1964). Within the optimum range, one effect of higher temperature on the pattern of oviposition is to shift the fecundity schedule, with the ovigenesis/oviposition maximum occurring earlier in life (Siddiqui et al., 1973; Ragusa, 1974; Browning & Oatman, 1981; Miura, 1990).

Source Force and Messenger (1964). Reproduced by permission of The Ecological Society of America
Comparison of mean lifetime fecundity of the aphid parasitoids Praon palitans, Trioxys utilis (Braconidae) and Aphelinus semiflavus (Aphelinidae), over a range of constant temperatures.
In the coccinellid Adalia bipunctata fecundity increases up to 2 °C, correlating well with the increase in food consumption rate. However, above that temperature fecundity declines despite a continued increase in consumption.
Higher temperatures may constrain fecundity through increased metabolic costs i.e., daily maintenance requirement (Mills, 1981; Ellers et al., 2001), although Ives (1981) found no significant influence of temperature on the maintenance requirement of the two Coccinella species he studied. More recently, it has been shown that exposure to higher temperatures can induce sterilisation in male parasitoids by killing their sperm, thus preventing their ability to inseminate females (Nguyen et al., 2013). Upper thermal limits on insect survival and fecundity have been extensively discussed by Bowler and Terblanche (2008) and Walsh et al. (2019).
No attempts appear to have been made to describe mathematically the relationship between oviposition rate and temperature, as has been done with development. Several workers have found that alternating temperatures increase insect fecundity (Messenger, 1964a; Barfield et al., 1977a; Ernsting & Huyer, 1984), and thus it may be invalid to estimate oviposition rates in the field directly from constant temperature data. A similar approach to that used for estimating development based on cyclical temperature regimes might give more meaningful results but has not yet been attempted (Sect. 2.9.3).
Some adult predators may be able to maintain maximal levels of ovigenesis through thermoregulation achieved either by thermal preference behaviour (including basking), by employing physiological mechanisms, and by employing physical adaptations such as melanisation of the integument (Dreisig, 1981; Brakefield, 1985; Miller, 1987; Stewart & Dixon, 1989).
Temperature is known to influence the length of pre-oviposition period in parasitoids and predators (e.g., Stack & Drummond, 1997; Seal et al., 2002). Acclimation to temperature extremes may be useful in inundative releases, but any benefits could be offset by fitness costs (Scott et al., 1997).
2.7.4.2 Light Intensity and Photoperiod
The deleterious effects of light pollution on insects are increasingly being acknowledged (Eisenbeis et al., 2009; Grubisic et al., 2018; Firebaugh & Haynes, 2019). For instance, the intensity, duration and quality of light have an important influence on the biology and behaviour of most insects. High light intensity seems to increase the general activity of diurnal predators and parasitoids. For example, adults of the coccinellid beetle Cryptolaemus montrouzieri spend a greater proportion of their time walking and make more attempts to fly in bright light than under dim light conditions (Heidari, 1989). Light quality and intensity may also influence the close-range perception of hosts. Care must therefore be taken in fecundity experiments to provide sufficient light for normal activity, but bear in mind that in the field, bright light conditions are normally associated with increased radiant heat. Laboratory experiments that involve varying light intensity alone will require the radiant heat component of light to be removed, using suitable glass and water filters. Even cold-fibre optic lamps used in microscopy can raise the body temperature of dark-coloured insects by at least 2 °C above ambient. A thermocouple (Unwin & Corbet, 1991) inserted into the body of a dead insect will enable the heat absorbed from a light source to be measured and suitable infra-red filters to be devised (Heidari & Copland, 1993). Owens and Lewis (2018) reviewed studies examining the effects of different kinds of artificial night lights (e.g., incandescent and halogen bulbs) on insects. More studies are needed in order to elucidate the extent to which artificial light disrupts trophic interactions and biological control.
Most natural enemy species will show strong diurnal peaks of behavioural activity, foraging being mainly confined to the photophase, as in many parasitoids and some carabid beetles (Luff, 1978; Ekbom, 1982; Ruberson et al., 1988; Fig. 2.34). The photophase in fecundity experiments should therefore be the same as that experienced in the field; a continuous light regime may result in a higher fecundity than would be achieved in the field (Lum & Flaherty, 1973). Because of its effects on food consumption, photoperiod length may also influence larval growth and development rates in larval predators (which in turn will influence adult fecundity, Sect. 2.7.3) and the rate of ovigenesis.

Source Ekbom (1982). Reproduced by permission of Elsevier Science
Diurnal flight activity patterns in Encarsia formosa (Aphelinidae) in the greenhouse (data for May–June). Percentage of the mean daily catch (by air suction trap) of wasps for each hour (histograms) and mean temperature (curve).
Weseloh (1986) showed that the egg load of females of the egg parasitoid Ooencyrtus kuvanae (Encyrtidae) kept under long-day conditions increases more rapidly than that of females kept under short-day conditions, and that this is reflected in differences in progeny production. Anagyrus kamali, an encyrtid parasitoid of the hibiscus mealybug, is unusual in that its lifetime fecundity is highest under conditions of continuous darkness: this life-history characteristic would help to keep mass-rearing costs to a minimum (Sagarra et al., 2000b). Hentz et al. (1998) found no significant effect of photoperiod on fecundity in Chelonus sp. near curvimaculatus.
Photoperiod and light quality and intensity should also be investigated for their effects on reproductive diapause induction (Sect. 2.12.3), particularly where parasitoids and predators are being employed in artifically lit environments (e.g., Stack & Drummond, 1997).
2.7.4.3 Humidity
Decreasing humidity may increase potential and realised fecundity in predators, through an increase in prey consumption by juveniles and females (e.g., Heidari, 1989), but it may also decrease realised fecundity in predators and parasitoids by reducing searching efficiency and longevity (see below). In fecundity experiments care must therefore be taken to control humidity, so that it is around the field average.
2.7.4.4 Field Weather Conditions
The influence of field weather conditions upon the realised fecundity of insect natural enemies has rarely been investigated, undoubtedly because of the often immense practical difficulties involved. Weather can affect fecundity in a variety of ways, through its effects on foraging activity (Fink & Völkl, 1995; Weisser et al., 1997), host/prey and non-host/prey food availability and quality, larval growth rate and survival, ovigenesis, and female survival. Weisser et al. (1997) estimated the lifetime reproductive success (lifetime realised fecundity) of the parasitoid Aphidius rosae in relation to wind and rain conditions by means of simulation modelling. They first developed a simulation model to predict patterns of parasitism of aphid colonies in the field as a function of weather conditions, then they parameterised the model using data from both laboratory and field experiments on parasitoids. Periods of relatively ‘good’ and relatively ‘bad’ weather were simulated using real weather data. They showed that only a small proportion of females was able to realise oviposition levels close to the maximum lifetime realised fecundity, as measured in the laboratory. Barometric pressure is also likely to affect fecundity in insect natural enemies; Roitberg et al. (1993).
2.8 Adult Longevity
2.8.1 Introduction
The life-span of an individual insect can be divided into two phases: (1) the development period from hatching of the egg until adult eclosion (Sect. 2.9), and (2) the period of adult life, usually referred to as longevity (Blackburn, 1991a, b). An obligatory or facultative period of dormancy may intervene during the lifetime of an individual to extend either development or adult longevity for a variable period of time (Sect. 2.12).
Adult longevity may be studied from a variety of standpoints. For evolutionary biologists, it is a component of individual fitness (Waage & Ng, 1984; Hardy et al., 1992; Roitberg et al., 2001; Rivero & West, 2002; Tylianakis et al., 2004; van Baalen & Hemerik, 2008; Jervis et al., 2008; Snart et al., 2018), the assumption being that: (1) the longer a male can live, the more females he can inseminate, and therefore the more eggs he can fertilise; and (2) the longer a female can live, the more eggs she will lay. In both cases, the proviso ‘all else being equal’ applies. Adult longevity is also studied from the point of view of population dynamics, because of its relationship to female fecundity, the prey death rate and the predator rate of increase. Most studies on natural enemies measure adult longevity in the laboratory: there is a dearth of studies that measure it under natural conditions. Individual marking techniques that can be used to measure adult survival in the field are discussed in Chap. 6 (Sects. 6.2.10, and 6.2.11).
Longevity, like fecundity, is a highly variable species characteristic, influenced by a range of physical and biotic factors. The commonest experiments into the effects of these factors involve taking a cohort of standardised females (Sect. 2.7.2) and exposing each of them to one of a range of constant environmental conditions from eclosion until death. Mean length of adult life can be plotted against variables such as body size, temperature, humidity, host or prey density, sugar concentration (in diet), and pesticide or other toxin (e.g., Bt, allelochemical) concentration. However, this method of expressing longevity data has major drawbacks (see below).
Evidence for a reproduction‒survival trade-off has been found in some predators and parasitoids in relation to prey availability (Ernsting & Isaaks, 1991; Kaitala, 1991; Kopelman & Chabora, 1992; Valicente & O’Neill, 1995; Ellers et al., 2000; Jervis et al., 2008; Scharf et al., 2013). A cross-species trade-off was also observed in the gerrids that Kaitala (1991) studied. See Dixon (2000) for a discussion of the reproduction-survival trade-off within and among species of Coccinellidae. A cross-species trade-off between ovigeny index and life-span (Sect. 2.3.4) was recorded by Jervis et al. (2001, 2003).
2.8.2 Survival Analysis
Frequently, in the literature, longevity data are presented as the mean length of adult life plus or minus its 95% confidence limit or standard deviation or standard error. However, when statistical comparisons between treatments are made, authors overlook the fact that individual longevity data are rarely normally distributed. For statistical comparisons between treatments to be biologically meaningful, the data are best presented in other ways such as cohort survivorship curves, which show the fraction of each cohort surviving at a particular moment in time (Fig. 2.35). Such curves fall into 3 categories: Type I, in which the risk of death increases with age; Type II, in which there is a constant risk of death, i.e., the risk is independent of age; and Type III, in which the risk of death decreases with age.

The three main types of survivorship curve: Type I—mortality concentrated in the oldest age classes; Type II—constant risk of death; Type III—mortality concentrated in the youngest age classes. Note the logarithmic scale for the vertical axis
Survival data have been compared by plotting survivorship curves and calculating the time to 50% mortality (LT50) for each treatment and assessing the statistical significance of differences in this quantity. A major difficulty with this approach is that, at a particular point on the time axis, one or more of the curves might comprise few observations. Also, the 50% mortality level is subjective. As pointed out by Crawley (1993), generalised linear modelling techniques (available in many statistical software packages) offer one of the best means of analysing survival data. The data can be analysed statistically in terms of survivorship (proportion of individuals from the cohort still alive at a particular point in time), the age at death, and the instantaneous risk of death (also termed the ‘age-specific instantaneous death rate’ by biologists or ‘hazard rate’ by statisticians). Generalised linear modelling can be used to determine which of a variety of available models (exponential, log-normal, Weibull) best describe the observed data. Having decided upon the most appropriate model, the effects of different experimental treatments can then be compared. For details of the procedure, see Crawley (1993, 2002).
The Weibull model has been used to analyse survival data for parasitoids (e.g., Tingle & Copland, 1989; Hardy et al., 1992; Núñez-Campero et al., 2012; Amante et al., 2017; Snart et al., 2018; Jucker et al., 2020). The Weibull frequency distribution was originally considered as a model of human survivorship (Gehan & Siddiqui, 1973) and has commonly been used in engineering as a ‘time to failure’ model. The Weibull distribution is extremely flexible, possessing either positive or negative skewness, so allowing all three types of survival curve (I, II, III) to be analysed (Cox & Oakes, 1984). The advantage of using the Weibull model to describe survival curves is that it summarises the information contained in a curve as both a rate parameter and a shape parameter. The fraction (F) of the cohort surviving at time t is given by:
Statistical packages estimate the most appropriate value of the shape parameter c, and allow the rate (or scale) parameter b to be a linear combination of explanatory variables. Hardy et al. (1992) examined survivorship in females of the bethylid wasp Goniozus nephantidis, and found that for each of two treatments a curve based on a Weibull distribution showed some systematic deviation from the observed curve. Having noted a relationship between longevity and body size in females (see below), they allowed the logarithm of the distribution’s rate parameter to be a linear function of female size. Incorporation of female size significantly improved the fit, and therefore the explanatory power, of the model in the two treatments.
If you are dealing with a particularly long-lived species, you do not have to wait until all the individuals have died in order to terminate an experiment. The experiment can be terminated earlier, and certain statistical analyses can be used to take account of individuals that die at an unknown time (after the end of experimental observations), i.e., insects that are ‘censored’, statistically speaking (Crawley, 1993, 2002). Such analyses can also be used to take account of individuals that are accidentally lost or killed during the experiment. However, censoring effectively loses information on longevity that it would be better to have and thus offers a means of dealing with a situation that is ideally avoided in the first place. If there are, unavoidably, individuals in the data set with unknown times of death, it is better to use what information is available on their longevity (the time they were known to have lived) by including them as censors than to exclude them from the analysis altogether (the latter approach introduces a bias towards excluding those individuals that live longest).
Siekmann et al. (2001) applied Cox’s proportional hazards model (which is available in several statistical software packages) to longevity data obtained for Cotesia rubecula given a single meal, the concentration and timing of which varied among treatments. Their analysis showed that the risk of sugar-fed females starving to death was reduced by up to 73% in comparison with unfed wasps, depending on sugar concentration and timing, and that wasps need to locate food at least once a day if they are to avoid starving to death.
2.8.3 Effect of Biotic Factors on Adult Longevity
2.8.3.1 Host and Prey Density
Non-predaceous Females
In some studies, host/prey density appears to have had little or no effect upon adult survival in such insects; at least when average longevity is used as the measure of survival (Mackauer, 1983; Liu, 1985b). Visual inspection of survival curves suggests the same, although a survival analysis of the type discussed above needs to be carried out on such data. Nevertheless, there is evidence for an effect of host availability on survival in some parasitoids. In some species, host-deprived females are able to live longer than undeprived ones kept under otherwise identical conditions (e.g., Tran & Takasu, 2000); presumably they are able to do so because they obtain energy for maintenance from egg resorption, and/or they do not incur the life-span costs of oviposition (see above). A host density-related trade-off between reproduction and adult life-span has been recorded in a few parasitoids. Ellers et al. (2000) exposed Asobara tabida to different host density regimes and found that: (1) the total number of eggs produced (those laid in hosts plus those remaining in the females upon death) correlated with host density, and (2) there was a negative linear correlation between physiological life-span and the number of eggs produced—each egg that was produced decreased life-span by an equal amount. The significance of the shape of the trade-off function in A. tabida and in insects generally is discussed by Ellers et al. (2000). Another parasitoid species in which there is a host availability-related trade-off between reproduction and life-span is Leptopilina boulardi (Kopelman & Chabora, 1992). Apparently in this species life-span declines in relation to increased oviposition rate, given that the species is pro-ovigenic (this rules out an effect of ovigenesis rate) and females in the different host density treatments produced the same number of progeny (see discussion in Jervis et al., 2001).
Predaceous Females
Most information on predaceous females relates to cases where the longevity of females deprived of hosts or prey (deprived for either the whole or part of an experimental period) is compared with that of undeprived females. As one might expect, longevity is found to be shortest in the deprived females: they cannot satisfy their metabolic requirements for maintenance. For instance, in the host-feeding parasitoid Dicondylus indianus, female longevity increased with host density (Sahragard et al., 1991). Bellows (1985b) also found that longevity in the host-feeding bruchid parasitoid was greater in wasps provided with mature hosts than wasps with young hosts or no hosts. By contrast, juvenile food limitation extended longevity in the bridge spider, Larinioides sclopetarius.
There are few published studies in which the longevity of predaceous females has been related to either availability of prey/hosts or consumption rate. Longevity is positively related to prey consumption rate in ovipositing Coccinella undecimpunctata over a wide range of prey densities (Ibrahim, 1955). In nonovipositing Thanasimus dubius (Cleridae), longevity becomes a direct function of prey density only at low levels of prey availability (Turnbow et al., 1978); the probable reason for the lack of a relationship at higher levels of prey/host availability in this case is that at these levels the predators’ maintenance requirements are fully satisfied. By varying prey availability, Ernsting and Isaaks (1991), Kaitala (1991) and Nakashima and Hirose (1999) obtained evidence for a reproduction‒survival trade-off in the predators they studied.
2.8.3.2 Prey and Host Quality
In predatory Coccinellidae and Anthocoridae adult longevity may be significantly affected by the prey species fed upon by the adult (Hodek, 1973; Chyzik et al., 1995; Mendes et al., 2002). This also applies to destructively host-feeding parasitoids (Wilbert & Lauenstein, 1974). The host stage fed upon influences longevity in the host-feeding bethylid Cephalonomia stephanoderis (Lauzière et al., 2000). With both host/prey species and host/prey stage effects, it is important to establish whether they are attributable to differences in the quantity of prey/host materials ingested or differences in host/prey quality sensu stricto. In parasitoids, host species affects longevity via its effect on body size (see above).
2.8.3.3 Host-feeding by Parasitoids
Consumption of host haemolymph improves longevity in some host-feeding wasp species (e.g., Eupelmus vuilletti: Giron et al., 2002; Neochrysocharis formosa: Liu et al., 2015) but not in others (e.g., Diadromus subtilicornis: Tran & Takasu, 2000; Gelis agilis: Harvey, 2008), while in the host-feeding parasitoid wasp Aphytis melinus, consumption of host blood positively influences longevity only if sugar-rich food is also taken (Heimpel et al., 1997a) (see Jervis & Kidd, 1986, and Heimpel & Collier, 1996, for reviews). Kapranas and Luck (2008) found that host-feeding had differing effects in two congeneric parasitoids of scale insects. In Metaphycus flavus, resources obtained during host-feeding were used primarily for egg production, whereas resources obtained by M. luteolus during host-feeding were used also for maintenance. By directly injecting females with the sugars that are abundant in host blood (trehalose, sucrose), Giron et al. (2002) showed that these sugars are solely responsible for the greater longevity of host-fed females.
2.8.3.4 Non-host and Non-prey Foods
Many studies have shown that, in the absence of hosts or prey, many parasitoids and predators given carbohydrate-rich foods, e.g., diluted honey solutions, live significantly longer than insects that are either starved or given only water (see reviews by Hagen, 1986; Jervis & Kidd, 1986; van Lenteren et al., 1987; Heimpel & Jervis, 2004; Jervis et al., 2008; see also Chap. 8).
Several studies have also revealed that longevity varies with the quality of food consumed. A simple experiment involves providing predators or parasitoids with one of a range of different diets, e.g., different sugars or combinations of sugars in solution, or even different nectars or honeydews, and comparing the effects of these on survival. However, for investigations of the effects of non-host food consumption on longevity (and fecundity) to have relevance to the field situation (particularly in biological control), they should involve first identifying the natural diet of parasitoids and predators, and then providing insects with the same or very similar foods (Chap. 8).
For details of protocols for determining the effects of biochemical components of non-host foods on longevity, see Finch and Coaker (1969) and Wäckers (2001). The effects of sugar-feeding on carbohydrate and lipid levels in parasitoids have been investigated by Olson et al. (2000), Fadamiro and Heimpel (2001) and Casas et al. (2003) (see Sect. 2.13 for biochemical techniques).
2.8.3.5 Body Size
A positive correlation between body size and longevity, at least across the lower range of host body sizes, has been shown for the adults (in some cases males as well as females) of several parasitoid species (e.g., Sandlan, 1979; Mani & Nagarkatti, 1983; Waage & Ng, 1984; Bellows, 1985b; Hooker et al., 1987; van den Assem et al., 1989; Hohmann et al., 1989; Heinz & Parrella, 1990; Hardy et al., 1992; Harvey et al., 1994; West et al., 1996; Ellers et al., 1998; Fidgen et al., 2000; Rivero & West, 2002; reviewed by Visser, 1994). Exceptions include Goniozus nephantidis (in which larger females live longer than smaller ones if hosts are provided, but smaller females live slightly longer than larger ones if hosts are not available; Hardy et al., 1992), and both Asobara tabida and Nasonia vitripennis (in which the body size effect does not occur in fed females; Ellers et al., 1998; Rivero & West, 2002). The size effect upon the longevity of unfed female A. tabida and N. vitripennis is attributable to the smaller fat reserves of small females: such females can obtain additional energy for maintenance by feeding, but note that females cannot either supplement or replenish their fat body reserves (Ellers et al., 1998; Rivero & West, 2002; see also Sect. 2.14). Interestingly, in the two Metaphycus species studied by Bernal et al. (1999) the body size effect occurs in fed females and not in unfed ones; the amounts of lipid reserves were not measured in this case.
Because a size‒longevity relationship may not appear to exist for some species (e.g., Takagi, 1985, on Pteromalus puparum), it is important, in experiments, to provide parasitoids with a range of host sizes equivalent to that occurring in the field. Few studies have measured longevity in relation to body size under actual field conditions (West et al., 1996).
Blackburn (1991a) showed through a comparative analysis (Sect. 1.2.3) of 474 hymenopteran parasitoid species that, across the species within a taxon, there is no correlation between body size and life-span (see Blackburn, 1991a, and Jervis et al., 2003, for discussion). Sokolovska et al. (2000) found positive correlations between longevity and male and female body size among Odonata, but their meta-analysis has been criticised by Thompson and Fincke (2002).
Burkhard et al. (2002), used the degree of wing wear and injury to estimate size-specific survivorship in field populations of the predatory fly Scathophaga stercoraria, and showed that in females longevity increased with body size in both flight seasons but that in males it increased slightly in the spring and decreased in the autumn. Burkhard et al. (2002), however, urge caution in applying the method (see their paper for details).
2.8.3.6 Mating
As discussed in Chap. 4 (Sect. 4.5.3), frequent mating may shorten life-span in both females and males. Several laboratory studies have shown that in predatory coccinellids unmated females live longer than mated ones; the same also applies to males (Dixon, 2000; see also Taylor et al., 1998, on a predatory stonefly). However, there is no difference in longevity between mated and virgin females of the predatory bug Podisus maculiventris (De Clercq & Degheele, 1997).
In experiments aimed at testing for the effects of mating on longevity, one must establish that mating really has occurred (see ‘mating’ in Sect. 2.7.3). If a positive effect of mating upon female longevity is found, the question arises as to whether longevity is enhanced due to the nutrient contribution made by the male, in the form of sperm or spermatophore.
2.8.4 Effect of Physical Factors on Adult Longevity
2.8.4.1 Temperature
There will be an optimum range of temperatures outside of which survival is severely reduced (Jackson, 1986; Krishnamoorthy, 1989; Mohan et al., 2004). In general, and usually in males as well as females, longevity decreases with increasing temperature within the optimum range (Sahad, 1982, 1984; Nealis & Fraser, 1988; McDougall & Mills, 1997; Hentz et al., 1998; Tran & Takasu, 2000; Liu & Tsai, 2002; Seal et al., 2002; Emana, 2007; Dhillon & Sharma, 2009; e.g., Fig. 2.36), although for some species no more than a trend may be apparent (Barfield et al., 1977a; Cave & Gaylor, 1989; Miura, 1990).

Source Tingle and Copland (1989). Reproduced by permission of Lavoisier Abonnements
Survivorship of Anagyrus pseudococci (Encyrtidae) at four different constant temperature regimes.
Most experiments designed to demonstrate the effect of temperature on adult longevity involve exposing insects to constant temperatures, which ignores the fact that in nature temperatures will fluctuate during each day, the lowest temperatures occurring at night. Ideally, longevity ought to be studied at temperature extremes that are part of a cyclical regime, but such an approach has rarely been adopted. Ernsting and Isaaks (1988) measured the survival of the carabid Notiophilus biguttatus, given excess prey, at a constant 10 °C regime compared with a daily fluctuating (20 °C day/10 °C night) regime. The lower survival of beetles held under the fluctuating regime could simply be explained by the higher average daily temperature at that regime. Minkenberg (1989) incorporated a more realistic fluctuating temperature regime in his experimental design. He exposed the eulophid Diglyphus isaea to each of three constant temperatures (15°, 20°, 25 °C) and to a fluctuating regime that involved the temperature increasing linearly from 0100 to 0300 h, decreasing from 1500 to 1700 h, and being fixed at 22 °C from 0300 to 1500 h and at 18 °C from 1700 to 0100 h. Survival of wasps held under the fluctuating regime (average daily temperature 20.3 °C) was much lower than at the constant 20 °C regime.
Some parasitoids and predators overwinter as adults and may be exposed to near- and/or sub-zero temperatures. Cold tolerance of adult Bathyplectes curculionis (Ichneumonidae) was studied by Berberet et al. (2002), and that of Harmonia axyridis (Coccinellidae) by Watanabe (2002).
2.8.4.2 Humidity
It is clear from many experimental studies that natural enemy adults have particular humidity requirements for survival (Kfir, 1981; Hérard et al., 1988; Wysoki et al., 1988; Emana, 2007). Although it would appear to be quite easy to carry out an experiment designed to measure survival at different humidities, there is the problem of maintaining the insects for a sufficiently long period for statistical comparisons to be made. Insects deprived of food are likely to die quite quickly, but if they are provided with honey or sucrose solutions (see above), it may be difficult to separate the effects upon longevity of the water content of the air and that of the food. Similarly, it may be difficult to set up an experiment that incorporates some degree of biological realism in the form of a plant surface, since the latter will be actively transpiring.
Small-bodied insects, because of their high surface area to volume ratio, will be more prone to desiccation at low humidities than large-bodied insects; see Jervis et al. (2003) who discuss this, from a comparative perspective, in relation to parasitoid wasps.
2.8.4.3 Photoperiod
Little is known about the influence of photoperiod on longevity. Given that some predaceous insects are active only during certain periods of the day or night, one might expect longevity to be influenced by photoperiod. In the parasitoid Ooencyrtus kuvanae, photoperiod experienced upon adult eclosion influences both longevity and the rate of progeny production. Short-day conditions resulted in females producing fewer progeny but living longer. Switching photoperiods after twelve days failed to alter this once it had been established (Weseloh, 1986). In Anagyrus kamali, longevity, like lifetime fecundity, is highest under continuous darkness (Sagarra et al., 2000a). Hentz et al. (1998), however, found no significant effect of photoperiod on longevity in Chelonus sp. near curvimaculatus. Note that some entomophagous insects are nocturnal, e.g., certain Ichneumonidae (Gauld & Huddleston, 1976), Vespidae, Pompilidae and Rhopalosomatidae (Gauld & Bolton, 1988).
2.9 Growth and Development of Immatures
2.9.1 Introduction
Development refers to the morphological, anatomical and physiological changes shown by each individual insect from the time the egg is laid to the time the adult ecloses. Growth refers to the increase in biomass of the insect during the period between hatching from the egg and the end of the larval phase of the life-cycle (Fig. 2.37) or between instars. The larval phase in predators comprises long periods of feeding and brief periods of moulting. Typically, biomass increases steadily throughout each instar. At the time of the moult, biomass falls slightly due to the loss both of the exuvium and of some water (which is not immediately replaced, as the insect is not feeding) (Chapman, 1998, 2013). In some aquatic insects there is no decrease in biomass at the moult; instead there is an increase due to absorption of water through either the cuticle or the gut; in Notonecta glauca this increase is very large (Wigglesworth, 1972).

Source Glen (1973)
Development in the bug Blepharidopterus angulatus (Miridae) given excess prey, showing the length of time spent in each larval instar, the body weight at the start of each instar, and the cumulative wet weight of lime aphids consumed up to the start of each instar. Roman numerals denote instars. Points are shown ± SE.
In the field, as opposed to laboratory, measurements of growth and development in predators and parasitoids have been made on few species (e.g., Griffiths, 1980, on ant-lions; Banks & Thompson, 1987b, on damselflies).
For predators the protocols for measuring growth and development in relation to certain physical and biotic factors are relatively straightforward. For example, to study the influence of prey availability, take a series of cohorts of newly hatched larvae and present each insect with one of a range of chosen prey densities (prey of a fixed size), at a constant temperature, humidity, photoperiod, either for the duration of the insect’s life or for the duration of one or a few instars only. On each day of larval life, replace the prey. Larval development is measured simply in terms of the period of time between moults or other events (e.g., egg hatch and pupation). Larval growth can be measured as the dry or fresh weight gain, including exuvia weight, or the body size increase (e.g., measured in terms of head width) between instars, although the standard measure of growth rate is the mean relative growth rate (MRGR):
where Wi is the initial weight of the insect, Wf is the final weight of the insect, and d is the period of time over which growth is measured. Some workers (Paradise & Stamp, 1990, 1991) have expressed growth rate differently, as the fresh weight gained/instar duration × the average fresh weight of the predator during the instar.
For parasitoids, the protocols for measuring the influence of physical and biotic factors on growth and development may be rather more complex than for predators. Endoparasitoids are a particular problem, since the sizes and weights of larvae cannot easily be measured and the larvae often cannot easily be assessed as to their stage of development (Mackauer, 1986; Sequeira & Mackauer, 1992b; Harvey et al., 1994). However, for ectoparasitoids and predatory arthropods, it is generally much easier to measure the growth and development of immature stages to adult (Harvey et al., 1998; Dmitriew and Rowe, 2003; Jespersen & Toft, 2003; Singh & Mishra, 2014; Harvey, 2021; see below).
A necessary prerequisite for studying many aspects of larval development, particularly instar-related aspects of biology, in predators and parasitoids is the ability to distinguish between the different instars. In some cases, it is relatively easy to tell the instars apart, using features such as mouthpart structure, head capsule width, the degree of wing development, the number and position of prominent setae, spines and other cuticular structures, the structure of the tracheal system and associated spiracles, and body colour patterns. However, in other insects, obvious distinguishing features may be lacking. Morphometric techniques may therefore be required. Thompson (1975, 1978), for example, decided upon the instar of the damselflies larvae he studied (Ischnura elegans), by means of both a frequency distribution plot of head widths of randomly field-collected larvae and a regression of modal head width against probable instar number. Even better discrimination between instars was obtained by plotting head width against body length (Thompson, 1978).
2.9.2 Effects of Biotic Factors on Growth and Development
2.9.2.1 Food Consumption
Introduction
Predator larvae need to consume several prey individuals during development, and each successive instar will show a maximum rate of growth and development at different levels of prey availability. Generally, with increasing prey density, at least across the low and medium ranges, larval predators consume more prey, develop faster, gain more weight and so attain a higher final size (Dixon, 1959, 2000; Lawton et al., 1980; Scott & Barlow, 1984; Pickup & Thompson, 1990; Zheng et al., 1993a, b; Bommarco, 1998; Dmitriew & Rowe, 2007; Harvey, 2021). Where development rate increases non-linearly with prey consumption rate (see below), development rate stops increasing above a certain prey density while growth continues. Growth and development also vary in relation to prey quality.
Food consumption by insects is a subject in its own right, and the associated literature is very large (Waldbauer, 1968; Beddington et al., 1976; Kogan & Parra, 1981; Scriber & Slansky, 1981; Slansky & Scriber, 1982, 1985; Slansky & Rodriguez, 1987; Farrar et al., 1989; Karowe & Martin, 1989). The approach we are recommending here is that of Beddington et al. (1976), as it provides one of the most useful bases for predicting predator‒prey population dynamics (Chap. 7). The various problems inherent in measuring food consumption and utilisation by insects and other arthropods are discussed in Waldbauer (1968), Lawton (1970), Ferran et al. (1981) and Pollard (1988).
The basic protocol for studying the effects of prey availability and prey consumption on growth and development in predators has already been outlined. Other measurements can also be taken in order that various nutritional indices can be calculated; these measurements are of:
-
1.
The biomass of the prey materials ingested (biomass is best measured in terms of dry weight, since prey remains are likely to lose water before retrieval). The predator’s efficiency of conversion of ingested food into body substance (ECI) can then be calculated as follows:
$${\text{Conversion efficiency}}\,{ = }\frac{M}{C - D}\,\, \times \,\,100$$(2.6)
where M is the increase in biomass of the predator, C is the biomass of captured prey, and D is the biomass of the captured prey that is not consumed (C–D is therefore the biomass of prey actually ingested). According to Cohen (1984, 1989), predaceous insects with piercing, suctorial mouthparts (e.g., Heteroptera) ought to have higher ECI values than predators with chewing mouthparts, because they obtain a larger proportion of highly digestible materials from their prey (a process assisted by pre-oral digestion) (see also Cohen, 1995, and Cohen & Tang, 1997). The ECI is a measure of gross growth efficiency, since biomass losses in the form of faeces and excreta are not accounted for.
-
2.
C, D and the biomass which appears as faeces (F), and the products of nitrogenous excretion (U). The predator’s utilisation efficiency, i.e., the efficiency with which the prey biomass captured is converted into predator biomass, can then be calculated:
-
3.
C, D, F and U (as in 1. and 2.). The predator’s assimilation efficiency, i.e., the efficiency with which the prey biomass consumed is converted into predator biomass, can then be calculated:
-
4.
C, D, and F (as in 1. and 2.). The predator’s digestive efficiency (also termed ‘approximate digestibility’), i.e., the efficiency with which the prey biomass ingested is digested and absorbed, can be calculated:
Other nutritional indices used in studies of food consumption by insects are discussed by Waldbauer (1968) and Slansky and Scriber (1982, 1985).
Growth Rate
At least some of the food a larva consumes needs to be allocated to maintenance metabolism. Because of this, growth will stop if consumption falls below a certain threshold (this threshold will become higher as the insect grows and its maintenance requirements increase). The energy allocated to growth can be assumed to be a linear function of food intake (Beddington et al., 1976):
where G is the growth rate (biomass accumulated per unit time, e.g., fresh weight gain, including exuvium weight, divided by the number of days spent in the instar) of each juvenile stage, I is the rate of ingestion of food (biomass of prey consumed per unit time, in comparable units to G, see Eq. 2.6), and δ and B (the threshold ingestion rate, analogous with parameter c in Eq. 2.1) are constants. Mills (1981) gives an alternative model.
Figure 2.38 shows the relationship between growth rate and consumption rate in larval Notonecta; the relationship conforms to that predicted by Eq. 2.10. As can be seen from the intercept of the line with the x-axis, the predator needs to consume a minimum amount of food for any growth to occur.

Should the increase in respiratory rate be non-linear, then growth rate will be non-linear and conform to the following model (Beddington et al., 1976):
Development Rate
If Wi is the initial weight (biomass) of an instar (teneral weight), Wf is the final weight achieved, and W is the total weight gain, then W = Wf – Wi. The ratio W/G will define the duration, d, of the instar, and development rate, 1/d, is given by the following linear model (Beddington et al., 1976):
If it is assumed, for simplicity’s sake, that W remains a constant, then (Beddington et al., 1976):
where α and B are constants. Equation 2.13 still predicts a simple, linear relationship between development rate and consumption rate.
As pointed out by Beddington et al. (1976), Eq. 2.12 ignores the fact that the larvae of some predators may, under conditions of food scarcity, moult to the next instar at significantly lower body weights than when food is abundant. Wi, Wf and W are therefore functions of consumption rate and thus of prey availability: weight gain in each instar cannot be assumed to be constant. Figure 2.39 shows how, in the damselfly Ischnura elegans, larvae fed at low prey densities moulted to smaller individuals, i.e., they moulted earlier than better fed larvae, having gained less weight. Mills (1981) demonstrated, through a regression analysis of the relationship between W and consumption rate and teneral weight in Adalia bipunctata, a significant dependence in both cases; consumption rate explained 47–75% of the variance.

Source Lawton et al. (1980). Reproduced by permission of Blackwell Publishing
The effect of prey density on the percentage increase in head width at the moult in Ischnura elegans (vertical bars = ± SE).
Thus, the relationship in some predators is more complex than that described by Eq. 2.13. Lawton et al. (1980) provide the following non-linear model:
where Na is the number of hosts fed upon. An alternative non-linear model is provided by Mills (1981). Both models describe a decelerating curve for the relationship between development rate and consumption rate. Curves of this type were obtained in the laboratory for both Ischnura elegans (Fig. 2.40) and Adalia bipunctata (Fig. 2.41) Lawton et al. (1980) gave, as well as a dependence of W on consumption rate, three other reasons to account for non-linearity in the case of Ischnura:

Source Lawton et al. (1980). Reproduced by permission of Blackwell Publishing
Development rates in Ischnura elegans (Odonata: Zygoptera) larvae as a function of the number of prey killed per day. Only larvae that successfully completed their development in each stage were included in the calculations.

Source Mills (1981). Reproduced by permission of Blackwell Publishing
The relationship between mean development rate and consumption rate for the four larval instars of Adalia bipunctata (Coccinellidae). Indicated is the fit of linear and non-linear models of development (see text).
-
1.
Variation in k (Eq. 2.2) with prey availability. In Ischnura k declined with prey availability (Fig. 2.42), the predators wasting proportionately more of each of the prey they kill at higher densities (adaptive behaviour in many predators, Sect. 1.14; Cook & Cockrell, 1978; Giller, 1980; Sih, 1980; Kruse, 1983; Bailey, 1986; Dudgeon, 1990, although some predators may go to the extreme of not consuming any part of the prey, Yasuda, 1995). However, as Lawton et al. (1980) point out, a decline in utilisation efficiency in Ischnura cannot be the sole reason for the non-linear dependence of development rate upon prey consumption rate. If it is, daily growth rates plotted against prey biomass assimilated (C–[D + F]) ought to be linear (Eq. 2.10): they are not (Fig. 2.43).
Fig. 2.42 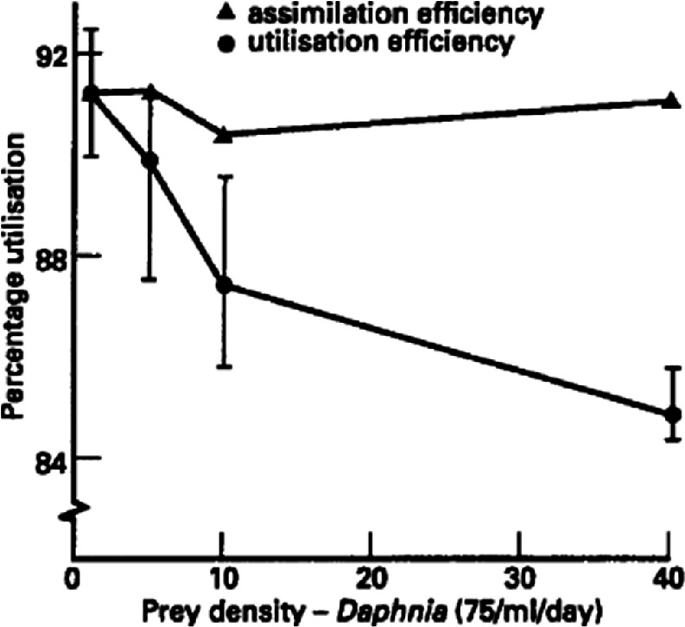
Source Lawton et al. (1980). Reproduced by permission of Blackwell Publishing
The relationships between assimilation and utilisation efficiencies and prey density in the eleventh instar of Ischnura elegans (Odonata: Zygoptera). Utilisation efficiency clearly declines with increased prey density.
Fig. 2.43 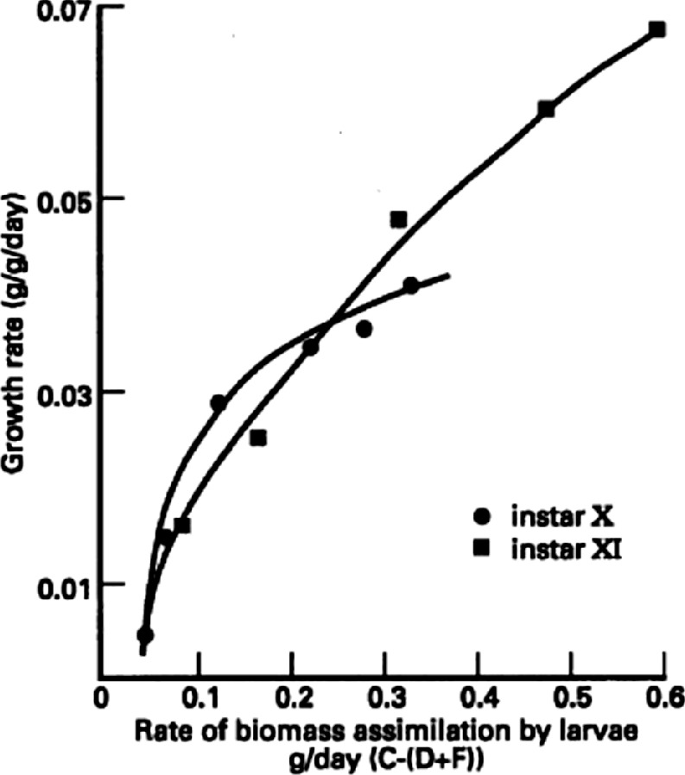
Source Lawton et al. (1980). Reproduced by permission of Blackwell Publishing
The effect of daily rate of biomass assimilation on growth rate for instars X and XI of Ischnura elegans (Odonata: Zygoptera). Growth rate is measured as g/g/d increase in weight and is calculated by dividing weight gained during the instar-by-instar duration. These figures were corrected for the initial weight of the larvae. Wet weights were used for initial and final weights. Only larvae that successfuly completed their development in each instar were used in the calculations.
-
2.
A decrease in assimilation efficiency with increasing consumption rate. Lawton (1970) had suggested that this can occur with over-feeding at high levels of prey availability, causing defaecation to take place before digestion is complete. Lawton et al. (1980) investigated whether assimilation efficiency varied with prey availability. Since it does not do so in Ischnura (Fig. 2.42), this hypothesised effect could not account for the non-linear dependence of development rate on consumption rate.
-
3.
A non-linear increase in respiratory rates with increasing consumption rate (Eq. 2.11). Lawton et al. (1980) concluded that this effect, together with the variation in k and W, accounted for the observed relationship in Fig. 2.40. Circumstantial evidence to support the conclusion regarding change in respiratory rates comes from Lawton et al.’s (1980) behavioural observations: larvae held at high prey densities frequently engage in more waving of the gills than other larvae, suggesting that they are under oxygen stress. Respirometric methods would need to be employed to establish whether respiratory rates do indeed alter.


To obtain the relationship between development rate and prey availability, both Eq. (2.13) and Eq. (2.2) can be incorporated into the simple functional response model (Holling’s (1966) disc equation; Sect. 1.14) (Beddington et al., 1976):
Equation 2.15 describes a decelerating curve, like a Type 2 functional response (Sect. 1.14). As pointed out by Beddington et al. (1976), the curve is unlikely to go through the origin. Unless the weight at which a species is able to moult to the next instar is very flexible, the effect of B will be to displace the curve along the prey axis. Put another way, there will be a threshold prey density (and therefore consumption rate) below which growth and development cannot take place. Examples of this are shown in Fig. 2.44. In those species that consume proportionately less of each prey item when encounter rates, i.e., levels of prey availability, are high (k declines) the curve will be somewhat different in shape: flatter-topped, with an earlier ‘turnover’ point (Beddington et al., 1976; also see Yasuda, 1995).

2.9.2.2 Variation in Growth and Development Between and Within Instars
Figure 2.37 shows both the cumulative increase in prey biomass consumed and the increase in weight of nymphs of the bug Blepharidopterus angulatus as they develop. Later instars account for most of the total consumption and growth that occurs. In the green lacewing Chrysoperla carnea the third (final) instar accounts for 80.5–82.8% of the total consumption and 80.45–85.6% of the total growth that occurs (data from Zheng et al., 1993a).
Figure 2.44 shows that the development rate versus prey availability curves differ between instars. As pointed out by Beddington et al. (1976), this is to be expected from the between-instar differences that exist with respect to: (1) attack rate (a’) and handling time (Th), both of which are parameters in the functional response model); (2) metabolic rate, which will increase with instar by a certain power of the body weight—this affects B in Eq. (2.14); and (3) the constants α and k (Beddington et al., 1976).
Examination of the growth rate versus consumption rate plots for Adalia bipunctata (Fig. 2.45) reveals that the slope (which represents conversion efficiency) decreases as the insects pass through the instars. This change in the slope is partly attributable to increased metabolic costs in later instars, as can be seen from the intercepts with the y-axis, representing basal respiratory rates. However, the main cause is likely to be a decline in digestive efficiency, since compared with earlier instars, later instars of Adalia consume a greater proportion of each prey item, i.e., k increases with instar (Mills, 1981). To understand the relationship between the proportion of each prey consumed and digestive efficiency, consider the surface area/volume ratio difference between food boluses of different sizes. A larger bolus will have proportionately less of its surface area exposed to digestive fluids than a smaller bolus.

Source Mills (1981). Reproduced by permission of Blackwell Publishing
The linear dependence of average (± SE, n = 6–10) growth rates on food consumption rate for the four larval instars of the coccinellid beetle Adalia bipunctata. Note that the slope of the relationship, representing the gross food conversion efficiency, decreases as the insect develops. This is partly due to increased metabolic costs, as can be observed from the y-axis intercepts representing basal respiratory rates, but it is mainly due to a decline in digestive efficiency with instar.
Conversion efficiency can also vary with consumption rate within an instar. Third-instar larvae of Chrysoperla carnea provided with low prey densities have, as expected, a reduced consumption rate compared with third-instar larvae given high prey densities, but they have a higher conversion efficiency (Zheng et al., 1993a). A similar difference in conversion efficiency is shown by the early instars of the bug Blepharidopterus angulatus (Glen, 1973). Two possible reasons for this effect in the case of C. carnea were put forward by Zheng et al. (1993a): (1) digestive efficiency is increased, due to the smaller quantities of prey being ingested by larvae given low prey densities; (2) third-instar larvae, like some spiders, reduce their metabolism in response to prey scarcity.
2.9.2.3 Feeding History
Can predators recover from the deleterious effects upon growth and development brought about in previous instars by prey scarcity? To answer this question, a cohort of larvae can be exposed to high levels of prey availability throughout two instars, e.g., the third and the fourth in a coccinellid, and another cohort can be exposed to a prey availability regime that alters from low to high between these two instars. The fourth-instar insects from the two regimes can then be compared with respect to weight gain and instar duration. In this experiment, consumption rate and the various nutritional efficiencies should be measured to determine whether the compensatory effects shown by the test cohort are a result of changes in one or more of these factors within the later instar.
A similar experiment to the above was carried out by Paradise and Stamp (1991) on the mantid Tenodera sinensis. These authors showed that: (1) first- and second-instar mantids given a small quantity of prey attained a smaller size and spent more time in those instars than mantids provided with as much prey as they could eat, but that (2) in two out of three cohorts, mantids reared during the first instar on a poor diet recovered during the second instar when they were switched to a higher diet, gaining as much weight as, and spending less time in that instar than, those given a high diet throughout. The larvae of the later instar compensated for poor feeding in the earlier instar by having a higher consumption rate.
Zheng et al. (1993a) conducted a similar experiment with the green lacewing, Chrysoperla carnea, but over the entire larval development period. Larvae were either provided with a large quantity of prey over all three instars (HHH regime), or they were given a low quantity over the first two instars and a large quantity during the third (LLH regime). No significant difference in the duration of the third instar was found between larvae in the two regimes, but the overall duration of development from eclosion to pupation was significantly longer in the LLH larvae, i.e., recovery in development rate was partial. The dry weight gain of third-instar larvae was not significantly different in the two treatments, and the same applied to the overall weight gain over the whole of larval development, i.e., recovery in growth was complete. Third-instar larvae in the LLH regime consumed as many prey as those in the HHH regime, and the same applied to larvae over the whole of their development.
Limited recovery from suboptimal feeding conditions can, at least in the laboratory, be achieved in some Odonata (Lestes sponsa) by the larva passing through an additional instar. However, instar number is constrained and an increase in any linear dimension is limited to around 25–30% (D.J. Thompson, personal communication).
Can predators with higher growth rates in one instar maintain the advantage through subsequent instars? To answer this question, the aforementioned experimental design can be reversed, so that in the test cohort the prey availability regime alters from high to low. Experiments carried out by Fox and Murdoch (1978) on the backswimmer Notonecta hoffmani show that larvae can maintain a growth advantage during larval development.
2.9.2.4 Non-prey Foods
As with the fecundity versus prey density relationship, two effects of providing non-prey foods together with prey might be to lower the prey ingestion rate threshold, thus shifting the development rate versus prey availability curve nearer to the origin, and to alter the shape of the curve. Predator larvae may require a lower minimum number of prey items in order to develop at all, and they may develop more rapidly at and above this minimum.
That development rate is increased by provision of non-prey foods is demonstrated by experiments conducted on larvae of the lacewing Chrysoperla carnea (McEwen et al., 1993). At the three test prey densities offered to the predators during development, larvae given an artificial honeydew with prey required significantly fewer prey, developed significantly more rapidly, and attained a significantly higher adult weight than larvae given water with prey. Some predators can complete larval development when prey are absent, if certain non-prey foods are available, e.g., the bug Orius insidiosus (Anthocoridae) (Kiman & Yeargan, 1985), and the coccinellid Coleomegilla maculata (Smith, 1961, 1965). Predators such as the bug Blepharidopterus angulatus cannot complete development on a diet of honeydew alone, but nymphs that are switched from honeydew to a diet of aphids after the third instar can complete development (Glen, 1973).
2.9.2.5 Prey Species
Larval growth and development might be expected to vary in relation to prey species. Examples of studies demonstrating this effect in coccinellids include those of Blackman (1967) and Őzder and Sağlam (2003) for Adalia bipunctata and Coccinella septempunctata, Michels and Behle (1991) for Hippodamia sinuata (in which the prey species effect on development rate disappeared at temperatures exceeding 20 °C) and Wiebe and Obrycki (2002) for Coleomegilla maculata (and the lacewing Chrysoperla carnea). Sadeghi and Gilbert (1999), Mendes et al. (2002) and Petersen and Hunter (2002) studied larval performance in the hover-fly Episyrphus balteatus, in the anthocorid bug Orius insidiosus and in lacewings respectively, in relation to prey species.
Albuquerque et al. (1997) investigated and compared growth and development (and also reproduction) in two lacewings, one a specialist, the other a generalist, examining what alterations in these variables occurred when the predator species were given each other’s prey species (see their paper for details).
Two main factors influence how prey species can affect the growth and development of immature stages of predators. The first is based on the size of the prey species relative to the nutritional requirements of the predator. Smaller prey clearly contain fewer resources than larger prey. Furthermore, prey availability is important: regardless of prey size, optimal growth may only occur if there are sufficient prey encountered during immature growth. A second factor is prey quality, and this in turn may vary among different prey species. For example, Strohmeyer et al. (1998) found that the growth of two generalist predators, a stink bug (Podisus maculiventris) and jumping spider (Phidippus audax) varied among generalist, novel and specialist herbivore prey species reared on ribwort plantain (Plantago lanceolata) as well as on powder diets containing chemical extracts from new or mature leaves. The authors suggest that plant allelochemicals (iridoid glycosides) that were sequestered by the specialist herbivore but not the novel or generalist herbivores, may have impeded growth of the two predators, but that more factors were invariably responsible. Importantly, the effect of prey species on the growth of predators may be influenced by physiological interactions with plants across three trophic levels (Ode, 2006).
2.9.2.6 Interference and Exploitation Competition and Other Interference Effects
Ecologists distinguish between competition through interference and competition through exploitation. In interference competition individuals respond to one another directly rather than to the level to which they have depleted the resource. In exploitation competition individuals respond, not directly to each other’s presence, but to the level of resource depletion that each produces. With exploitation competition the intensity of competition is closely linked to the level of the resource that the competitors require, but with interference it is often only loosely linked (Begon et al., 1996; Amarasekare, 2002).
Larval predators show interference in the form of behavioural interactions. For example, larval dragonflies may interfere with one another’s feeding through distraction (e.g., ‘staring encounters’ between dragonflies) and/or overt aggression (Baker, 1981; McPeek & Crowley, 1987; Crowley & Martin, 1989; Fig. 2.46). Such interactions are likely to result in reduced feeding or increased metabolic costs and therefore ultimately will cause reduced growth, development and survival. Despite a superabundance of prey, interference competition between the native ladybird, Coccinella undecimpunctata, and the invasive ladybird, Harmonia axyridis, in the Azores led to greatly reduced prey consumption in the native species, which had knock-on effects on reproduction and maintenance of body mass (Soares & Serpa, 2007). Interestingly, interference competition was absent in the native ladybird species.

Source Williams and Feltmate (1992). Reproduced by permission of CAB Publishing
Aggressive interactions between damselfly larvae: a labial striking; b slashing with the gills. Larger larvae usually displace smaller ones, which may retreat by swimming off the perch.
Van Buskirk (1987) conducted an experiment to test whether density-dependent, interference-mediated reductions in growth, development and survival occurred in larvae of the dragonfly Pachydiplax longipennis. First-instar larvae were raised in pools at initial densities of 38, 152 and 608 larvae/m2, under two levels of prey availability (extra prey added daily to those already in pool; extra prey not added, i.e., food depletion likely to occur, pools in both cases containing the same initial density of prey), in a 3 × 2 factorial design. Van Buskirk (1987) found that with increasing predator density there was a decrease in growth and development rates, but he did not detect any statistically significant interactions between prey addition and predator density, suggesting that some form of interference, rather than prey exploitation, was important. Within the prey-added treatment, the per capita amount of prey available was greatest at low predator densities (since identical amounts of prey were available at all predator densities). If larvae were competing by exploitation alone, prey availability would have had a greater positive effect at low predator densities than at high predator densities, but this did not show up in the statistical analyses. Instead, prey availability increased survival by a similar amount at all predator densities. The positive effect of prey availability on survival suggests that food stress in the prey-absent larvae led to their becoming cannibalistic, the assumption being that larval dragonflies can survive long periods of time without prey, and thus mortality could not be attributed to starvation (Lawton et al., 1980; Sect. 2.10). Direct evidence of cannibalism was not, however, obtained.
Baker (1989), using the ‘condition’ (an index of the relative mass per unit head width of larvae) of larval dragonflies, related larval growth to larval density in a series of field sites. He found that for most of the year there was little evidence of food limitation. His results are in contrast to those obtained in the study by van Buskirk (1987) and in studies by Pierce et al. (1985), Johnson et al. (1984) and Banks and Thompson (1987b), in which the data indicate aggressive interactions to be important in limiting food intake of larval Odonata in the field. Among the reasons for this discrepancy given by Baker (1989) are that in his study larval densities were not high enough for either exploitation competition or interference to occur. Baker (1989) also points to differences in methodology and interpretation between his study and those of other workers (see discussion in his paper).
Anholt (1990) points to ‘asymmetries in the burden of refutation’ in several studies of competition in larval Odonata and other animals. Authors, when they have been unable to find evidence of prey depletion, have concluded by default that interference is the primary cause of density-dependent growth, development and survival. That is, they have made the assumption that if it is not competition through exploitation, then it must be competition through interference. Anholt’s (1990) study represents a significant departure from previous work on Odonata, in that he attempted to disentangle the effects of interference and exploitation by manipulating the rates of the two processes. Anholt manipulated the frequency of interactions between larval Enallagma boreale by altering perch availability at a fixed density of predators. Anholt (1990) argued that increasing the abundance of perches (i.e., increasing habitat complexity) will reduce the frequency of larva‒larva encounters and thereby reduce the intensity of interference competition without affecting the supply of planktonic prey, i.e., without depletion occurring. Anholt’s (1990) experimental design was a fixed-effects analysis of variance: (1) with three factors (food availability, larval density, perch availability) completely crossed; (2) with two factors (larval density and food availability) crossed; and (3) with two factors (perch availability and starting instar) crossed. In Anholt’s (1990) experiments, damselflies became more evenly distributed among available perches as the predator density per perch increased, demonstrating that there were behavioural responses to the manipulation of habitat complexity (a prediction made by Crowley et al., 1987). Food supply and predator density strongly affected survival, but the proportion of the variance in survival attributable to the habitat complexity manipulation, i.e., interference, was very small. Furthermore, whilst there were significant density-dependent alterations in growth or development, they were not attributable to food-related interference competition. Thus, despite the overt nature of the interactions between individuals, their costs appear to be minimal. Anholt (1990) suggested that the density-dependent reduction in larval growth and development observed in his experiments could have been due to both ‘resource depletion’, i.e., exploitation, and resource depression. Resource depression is a term used to describe local reductions in prey availability that result from the prey minimising the risk of predation by becoming less active and/or altering their use of habitat space.
Gribbin and Thompson (1990) conducted laboratory experiments in which individuals of two instars (ones which commonly occur together in the field) of Ischnura elegans were maintained in small containers (transparent plastic cups) with a superabundance of prey (to avoid prey limitation) either: (1) in isolation, (2) with three larvae of the same instar, or (3) three larvae of different instars. Either one perch or a set of four perches was provided to larvae in each treatment, and the experiment was treated as a two-way analysis of variance with perch availability as one factor and larval combination as the second factor potentially influencing development and growth. Small larvae showed increased development times and decreased growth (measured as percentage increase in head width) when kept with large larvae, but similar effects were not evident when the small larvae were kept with other small larvae. Development time and size increases of large larvae were not significantly affected by the presence of small larvae, i.e., competition was asymmetric. Regardless of the instar combination used, reductions in growth and development (which were taken to be due to interference, since prey—approximately 200 Daphnia magna—was superabundant in all treatments) were lessened when there were more perches available, although only in a few cases was the lessening significant. Gribbin and Thompson (1990) found that in containers with only one perch, large larvae often occupied the perch, whilst the single, small larva positioned itself on the side of the cup where feeding efficiency was likely to have been reduced.
Hopper et al. (1996) investigated the consequences of cannibalism for growth and survival (Sect. 2.10.2) of survivors in the dragonfly Epitheca cynosura. The eventual size of survivors from a high larval density, asynchronous treatment (asynchronous in hatching terms—asynchrony increases the likelihood of cannibalism, i.e., by older larvae) was greater than that of survivors from a low larval density, asynchronous treatment, while there was no difference in size between survivors from high and low larval density synchronous treatments.
For a study of interference and exploitation competition in a species of carabid beetle, see Griffith and Poulson (1993). Interference competition has been shown by Griffiths (1992) to occur between larvae of the ant-lion Macroleon quinquemaculatus. Note that facilitation, not interference, may occur between larval conspecifics in some predator species, e.g., nymphs of the pentatomid Perillus bioculatus (Cloutier, 1997).
Exploitation competition for lime aphid prey between the ladybird Harmonia axyridis and the predatory flowerbug Anthocoris nemoralis reduced the presence of lime aphid DNA detected in the bodies of A. nemoralis (Howe et al., 2016). Exploitation competition is apparently greater than intraspecific competition among three species of native, alien and invasive ladybirds in Chile (Zaviezo et al., 2019). Exploitation competition between two species of hover-fly was studied by Hågvar (1972, 1973).
The deleterious effects of competition on larval growth (and fecundity) can be expressed by plotting k-values (defined in Sect. 7.3.4) against log10 predator density. When describing such effects, the terms ‘scramble’ and ‘contest’ competition are less appropriate than the terms ‘exact compensation’, ‘over compensation’ and ‘under compensation’ (Begon et al., 1996; Sect. 7.3.4).
Larvae may also show a reduction in feeding rates in the presence of higher-level predators (Murdoch & Sih, 1978; Sih, 1982; Heads, 1986). Such interference may reduce the rate of consumption of prey, even when the insects do not need to move in order to feed (Heads, 1986), with the potential result that growth, development and even survival may be adversely affected (Sih, 1982; Heads, 1986; see, however, Brodin & Johansson, 2002). McPeek et al. (2001) showed that although the larvae of Ischnura and Enallagma ingest less food in the presence of a fish predator, interspecific differences in growth rate were primarily due to differences in the conversion efficiency of the species, i.e., the two genera differ in their physiological stress response to the presence of predators. Stoks (2001) concluded from his study of Lestes sponsa that predator-induced stress effects upon growth and development were due to lowered assimilation efficiency and/or a higher metabolic rate.
The early-instar larvae of the waterboatman Notonecta hoffmani can suffer significant mortality due to predation from adult conspecifics (Murdoch & Sih, 1978; Sih, 1982), and the adult avoidance behaviour of larvae constitutes a form of interference. Sih (1982), in laboratory and field experiments, compared the behaviour of larvae when the adults were experimentally removed with their behaviour in controls where adults were present. Early-instar larvae avoided adults by altering their use of habitat space (spending less of the total time available in the central region of the pond or tub, where prey and adults occur at the highest densities), and some of the early instars also became less active. As a result of this behaviour, larvae of the first two instars experienced severely reduced feeding rates.
2.9.2.7 Host Size
Idiobionts
The concept of an individual host as a fixed ‘parcel’ of resource for a developing idiobiont parasitoid was introduced in Chap. 1. For many idiobiont species host size determines the size (and/or mass) of the resultant parasitoid adult(s), as shown by data both on solitary and on gregarious species (Salt, 1940, 1941; Arthur & Wylie, 1959; Heaversedge, 1967; Charnov et al., 1981; Greenblatt et al., 1982; Waage & Ng, 1984; van Bergeijk et al., 1989; Corrigan & Lashomb, 1990; Otto & Mackauer, 1998; Harvey et al., 2006; Harvey, 2008; Wei et al., 2014; reviewed by Godfray, 1994 and Harvey, 2005). Idiobiont parasitoids, by virtue of attacking hosts that do not feed or grow, have evolved to exploit the trophic level below them (herbivores for primary parasitoids and primary parasitoids for hyperparasitoids) with remarkable efficiency. For example, Harvey et al. (2006) found newly emerged adults of the primary koinobiont parasitoid Cotesia glomerata were only marginally larger than newly emerged adult hyperparasitoids of the idiobiont species Lysibia nana that had developed in C. glomerata (pre)pupae of equivalent size. This efficiency allows food chains to be extended to five or even more trophic levels (Harvey et al., 2009a, b). Development rate, however, is not necessarily positively correlated with the size of host oviposited in. For example, in Trichogramma evanescens, development rate is highest in medium-sized eggs and lowest in small and large eggs (Salt, 1940), in Elachertus cacoeciae it is highest on fifth-instar hosts and lower in fourth and sixth instars (Fidgen et al., 2000), in Goniozus nephantidis it is lowest in seventh and eighth instars of the natural host, Opisina arenosella, weighing >70 mg and highest in the factitious host, Corcyra cephalonica (Shameer et al., 2002) while in Habrobracon hebetor development time is unaffected by host larval size (Taylor, 1988). The reasons for the lack of a clear relationship are complex, and the reader is referred to Mackauer and Sequeira (1993).
To investigate the influence of host size on growth and development in an idiobiont parasitoid species, present females (inseminated and, if necessary, uninseminated, to obtain data on both sexes) with hosts of different sizes and record the weight of the resultant adult progeny and the time taken from oviposition to adult eclosion (since adult eclosion is often influenced by light: dark cycles [Mackauer & Henkelman, 1975], observations should be carried out at the same time each day or under continous light conditions; video-recording equipment can be used both to improve accuracy and to save time [Sequeira & Mackauer, 1992a]). If the parasitoid is a gregarious species, clutch size will have to be kept constant (Sect. 1.10. describes clutch size manipulation techniques). One needs to bear in mind the possibly complicating effects of sex differences in food acquisition (and therefore growth and development) in broods of gregarious species. This problem can be partly circumvented by using uninseminated parent females, which will produce all-male egg clutches, but obtaining all-female clutches could prove very difficult (Sect. 1.10).
For idiobiont parasitoids the age of the host may be a confounding factor. For example, some parasitoids that develop in host pupae may be able to utilise both very recently formed pupae and pupae within which the adult host is about to be formed. These different types of host pupa are likely to have the same external dimensions and similar mass but are likely to represent very different amounts of resource. As host pupae age, their bodies undergo radical morphological and physiological changes in a comparatively short period of time. This includes differentiation into various body structures such as wings, the head and thorax, appendages, and sclerotisation of the cuticle, that may also affect the amount of resource available to the larvae of idiobionts. For this reason, older pupae often are of lower quality for the development of idiobionts than pre-pupae or young pupae (Harvey, 2005). Similarly, older egg are often less suitable and less preferred hosts for egg parasitoids than younger eggs. This may be because older eggs contain more fully developed embryos that are more difficult to consume and assilimate (Pizzol et al., 2012).
To determine whether host stage i.e., instar and not host size per se mainly accounts for any variation in growth or rate of development, parasitoids, e.g., idiobionts attacking larval Lepidoptera, can be presented with a range of host sizes within each host stage that overlaps with host sizes within the previous or subsequent stage.
Working over four trophic levels, Otto and Mackauer (1998) compared development of the idiobiont hyperparasitoid Dendrocerus carpenteri in its primary host Aphidius ervi which itself was reared in two aphid host species (Acyrthosiphon pisum and Sitobium avenae) of differing quality and growth potential. Within each aphid species, the authors found that terminal host size affected the size of A. ervi, which had a concomitant effect on the size of D. carpenteri. However, the development time of the hyperparasitoid was determined by the age of the A. ervi individual when it was attacked, and was longer in older hosts, which presumably was attributable to their reduced digestibility.
Koinobionts
During the initial phases of parasitism, hosts of koinobionts remain active and may continue feeding, growing and defending themselves (Mackauer and Sequiera, 1993). Thus, for a koinobiont the host represents a dynamic resource. One might therefore not expect the same relationship between progeny size and host size at oviposition as exists for idiobionts (Godfray, 1994; Mackauer, 1986; Harvey, 2000, 2005).
Sequeira and Mackauer (1992a, b) and Harvey et al. (1994, 1999, 2004) have shown, for different koinobionts, that adult parasitoid size (mass) is not a linear function of host size (mass) at oviposition across the full range of available host sizes (Fig. 2.47a). In the solitary parasitoids Aphidius ervi and Venturia canescens, there is a linear increase in wasp size with increasing instar up to the penultimate instar, whereas in the final instar wasp size does not increase. By contrast, in Cotesia rubecula, which is also solitary, adult wasp size more generally decreases with instar parasitised. These variations in koinobiont development are linked to differences in host usage strategy (discussed by Harvey et al., 2000b; Harvey, 2005; Harvey & Malcicka, 2016). Whereas the larvae of most koinobionts obligatorily consume most (or all) host tissues before pupation, several endoparasitoid clades contain taxa whose larvae primarily consume host haemolymph before emerging through the side of a still-living host, to pupate externally. Since in the latter group only a fraction of the available host resources is consumed, the relationship between host size and parasitoid size may be more complex than for tissue-feeders. For example, parasitoid development may be more constrained by the availability of certain nutrients in the host haemolymph, rather than by host size per se.

Source Harvey et al. (1994). Reproduced by permission of The Ecological Society of America
Growth, development and mortality of Venturia canescens (Ichneumonidae) reared in four instars of the moth Plodia interpunctella. a Adult dry mass; b development time from oviposition to adult eclosion; c mortality. Bars represent standard errors of the mean.
The relationship between development rate and the size of the host when parasitised varies, being either linear throughout the whole range of available host sizes and highest in larger hosts (Fox et al., 1967; Smilowitz & Iwantsch, 1973; Harvey et al., 2000b) or non-linear (Jones & Lewis, 1971; Avilla & Copland, 1987; de Jong & van Alphen, 1989; Harvey et al., 1994, 2000b; Fig. 2.47b).
The relationship between host size and immature parasitoid development rate has been shown to differ even among closely related koinobiont species. For instance, whereas Venturia canescens delays development in early instars, a closely related species Campoletis sonorensis (both parasitoids are in the ichneumonid subfamily Campopleginae) develops at fairly similar rates to eclosion in different host instars (Harvey & Strand, 2002). These differences appear to reflect constraints imposed by the final size of the host relative to adult parasitoid size, as well as host growth rate. Whereas V. canescens habitually attacks comparatively small caterpillars of micro-lepidopteran hosts which grow slowly, C. sonorensis parasitises larger caterpillars of macro-lepidopteran hosts that grow quite rapidly. Moreover, differences in host usage strategies among koinobionts also influence development. Whereas the larvae of most koinobionts consume virtually the entire host piecemeal before pupating (= tissue-feeders), a small number of species in several braconid subfamilies (e.g., Microgastrinae, Cheloninae) feed primarily on host haemolymph, leaving most host tissues intact when they are fully grown (= haemolymph-feeders; Harvey, 2005; Harvey & Malcicka, 2016). The mature larvae perforate the host cuticle with specialised mandibles (Nakamatsu et al., 2006) and pupate externally, either spinning cocoons under the host body or attached to the host cuticle (Harvey et al., 2008a, b; Quicke, 2014). Species of tissue- and haemolymph-feeders can be found in the braconid subfamily Microgastinae (Harvey et al., 2000b; Harvey & Gols, 2018). The parasitised host is often ‘usurped’ by haemolymph-feeders as a surrogate bodyguard to protect the parasitoid cocoons against natural enemies such as predators and hyperparasitoids (Grosman et al., 2008; Harvey et al., 2008a, b, 2011; Mohan & Sinu, 2017) or as an alternate, more nutritionally valuable source of prey for predators (Harvey et al., 2013a, b).
Valuable insights into the effects of host stage on growth and development can be obtained by plotting the growth trajectories of both the host and the parasitoid (Sequeira & Mackauer, 1992b; Harvey et al., 1994, 1999; Harvey & Strand, 2002; Fig. 2.48). Growth trajectories are studied by taking each host stage, dissecting parasitised hosts at various points in time after oviposition, separating the parasitoid larva from the host and measuring the dry weight of each. A trajectory is also plotted for unparasitised hosts. Using growth trajectories, Sequeira and Mackauer (1992b) showed that A. ervi responds to host-related constraints upon larval growth, and arrests host growth at a largely fixed time approximately 8 days after oviposition, at which point aphids parasitised as early instars have not reached their maximum size. In A. ervi, development time and adult mass covary positively (i.e., there is a trade-off between development rate and growth) with an increase in host size from first to third instar, but they vary independently in parasitoids developing in fourth-instar hosts. In the latter, adult mass does not increase but development rate does. Overall parasitoid development time is therefore approximately constant, whereas the largest wasps emerge from third- and fourth-instar aphids. The growth trajectories shown in Fig. 2.48 indicate that in early-instar hosts parasitoid growth and development rate are limited by the small size and growth potential of the host (compare, in Fig. 2.48, the average mass attained by parasitised aphids with that attained by unparasitised aphids of equivalent age). By contrast, in fourth-instar hosts excess resources are constantly available, thus allowing for an increase in development rate without an increase in adult mass.

Source Sequeira and Mackauer (1992b). Reproduced by permission of The Ecological Society of America
Growth trajectories of Aphidius ervi (▲) and of parasitised pea aphids (○) at different ages: a host nymphal instar one (24 h); b host nymphal instar two (48 h); c host nymphal instar three (72 h); d host nymphal instar four (120 h). The solid curve shows the corresponding trajectory of unparasitised aphids, samples of which were taken at various ages from birth to maturity. Arrows indicate the age of the host at oviposition. The ‘turnover’ point of the parasitoid growth trajectory corresponds to parasitoid age of 8 days. The trajectory of parasitoid larval growth provides a direct measure of host ‘quality’, reflecting the nutritional relationship between the two insects during the course of parasitism, and its shape will be characteristic of the parasitoid species. All curves will, however, be ‘J’-shaped, there being two functionally distinct phases in the development of holometabolous insects: first there is an exponential growth phase as the parasitoid larva feeds and converts host tissues into its own body mass, then there is a negative exponential decay phase between pupation and adult eclosion, when feeding has stopped and there is differential mass reduction due to respiration, water loss and voiding of the meconium (Harvey et al., 1994).
As pointed out by Harvey et al. (1994), A. ervi may represent one end of a continuum of strategies among parasitoids, the other extreme being to delay parasitoid growth until the host reaches its maximum size (in which case we would expect parasitoid size to be unaffected by instar at oviposition but development rate to be highly variable). The latter pattern is exhibited by Apanteles carpatus, which attacks a wide range of sizes (representing all larval instars) of its host, the clothes moth Tineola bisselliella. Irrespective of host size at oviposition, the size of emerging wasps is close to uniform, whereas development time increases exponentially with a decrease in host size, some wasps taking three months to complete their development in very small hosts (Harvey et al., 2000b). The strategy of V. canescens appears to lie somewhere along the continuum between the aforementioned two extremes (Harvey et al., 1994; Harvey & Vet, 1997). See Harvey and Strand (2002) for a review of parasitoid developmental strategies.
As these studies have shown, by comparing the development of koinobionts in very small or otherwise nutritionally suboptimal hosts, it should be possible to elucidate the nature of trade-offs between life-history variables. The experimental protocol for studying the effects of host stage at oviposition upon growth and development is slightly more complex for koinobionts than for idiobionts inasmuch as the hosts need to be reared. Care must be taken to control for the effects of variations in host diet; Harvey et al. (1994), for example, reared hosts with an excess of food. However, as pointed out by Mackauer and Sequeira (1993), there is a need to examine the dynamics of parasitoid development under different constraints. These might include superparasitism, particularly in the case of gregarious species, where crowding intensifies competition with conspecifics for access to limited host resources (Wajnberg, et al., 1990; Harvey, 2000). There is also a need for more studies on the nutritional integration between host and parasitoid when hosts are reared on various food plants containing different concentrations of constitutively expressed or induced defensive chemical compounds (see below).
2.9.2.8 Host Species
Given that hosts of different species are likely to constitute different resources, in both qualitative and quantitative senses, we would expect parasitoid growth and development to vary in relation to the host species parasitised. This is indeed the case, as studies with both idiobionts and koinobionts have shown (although few workers have measured growth together with development) (Taylor, 1988; Ruberson et al., 1989; Corrigan & Lashomb, 1990; Harvey & Thompson, 1995; Harvey & Vet, 1997; Harvey & Gols, 1998; Harvey et al., 1999, 2010, 2015; McNeill et al., 1999; Nicol & Mackauer, 1999; Eben et al., 2000; Seal et al., 2002; Shameer et al., 2002; Bazzocchi et al., 2003; Pérez-Lachaud et al., 2004; Harvey, 2005; Milonas, 2005; Häckermann et al., 2007; Ghimire & Phillips, 2014; Lupi et al., 2017; Abdi et al., 2021).
Salt (1940), for example, showed how the size of adult progeny of Trichogramma evanescens varied with the species of moth within which larval development occurred (Fig. 2.49). Moratorio (1987), working with Anagrus mutans and A. silwoodensis, showed that female progeny were larger when development occurred in the (large) eggs of Cicadella viridis, but were smaller when development occurred in the (small) eggs of Dicrantropis hamata. However, whereas A. silwoodensis develops fastest in C. viridis, A. mutans develops fastest in D. hamata, i.e., development rate and growth countervary in relation to host species in A. mutans. Development rate and growth also countervary in relation to host species in Telenomus lobatus (Scelionidae): wasps develop more rapidly in eggs of Chrysoperla species than in eggs of Chrysopa species, but the adults attain a larger size in eggs of the latter genus, the eggs being larger than those of Chrysoperla (Ruberson et al., 1989).

Source Salt (1940). Reproduced by permission of Cambridge University Press
The relative sizes of female Trichogramma evanescens (Trichogrammatidae) and female progeny reared from different host species. The reader should note that the confounding effects of progeny clutch size were not controlled for in Salt’s (1940) experiments (development was solitary in Sitotroga and Anagasta (now Ephestia) but was either solitary or gregarious in Agrotis). The female that emerged from the egg of Agrotis developed solitarily; nevertheless, females that developed gregariously in that host species were on average markedly larger than those that developed in either of the other two host species.
Similar findings have been reported in some koinobionts. In V. canescens, adult wasp size is positively correlated with the growth potential of the particular host species, although development time is extended in larger hosts (Harvey & Thompson, 1995; Harvey & Vet, 1997). By contrast, in C. rubecula, emerging wasps are larger and develop more rapidly in a smaller, habitual host (Pieris rapae), than in corresponding stages of a larger, factitious host (P. brassicae, Harvey et al., 1999). Harvey et al. (1999) found that C. rubecula arrested the development of P. brassicae larvae at an earlier stage (and smaller size) than that of larvae of P. rapae. This effect could be related to the fact that P. rapae is generally a much more suitable host for C. rubecula, which is rarely recovered in the field from other host species, including P. brassicae. Further investigations should focus on the potential influence of host species on parasitoid development among host species of equivalent size (mass). If differences in performance are recorded, then this would suggest that the quality, rather than the quantity, of host resource affects growth and development.
2.9.2.9 Multitrophic Interactions and the Performance of Natural Enemies
It is well established that plants play an important role by mediating a suite of physiological interactions amongst the herbivores feeding on them and the natural enemies of the herbivores. Plants contain a bewildering array of toxic secondary compounds (Karban & Baldwin, 1997; Schoonhoven et al., 2005), some of which negatively affect the herbivore’s growth, development and survival (van Dam et al., 2000; War et al., 2012; Nishida, 2014; Kessler & Kalske, 2018; Gajger & Dar, 2021). These toxins are also frequently sequestered in the haemolymph or body tissues of resistant herbivores, thus providing them with the potential for some degree of protection against their natural enemy complex (Tullberg & Hunter, 1996; Wink et al., 2000; Omacini et al., 2001; Erb & Robert, 2016; Petscheka and Agrawal, 2016).
Many studies have reported that allelochemicals in the diet of the prey or host can negatively affect the growth, development, survival or morphology of their predators and parasitoids (Barbosa et al., 1986; Duffey et al., 1986; Gunasena et al., 1990; Paradise & Stamp, 1993; Karban & English-Loeb, 1997; Havill & Raffa, 2000; Harvey et al., 2005, 2007; Lampert et al., 2010; Zimmerman et al., 2021; reviewed by Turlings & Benrey, 1998; Ode, 2006, 2019). In some cases, one of the aforementioned life-history variables is negatively affected whereas another is not (Karban & English-Loeb, 1997), and allelochemicals may reduce development rate and growth rate only when prey are scarce (Weisser & Stamp, 1998). The effects of interspecific variation in plant quality may even work their way up to organisms in the fourth trophic level, such as primary parasitoids of insect predators or obligate hyperparasitoids (Orr & Boethel, 1986; Harvey et al., 2003, 2007).
Harvey et al. (2003) and Fritz et al. (1997) demonstrated differences in the performance of parasitoids depending on host plant quality. Schädler et al. (2010) observed that the effects of genotypes across trophic levels are more complex than the argument that high-quality plants produce high-quality herbivores with positive effects on higher trophic levels. The plant genotypes may have significant effects on the performance of herbivores, but the influence of plant genotype on predators and parasitoids is weaker than on herbivores (Schädler et al., 2010). In similar experiments, Shameer (2017) reported differences in larval, pupal and egg-to-adult period of the lepidopteran herbivore Opisina arenosella feeding on the leaves of different varieties/hybrids of coconut, but for the parasitoid Goniozus nephantidis reared on these hosts, developmental timing differences were observed only in the pre-oviposition and pupal periods. However, the egg-to-adult survival of the parasitoid was affected by the variety of coconut on which the host had fed. Similarly, the plant genotypes on which Plutella xylostella were reared affected the developmental times of both females and males of the parasitoid Diadegma insulare (Cresson) (Ichneumonidae) (Sarfraz et al., 2008). This may be due to the presence or absence of specific nutrients in the host’s diet, the presence of detrimental allelochemicals, or an interaction between nutrients and allelochemicals (Turlings & Benrey, 1998).
Experiments can be conducted in which growth and development of predators and parasitoids are measured when the carnivores are reared on separate cohorts of hosts or prey that have been fed on resistant and non-resistant strains of a cultivated plant, or on related species of wild plants. Of particular interest is the degree of adaptation shown by adapted specialist herbivores and their parasitoids, which in some cases perform better on more toxic plant species or genotypes (Harvey et al., 2003). The effects of plant secondary compounds can also be investigated by incorporating the chemicals into the artificial diet of the herbivore (e.g., Campbell & Duffey, 1979; Williams et al., 1988; Reitz & Trumble, 1997; Weisser & Stamp, 1998). Small amounts of a compound added to such a diet may even improve parasitoid larval performance (Williams et al., 1988; Harvey et al., 2007). It should also be noted that fungal endophytes produce toxins that may affect larval parasitoid growth and/or development (e.g., Barker & Addison, 1996; Bultman et al., 1997).
2.9.2.10 Superparasitism, Multiparasitism, and Intrinsic Competition
Introduction
Superparasitism is defined as the laying of an egg (by a solitary parasitoid) or a number of eggs (by a gregarious parasitoid) in (or onto) an already parasitised host (Sect. 1.9.4). In the case of a solitary parasitoid species, only one larva per superparasitised host survives. In a gregarious species the number of survivors per host will depend on the total number of eggs laid and the size of the superparasitised host (Beckage & Riddiford, 1978; le Masurier, 1991). In multiparasitised hosts, two species of parasitoids compete for host resources, and in solitary species, only one species survives. In gregarious parasitoids, both species may survive multiparasitism, but otherwise the effects on survival and development are generally similar to those observed with superparasitism (Harvey et al., 2013a, b; Cusumano et al., 2016). This section is concerned with ways of studying the fitness consequences for surviving larvae, and asks how larval growth and development rate might be affected by superparasitism.
Solitary Parasitoids
Models of superparasitism as an adaptive strategy in solitary species (van der Hoeven & Hemerik, 1990; Visser et al., 1990) have been based on the assumption that superparasitism has no fitness consequences for the surviving larva, i.e., it does not increase larval development time or reduce adult size. This would seem to be a reasonable assumption, since in solitary parasitoids supernumerary larvae (larvae in excess of the number that can ultimately survive, i.e., can complete development) are usually eliminated before they can utilise an appreciable amount of host resource. For example, Visser et al. (1992) found no convincing evidence that Leptopilina heterotoma adults emerging from singly parasitised hosts were larger than adults emerging from superparasitised hosts (see also Ueno, 1997). However, as pointed out by Bai and Mackauer (1992) and Harvey et al. (1993), superparasitism may have fitness consequences for the larvae of some parasitoid species. Simmonds (1943) and Wylie (1983), for example, reported that in Venturia canescens (Ichneumonidae) and Microctonus vittatae (Braconidae) larvae take longer to develop in superparasitised hosts than in singly parasitised hosts, although neither author recorded the number of eggs contained per host. Similarly, Vinson and Sroka (1978), subjected hosts of Cardiochiles nigriceps (Braconidae) to varying numbers of ovipositions, recorded the time taken from oviposition to larval emergence from the host, and showed that as the degree of superparasitism increased, mean development time of the surviving larva increased (Table 2.1).
The fitness cost to koinobionts may be partly determined by the ability of the surviving larva to compensate for possibly reduced growth during embryonic and early larval development (when it may compete with the rival larva for host resources) by increasing growth later in development (Bai & Mackauer, 1992), and the same might apply to development rate. Bai and Mackauer (1992) carried out a simple experiment in which they subjected aphids to either one oviposition (singly parasitised) or several ovipositions (superparasitised) by Aphidius ervi. They used unmated females, in order to control for the possible bias resulting from differential development (and survival) between male and female larvae. They then compared the total development time and adult weights in the different treatments. They found that Aphidius ervi gained 14% more dry mass in superparasitised hosts, i.e., growth was enhanced through superparasitism, and took no longer to develop, i.e., development rate was unaffected. The most likely explanation for this effect is that the superparasitised hosts ingested more food. As Bai and Mackauer (1992) point out, the fitness benefit, i.e., increased adult size gained by surviving larvae in superparasitised hosts, needs to be weighed against any costs in the form of reduced larval survival (Sect. 2.10.2).
As we noted above, adult size in Leptopilina heterotoma is not affected by superparasitism. In this parasitoid either compensation is complete or there is no initial reduction in growth as a result of superparasitism. Studying the trajectory of parasitoid larval growth (see above) would shed light on this.
Multiparasitism has also been shown to incur fitness costs on the surviving parasitoid. For example, in host (Pseudoplusia includens) caterpillars multiparasitised by two species of solitary Microplitis (Braconidae) parasitoids, development time was sometimes longer and adult body mass smaller in emerging wasps compared with controls (Harvey et al., 2009a, b). Similar results have been observed in egg parasitoids (Cusumano et al., 2015). In some multiparasitised hosts, one parasitoid species dominates, but offspring sex ratio becomes skewed towards male progeny (Walker et al., 2016; Luo et al., 2018). This, however, often depends on temporal differences in the sequence of the first and second ovipositions.
Experiments aimed at investigating the effects of superparasitism and multiparasitism on larval growth (as measured by adult size) and development would involve exposing a recently parasitised host to a standardised female and allowing the same or a different (conspecific or heterospecific) standardised female to deposit a specified number of eggs. The number of eggs laid in each case can be more easily monitored and controlled if the parasitoid is one of those species in which the female performs a characteristic movement during oviposition (Harvey et al., 1993; Sect. 1.11.6). The time taken from oviposition to adult eclosion and the size or weight of emerging adults will need to be measured and the different treatments compared both with one another and with controls. The experiment could be expanded to take into account the possible effects of host size or host instar, as was done by Harvey et al. (1993). They showed that superparasitism in Venturia canescens reduced development rate in parasitoids reared from both third-instar and fifth-instar larval hosts (the moth Plodia interpunctella), but that the reduction was greater in parasitoids reared from the later instar (Fig. 2.50). The size of wasps reared from third-instar hosts was unaffected by egg number (Fig. 2.51a), but adult wasps from both of the superparasitised fifth-instar treatments (two eggs, four eggs) were significantly smaller than those reared from singly parasitised hosts (Fig. 2.51b). Harvey et al. (1993) suggested that the reason superparasitism affected parasitoids from fifth-instar hosts more than those from third-instar hosts is that the fifth-instar larvae were post-feeding, wandering larvae, i.e., their growth potential is zero. Parasitism of such hosts would be more like idiobiosis than koinobiosis, and the surviving larva would be less able to compensate for any negative effects of superparasitism.

Source Harvey et al. (1993). Reproduced by permission of Blackwell Publishing
Average (± SE) effects of superparasitism on development in the solitary ichneumonid parasitoid Venturia canescens. Development time (number of days taken from oviposition to adult eclosion) of wasps reared from: a third-instar b fifth-instar larvae of Plodia interpunctella containing one, two or four parasitoid eggs.

Source Harvey et al. (1993). Reproduced by permission of Blackwell Publishing
Average (± SE) effects of superparasitism on growth (as measured by adult dry mass) in the solitary ichneumonid parasitoid Venturia canescens. The dry weight of wasps reared from: a third-instar b fifth-instar larvae of Plodia interpunctella, containing one, two or four eggs.
Gregarious Parasitoids
The fitness consequences of superparasitism have already been touched upon, from both theoretical and experimental standpoints, in Chap. 1 (Sect. 1.9.4). Leaving aside Allee effects (defined in Sect. 1.10), superparasitism and multiparasitism will intensify competition among larvae for host resources, with the result that the per capita growth and development rate of the parasitoid immatures will be reduced. This is at least what one would expect, although Nealis et al. (1984) found that increased larval density per host slowed development of Cotesia glomerata only slightly (le Masurier, 1991, found no significant effect of clutch size on development time in this species) and tended to increase the rate of development in Pteromalus puparum. Le Masurier (1991) also found no significant decrease in body size with increasing clutch size in a population of C. glomerata parasitising Pieris brassicae, although he did find such an effect in another population parasitising Pieris rapae.
The fitness consequences for surviving gregarious parasitoids in the case of multiparasitism have thus far received much less attention than in the case of superparasitism. However, in haemolymph-feeding koinobiont endoparasitoids, much of the host is not consumed by the parasitoid larva(e), reducing the intensity of competition. In some species (e.g., Microgastrinae), this has enabled two different gregarious species to emerge from the same host, a phenomenon described as ‘resource sharing’ (Harvey et al., 2013a, b), but with some fitness-related costs. For example, when caterpillars of Mythimna separata are multiparasitised by Cotesia kariyai and C. ruficrus, both parasitoids are able to successfully emerge (Magdaraog et al., 2012). However, brood sizes of both species are significantly less than in singly parasitised hosts. In intrinsic competition between the solitary endoparasitoid Microplitis mediator and the polyembryonic parasitoid Copidosoma floridanum, the latter species always wins (Strand et al., 1990). However, C. floridanum shifts investment from reproduction to defence by reallocating resources to the production of soldier larvae (and the production of less reproductive larvae) in multiparasitised hosts (Harvey et al., 2000a).
Experiments aimed at investigating the effects of superparasitism on larval growth (as measured by adult size) and development in gregarious parasitoids would involve: (1) in the case of intraspecific superparasitism, exposing a recently parasitised host to a standardised female and allowing the same or a different conspecific female to oviposit a further egg or clutch of eggs; or (2) in the case of multiparasitism, exposing a host recently parasitised by a female of one species to a female of another species.
In both cases, the time taken from oviposition to adult eclosion and the size or weight of emerging adults need to be measured and the different treatments (i.e., initial and second clutches of different sizes) compared with one another and with controls. With ectoparasitoids, eggs can be artificially added to existing clutches of various sizes (Sect. 1.10, and Strand & Godfray, 1989). Assuming competitive equivalence of clutches produced by different females, the effects upon parasitoid growth and development of simultaneous oviposition by two conspecific females would be analogous to the effects of increasing the primary clutch. That is, an increase in the number of eggs laid per host would have a negative effect, irrespective of whether the eggs are laid by one or by different females, provided all the eggs are laid at the same time. However, the competitive disadvantage of a second clutch may be underestimated from a fitness function curve that is based solely on initial clutches, if there is a significant time interval between the laying of initial and subsequent clutches (Strand & Godfray, 1989). Measurement of any such disadvantage, in terms of growth and development, to a second clutch requires the progeny from the two clutches to be distinguishable by the investigator. This is possible in those species in which there are mutant strains, e.g., the eye/body colour mutant ‘cantelope-honey’ in Habrobracon hebetor. To ensure, when using mutants, that competitive asymmetries do not bias the results of experiments, reciprocal experiments should be carried out for each clutch size and time interval combination (Strand & Godfray, 1989). Molecular markers can also be used (Sect. 3.2.2).
The possibly complicating effects of sex differences in larval food acquisition also need to be borne in mind in experiments on gregarious parasitoids: compared with the adding of a female egg, the adding of a male egg to an existing clutch could have less of an effect upon fitness of the progeny in the initial clutch.
2.9.3 Effects of Physical Factors on Growth and Development
2.9.3.1 Temperature
The importance of understanding the effects of temperature extremes on the growth, development, survival and reproduction of insects is becoming increasingly recognised in a warming world where climate extremes and heat waves are increasing in their frequency, duration and intensity (Perkins et al., 2012; Perkins-Kirkpatrick and Lewis, 2020; Sect. 2.7.4). Recent reviews highlight the effects of heat exposure on insect physiology and ecology (González‐Tokman et al., 2020; Harvey et al., 2020; Ma et al., 2021).
Development Rate
Figure 2.52 shows the typical relationship between an insect’s rate of development and temperature. There is a threshold temperature below which there is no (measurable) development; this threshold is sometimes referred to as the developmental zero. There is also an upper threshold above which further increases in temperature result in only small increases in development rate. The overall relationship is non-linear (Mills, 1981), but over the intermediate range of temperatures normally experienced by an insect species in the field, it is linear. As noted by Gilbert et al. (1976), why this should be so is a mystery, since rates of enzyme action (which are presumably basic to development) usually increase exponentially, not linearly, with increasing temperature.

Source Gilbert et al. (1976). Reproduced by permission of W.H. Freeman & Co
The rate of insect development as a function of temperature.
The deleterious effects of a high temperature extreme depend on how long the insect is exposed to it. As pointed out by Campbell et al. (1974) with reference to the development rate‒temperature relationship shown in Fig. 2.52, temperatures within the high range (i.e., the part of the relationship where the curve decelerates) have a deleterious effect upon development only if the temperature is either held constant within the range or fluctuates about an average value within the range. If the temperature fluctuates about a daily average within the medium range (i.e., the linear part of the relationship) and the daily maximum reaches the high range, no deleterious temperature effect is observed.
Given the fact that the development rate versus temperature relationship is linear over the greater range of temperatures, the total amount of development that takes place during any given time period will be proportional to the length of time multiplied by the temperature above the threshold. With this physiological time-scale of day-degrees development proceeds at a constant rate, whatever the actual temperature. This concept is elaborated upon below.
To study the dependency of overall development rate on temperature in a parasitoid, expose hosts to female parasitoids at different constant temperatures (the range being chosen on the basis of field temperature records), and measure the time taken from oviposition to adult eclosion. To demonstrate the effect of temperature on overall larval development in a predator, provide different cohorts of larval predators with a fixed daily ration of prey, at different temperatures, from egg hatch to adult eclosion. With both parasitoids and predators the thermal requirements for development can be determined for particular stages, i.e., the egg (Frazer & McGregor, 1992, on coccinellids), each larval instar and the pupa.
The data obtained from the above experiments can be described by a linear regression equation of the form:
where y is the rate of development at temperature T, and a and b are constants. If the regression line were to be extrapolated back, it would meet the abscissa (x-axis) at the developmental zero, t, which may be calculated from t = –a/b. The total quantity of thermal energy required to complete development, the thermal constant (K) can be calculated from the reciprocal of the slope of the regression line, 1/b.
Once t and K have been calculated from data obtained at constant temperatures, the rate of development under any fluctuating temperature regime can be determined by thermal summation procedures. Unit time-degrees (day-degrees or hour-degrees) above t are accumulated until the value of K is reached where development is complete. This can be done either by accumulating the mean daily temperature minus the lower threshold or by accumulating the averages of the maximum and minimum daily temperature minus the threshold (i.e., \(\sum {\left[ {\left\{ {\left( {T_{\max } - T_{\min } } \right)/2} \right\} - {\text{threshold}}} \right]}\)). However, both of these methods will result in great inaccuracies if a temperature contributing to the mean lies outside of the linear portion of the relationship. Means, by themselves, give no indication of the duration of a temperature extreme: an apparent tolerable mean temperature may actually comprise a cyclical regime of two extremes at which no development is possible. A much more accurate method is to use hourly mean temperatures (Tingle & Copland, 1988).
Summation has been used by many workers, including Butts and McEwen (1981), Osborne (1982), Goodenough et al. (1983), Nealis et al. (1984), Cave and Gaylor (1988), Rodriguez-Saona and Miller (1999) and Bazzocchi et al. (2003), Chong and Oetting (2006), Pandey and Tripathi (2008), Papanikolaou et al. (2013) and Honek et al. (2018). However, the method has been much criticised as it has two inherent faults. First, the assumed linear relationship is known to hold as an approximation for the median temperature range only (Fig. 2.52) (e.g., Campbell et al., 1974, on aphid parasitoids; Syrett & Penman, 1981, on lacewings). Second, the lower threshold upon which summation is based is a purely theoretical point determined by extrapolation of the linear portion of the relationship into a region where the relationship is unlikely to be linear. The linear model is likely to underestimate development rates when average daily temperatures remain close to the threshold for long periods, although this can easily be corrected for (Nealis et al., 1984). In an attempt to improve upon the thermal summation method, an algorithm was developed using a sigmoid function with the relationship inverted when the temperature is above the optimum (Stinner et al., 1974). The assumed symmetry about the optimum is unrealistic, but Stinner et al. (1974) argue that the resultant errors are negligible. This algorithm has also been used in simulations for Encarsia perniciosi (McClain et al., 1990), fly parasitoids (Ables et al., 1976) and other insects (Berry et al., 1976; Whalon & Smilowitz, 1979; Allsopp, 1981). Ryoo et al. (1991) used a combination model involving upper thresholds to describe the development of the ectoparasitoid Lariophagus distinguendus (Pteromalidae).
In some cases, the improvement in accuracy of simulations over the thermal summation method has been small or negligible and it is questionable whether the use of complex models is necessary in relation to normal field conditions (Kitching, 1977; Whalon & Smilowitz, 1979; Allsopp, 1981). The method of matched asymptotic expansions was used to develop an analytical model describing a sigmoidal curve that lacks the symmetry about the optimum found in the algorithm of Stinner et al. (1974). Again, the authors concerned claimed excellent results (Logan et al., 1976). However, comparisons of linear and non-linear methods to validate field data for Encarsia perniciosi showed no great differences (McClain et al., 1990).
Other non-linear descriptions of the development rate‒temperature relationship have also been developed. These include the logistic curve (Davidson, 1944) and polynomial regression analysis (Fletcher & Kapatos, 1983). Polynomial regression analysis can be used to select the best-fitting curve to a given set of data. Successively higher-order polynomials can be fitted until no significant improvement in F-value results. This approach was found useful in describing data for Diglyphus intermedius (Patel & Schuster, 1983) and mealybug parasitoids (Tingle & Copland, 1988; Herrera et al., 1989). Higher-order polynomials may produce unlikely relationships between data points and fluctuate widely outside them. Before selecting a particular fit, it should be examined over the entire range of the data. It may be better to choose one that has a comparatively poor fit but is biologically more realistic (Tingle & Copland, 1988).
Several authors have reported acceleration or retardation of development, when comparisons are made between development periods at cycling temperatures and at a constant temperature equivalent to the average of the cycling regime. The question of whether these effects are an artefact or are a real biological phenomenon is discussed by Tingle and Copland (1988).
Until recently, data on the development times of insects were almost always expressed in the form of means and standard deviations (Howe, 1967; Eubank et al., 1973; Sharpe et al., 1977). Several models have been developed which include a function to account for the asymmetrical distribution of development times (Stinner et al., 1975; Sharpe et al., 1977; Wagner et al., 1984). Such models can be incorporated into population models (Barfield et al., 1977b, on Habrobracon mellitor). However, the poikilotherm model of Sharpe et al. (1977) did not give any great improvement in accuracy over day-degree models when predicting development of Trichogramma pretiosum (Goodenough et al., 1983).
Biological control workers can use laboratory-obtained information on the effects of temperature on development in deciding which of several candidate species, ‘strains’ or ‘biotypes’ of parasitoids and predators to either introduce into an area or use in the glasshouse environment. In classical biological control programmes, the usual practice is to introduce natural enemies from areas having a climate as similar as possible to that in the proposed release area (Messenger, 1970; Messenger and van den Bosch, 1971; van Lenteren, 1986; Sect. 7.4.3). If there are several species, strains or biotypes to choose from, the one found to have a temperature optimum for development that is nearest to conditions in the introduction area should be favoured, all other things being equal.
A classic example of a biological control failure resulting from the agent being poorly adapted to the climate of the introduction area is the introduction of a French strain of Trioxys pallidus into California to control the walnut aphid. This parasitoid was poorly adapted to conditions in northern and especially central California where it never became permanently established. The French strain was unable to reproduce and survive to a sufficient extent in areas of extreme summer heat and low humidity. A strain from Iran was subsequently introduced and proved far more effective (DeBach & Rosen, 1991).
Data on development rate‒temperature relationships are used in population models to investigate dynamics and phenologies in a biological control context (Chap. 7). Morales and Hower (1981) showed that they could predict the emergence in the field of 50% of the first and second generations of the weevil parasitoid Microctonus aethiopoides (Braconidae) by using the day-degree method. Goldson et al. (1998) applied a phenological model retrospectively to the phenology of Microctonus hyperodae and its weevil host. McClain et al. (1990) used the linear day-degree model and the sigmoid function model of Stinner et al. (1974) to predict the peaks of activity of parasitoids in orchards. The linear model predicted 8 of 13 peaks within ±7 days, while the non-linear model was accurate for 7 of 13 peaks. Horne and Horne (1991) showed that simple day-degree models could account for the synchronisation of emergence of the encyrtid parasitoid Copidosoma koehleri and its lepidopteran host.
Growth Rate
Most studies on temperature relationships have dealt with development but have ignored growth. The relationship between growth rate and temperature in insects has been shown by direct measurement to increase linearly with temperature within the range of temperatures normally experienced by the insect in the field, in accordance with the following model:
where T is the temperature, θ is the threshold temperature below which no growth occurs, w is the larva’s weight at time t, and a is a constant (Gilbert, 1984). Gilbert (1984) used this model to predict pupal weight, which determines fecundity, in the butterfly Pieris rapae. Tokeshi (1985) describes another method for estimating minimum threshold temperature and day-degrees required to complete growth, suitable for use with aquatic or terrestrial insects in either the laboratory or the field.
In some predator species the tendency is for successive larval instars to achieve a growth rate maximum at a higher temperature, e.g., in Adalia bipunctata the maxima recorded were 20°, 22.5°, 22.5° and 25 °C for the first, second, third and fourth instars respectively (Mills, 1981). Mills (1981) suggested these differing optima could reflect the increasing temperatures experienced by the coccinellid larvae as they progress through the life-cycle in the field. Aksit et al. (2007) found a linear, negative relationship between temperature and rate of development of immature (eggs and larvae) in the mite-feeding ladybird Stethorus gilvifrons. However, in other predators, there is no such tendency, e.g., in the damselflies Lestes sponsa, Coenagrion puella and Ischnura elegans maximum development rates were recorded at the same temperature for the last five instars (Pickup & Thompson, 1990).
Interaction Between Temperature and Consumption Rate
Whilst temperature will affect growth and development rates of predators directly, one has to be aware that it can also exert an influence by changing the prey consumption rate (Mills, 1981; Gresens et al., 1982; Sopp & Wratten, 1986; Pickup & Thompson, 1990; Fig. 2.53). The rate at which food passes through the gut will be positively temperature dependent, and this will affect consumption rate by affecting hunger (insect hunger is directly related to the degree of emptiness of the gut; Johnson et al., 1975). B in Eqs. 2.10–2.15 (representing in part basal metabolic costs) will also be temperature dependent (Pickup & Thompson, 1990), and consumption rate will increase to counteract an increase in B.

Source Sopp and Wratten (1986)
The effect of temperature on the mean weight of aphids (Sitobion avenae) consumed per day by eleven species of carabid and staphylinid beetles. In the experiments, individual beetles were given an excess of prey (first and second instar, in approximately equal proportions).
To take any confounding effects of varying consumption rate into account when assessing the influence of temperature on growth and development rates in Adalia bipunctata, Mills (1981) compared the mean growth and development rates recorded at the experimental range of temperatures (i.e., fixed daily ration of prey) with those predicted from Fig. 2.41 (i.e., constant temperature regime) for the appropriate rates of consumption (Fig. 2.54). With this analysis, Mills (1981) recorded significant deviations from the predicted growth and development rates, indicating that temperature does have a direct influence on growth and development.

Source Mills (1981). Reproduced by permission of Blackwell Publishing
The mean (± SE, n = 6‒10) rates of prey consumption and development of the immature stages of Adalia bipunctata (Coccinellidae) in relation to prey availability at: a a constant temperature (20 °C) and various ‘feeding levels’ (the weight of prey corresponding to 1 to 5 times the average teneral weight of the instar); b a range of temperatures, using one (4 times) feeding level.
A more straightforward approach to determining how consumption rate interacts with temperature to affect development rate involves plotting development rate against consumption rate, constructing regression lines for each temperature regime and then comparing the slopes of the lines. As can be seen from plots for the damselfly Coenagrion puella (Fig. 2.55), higher consumption rates produce stronger developmental responses to increases in temperature.

Source Pickup and Thompson (1990). Reproduced by permission of Blackwell Publishing
Development rate in relation to consumption rate (note log scale) in Coenagrion puella (Odonata: Zygoptera). Temperature affects development directly and indirectly by increasing the prey consumption rate. There is a clear interaction effect between temperature and consumption rate.
2.9.3.2 Other Physical Factors
Diurnal predator larvae may, like the adults (Sect. 2.7.4), show a reduction in daily consumption rate with decreasing photoperiod, and this will be reflected in a reduction in growth and development rates. Bear in mind, when varying photoperiod in experiments, that you may also be inadvertently varying the absorption of radiant energy by insects, thus altering their body temperature.
Larvae of terrestrial predators may, like the adults, increase their rate of prey consumption with decreasing humidity, which will cause them to grow larger and more rapidly. Predator larvae may develop faster in an incubator than in a large environment chamber, even at the same temperature, because of the lower humidity in the former (Heidari, 1989).
For a study of the effects of photoperiod on parasitoid development, see Urbaneja et al. (2001a).
2.10 Survival of Immatures
2.10.1 Introduction
Below we discuss some factors that affect the survival of predator and parasitoid immatures. Parasitism and predation by heterospecifics are not considered (see Chap. 7 for practical approaches), whereas predation by conspecifics, i.e., cannibalism (Sabelis, 1992) is. Mortality of parasitoid juveniles is strongly dependent on that suffered by the hosts that support them. Hosts may be killed through predation, starvation and exposure to unfavourable weather conditions, and any parasitoids that are attached to or contained within the hosts will die. Price (1975) illustrated this relationship by reference to the host survival curves, which in insects are of either Type II or Type III (Fig. 2.35), i.e., substantial mortality of hosts (very substantial in the latter case), and therefore of any parasitoid progeny they support, occurs by the mid-larval stage (see also Cornell et al., 1998).
When investigating larval mortality, the possibility ought to be considered that some factors may cause higher mortality in one sex than in another. Some parasitoids allocate male eggs to small host individuals and female eggs to large individuals (Sect. 1.11). If small hosts suffer a higher degree of mortality from a predator than larger ones, then the survival rates of male and female parasitoids will differ.
2.10.2 Effects of Biotic Factors on Survival of Immatures
2.10.2.1 Food Consumption by Predators
By recording deaths of individuals within each instar in the food consumption experiment outlined earlier, the relationship between food consumption and survival can be studied. A model relating larval survival to prey availability was developed by Beddington et al. (1976). If we assume that we are not dealing with a population of genetically identical individuals, then we would expect mortality through food shortage to take place at some characteristic mean ingestion rate μi, with the population as a whole displaying variation about this mean value. Assuming that the proportion of the population experiencing ‘food stress’ is normally distributed about the mean, with standard deviation σ, then the proportion (S) of the larval population surviving to complete development within any particular instar of duration d, at an ingestion rate I, will be given by (Beddington et al., 1976):
where \(z = \frac{{I - \mu_{i} }}{{\sigma_{i} }}.\)
Using Eqs. 2.2 and 2.18, S may be expressed in terms of either consumption rate or prey density (Fig. 2.56). The relationship in Fig. 2.56c is shown by predators in the laboratory (Fig. 2.57). As pointed out by Beddington et al. (1976), whether a survival curve rises extremely rapidly or slowly depends on the range of prey densities over which experiments are carried out and the graphical scales chosen for plotting the data.

Source Beddington et al. (1976). Reproduced by permission of Blackwell Publishing
Hypothetical relationships between a the proportion of individual predators surviving to the end of an instar and their mean feeding rate during that instar; b predation rate and prey density; c the relationship obtained by combining a with b.

The relationship between the proportion of predators surviving to the end of an instar, and the mean density of prey available during that instar. a First instars of the coccinellid beetle Adalia bipunctata (data from Wratten, 1973); b tenth, eleventh and twelfth (final) instars of the damselfly Ischnura elegans (source Lawton et. al., 1980). Reproduced by permission of Blackwell Publishing
Mortality due to nutritional stress apparently occurs at feeding rates very much higher than the minimum rate necessary for growth and development, so that individuals that are growing normally (albeit slowly) at low feeding rates are apparently highly likely to suffer high mortality at the moult (Beddington et al., 1976). There may be no relationship between the overall survival rate between entering and leaving an instar (S) and the duration of each instar (d), as in Blepharidopterus angulatus, or S may decline in a variety of ways with increasing d (examples are given in Beddington et al., 1976).
Survival rates vary between successive instars at comparable prey densities. Figure 2.58 summarises the relationship between instar and the feeding rate at which 50% of a larval cohort survive, in four predatory insects and a spider. The plots indicate a constant increase in feeding rate between instars to maintain survival rates at 50%. In the case of Ischnura elegans, feeding rates necessary to ensure 50% survival approximately doubled between instars ten and eleven, and increased by a factor of 1.4 between instars eleven and twelve (Lawton et al., 1980). The theoretical line in Fig. 2.58 is for larvae that double their body weight between instars and in which minimum requirements increase by a 0.87 power of body weight (which they do for larvae of a damselfly closely related to Ischnura). The steeper slopes shown by Adalia, Notonecta and the spider perhaps reflect the higher exponents in their metabolic rate:weight relationships and/or larger increases in average body weights between instars (Lawton et al., 1980).

Source Lawton et al. (1980). Reproduced by permission of Blackwell Publishing
The relationship between instar number (in Roman numerals) and the consumption rate (feeding rate) at which 50% of a cohort of larvae in a particular instar successfully complete their development (LD50 for food stress): a Adalia decempunctata (Coccinellidae) (data from Dixon, 1959); b Notonecta glauca (Notonectidae) (data from McArdle, 1977); c Linyphia triangularis (Arachnida: Linyphiidae) (data from Turnbull, 1962); d Blepharidopterus angulatus (Miridae) (data from Glen, 1973). The theoretical line is for larvae that double their body weight between instars, and where food-energy requirements increase by a 0.87 power of body weight.
2.10.2.2 Prey Species
The relationship between larval survival and prey species has been most thoroughly investigated in coccinellid beetles (Hemptinne et al., 2000; Wiebe & Obrycki, 2002; Őzder & Sağlam, 2003; Barbosa et al., 2014). Coccinellid larvae have been presented with acceptable prey of various species, and larval mortality measured (Hemptinne et al., 2000, studied intraguild predation). In the lacewing, Dichochrysa prasina, preimaginal survival, development time, adult longevity and fecundity were significantly affected when fed on different kinds of prey, such as the eggs, larvae and/or adults of aphids, moths and beetles (Pappas et al., 2007).
Consumption rate in relation to each prey species can be measured, and prey-related differences in survival correlated with differences in consumption rate. However, if there is a reduced rate of consumption on a prey species and survival is also low on that species, one cannot necessarily conclude that poor survival is a direct result of reduced consumption rate. Survival on the ‘better’ prey species may still be higher than on the ‘poorer’ one at equivalent consumption rates (Hodek, 1973). If it is, then the prey-related difference in survival may be due to factors such as differences in the size or qualitative attributes of the prey species.
2.10.2.3 Interference and Exploitation Competition, Cannibalism
Interference from conspecifics and predators can, through its effects on feeding rates, potentially reduce survival (Heads, 1986; Sih, 1982, Sect. 2.9.2). Exploitation is an obvious potential cause of mortality among larval conspecifics, as prey may be depleted to a level at which larvae experience nutritional stress.
Cannibalistic behaviour is an additional cause of mortality in the immature stages of dragonflies, damselflies, water-boatmen, coccinellid beetles, ground beetles, anthocorid bugs and antlions (Mills, 1982; Crowley et al., 1987; Sih, 1987; Nasser & Abdurahman, 1990; Agarwala & Dixon, 1992; Griffiths, 1992; Hopper et al., 1996; Gagné et al., 2002; Michaud, 2003; Frank et al., 2010). The adults and larvae of several Coccinellidae are known to be cannibalistic on eggs (Gagné et al., 2002) [The neonate larvae of the coccinellid Coleomegilla maculata lengi prefer the eggs of conspecifics to aphid prey (Gagné et al., 2002).] In dragonflies, cannibalism may result in the death not only of one of the interacting pair (same or smaller instar larva) but also of both participants, since it could attract the attention of predators (Crowley et al., 1987) (this also applies to non-cannibalistic interference). Hopper et al. (1996) showed that in the dragonfly Epitheca cynosura cannibalism among larvae was more important than exploitation competition in determining survival; they also found that when juveniles hatch asynchronously in close proximity, cannibalism is density dependent (so can therefore contribute to population regulation), and they concluded that it can also increase population synchrony by exerting size-specific mortality on smaller individuals throughout development.
The effects of competition or cannibalism on survival in immature stages can be expressed as either percentage mortality plotted against predator density or as k-values for the mortality plotted against log10 predator density (Varley et al., 1973; Sect. 7.3.4). If density-dependent mortality occurs, it will be shown within the upper range of densities only, i.e., there will be a threshold density of predators below which k is zero (Mills, 1982) (or its value is slighty above zero, in which case one has to question whether the mortality recorded at low predator densities is entirely attributable to interference, exploitation or cannibalism). The manner in which k varies with log10 predator density indicates the nature of the density dependence, i.e., exact, over- or under-compensation (Sect. 7.3.4) and whether competition is of the scramble type or contest type (for explanations of these terms, see Varley et al., 1973; Begon et al., 1996).
Bear in mind that for the perpetrator, survival may be improved by cannibalism: larvae of the coccinellid Cycloneda sanguinea had a higher survival rate when fed conspecific eggs, than when fed moth eggs (Michaud, 2003).
Destructive host-feeding by parasitoids will very rapidly kill any parasitoid immatures contained within the host (Jervis & Kidd, 1986; Kidd & Jervis, 1991). Non-destructive host-feeding is unlikely to kill parasitoid immatures in the short-term, but could nevertheless reduce their life expectancy (e.g., Heimpel & Collier, 1996; Ueno, 1997).
2.10.2.4 Host Size, Age or Stage
As well as measuring growth and development of parasitoids, larval survival can also be recorded in relation to host size at oviposition. One might reasonably assume, for nutritional reasons, that generally for solitary idiobionts survival is highest in large hosts, although there could be cases where hosts above a certain size represent a resource in excess of the amount required by the larva to complete its development (in such cases larval survival may not be improved in the largest hosts, and it may even be reduced, e.g., due to putrefaction of the remaining host tissues, see also Ode & Strand, 1995) (Sect. 2.9.2).
The relationship for koinobionts is likely to be more complex. For the solitary koinobionts Lixophaga diatraeae and Encarsia formosa, survival is highest in individuals that complete their development in medium-sized hosts (Miles & King, 1975; Nechols & Tauber, 1977). For the solitary koinobiont Leptomastix dactylopii, no significant differences were found between survival in different-sized hosts (de Jong & van Alphen, 1989). In Venturia canescens survival is highest in medium-sized hosts and lowest when the second-instar host is oviposited in (Fig. 2.47c). The probable reason for the lower survival in second-instar hosts is injury to the host through insertion and removal of the ovipositor (this does not occur when later instars are attacked) (Harvey et al., 1994). By contrast, in the solitary endoparasitoid Microplitis demolitor, survival was lowest in 1-day old (early L1) hosts and 6‒8-day-old (late L3 and L4) hosts (Chrysodeixis includens caterpillars) and highest in 2‒4-day-old (late L1 and L2) hosts (Harvey et al., 2004). In this association, encapsulation of parasitoid eggs and larvae in larger hosts probably accounted for higher mortality. However, some fully developed parasitoid larvae were unable to egress from the host, presumably because they were unable to perforate the cuticle with their mandibles. Unlike larvae of V. canescens, which consume virtually the entire host before pupation, larvae of M. demolitor are haemolymph-feeders and thus consume only a relatively small fraction of tissues of larger hosts (Harvey, 2005; Harvey & Malcicka, 2016).
As described above, a possible complicating factor in experiments is mortality from encapsulation, which may be higher in some stages than in others (usually larger, later-instar hosts possess stronger immune defences than young larvae). Therefore, samples of hosts need to be taken and dissected during larval development to provide data on the frequency of encapsulation, so that this potential confounding factor can be controlled for in data analyses.
In those gregarious parasitoids in which progeny survival is 100% at the smallest clutch size, 100% survival might also occur at larger clutches if larger-sized hosts are utilised. The slope of the relationship might also be less steep in the case of larger hosts.
2.10.2.5 Host Age
Host age, rather than host size, could influence parasitoid survival. The effects of the two variables may, however, be difficult to disentangle. Survival in some egg parasitoids depends on the age at which the host egg is attacked (Ruberson & Kring, 1993).
2.10.2.6 Host Species
Given that different host species are likely to constitute different resources, both qualitatively and quantitatively, parasitoid larval survival may vary with host species, the larvae (or eggs) dying through malnutrition, encapsulation (see Host Physiological Defence Reactions, below) or poisoning (e.g., if the host has sequestered toxins from its food plant, see Multitrophic Interactions and The Performance of Immatures, above).
In Telenomus lobatus percentage eclosion, i.e., survival of progeny, was higher from the eggs of Chrysoperla species than from eggs of Chrysopa species (Ruberson et al., 1989). In the egg parasitoid Trissolcus basalis oviposition in eggs of the Brown Marmorated Stink Bug, Halyomorpha halys, an invasive pest, rather than of the normal host (the Southern Green Stink Bug, Nezara viridula), leads to considerably lower offspring survival, and has been seen as an ‘evolutionary trap’; however, the few survivors can be unusually large and this may suffice to offset the disadvantage (Mesterton-Gibbons et al., 2021, and references therein). In the gregarious idiobiont Habrobracon hebetor, survival within clutches was density dependent both on a small moth species, Plodia interpunctella, and on a large moth species, Anagasta kuehniella, but the density dependence in the latter case applied only to very high (artificially manipulated) clutch sizes (Taylor, 1988).
To investigate the effect of host species on larval survival, present females with hosts of different species and, if possible, of equivalent size and age. Maintain the hosts until the parasitoids pupate, and maintain the parasitoid pupae until the adults have ceased emerging. Any hosts that have received eggs but have not given rise to parasitoids should be examined (dissected in the case of endoparasitoids) for the remains of parasitoid eggs or larvae. Any parasitoid pupae that fail to produce adults should also be recorded. Sex differences in survival should also be established (Ruberson et al., 1989).
2.10.2.7 Hosts’ Food Plant
See the subsection Multitrophic Interactions and the Performance of Natural Enemies (Sect. 2.9.2.9).
2.10.2.8 Superparasitism and Multiparasitism
Solitary Parasitoids
In solitary endoparasitoids, supernumerary larvae are eliminated (contest competition) either through physiological suppression or (more usually) through combat (Clausen, 1940; Fisher, 1971; Vinson & Iwantsch, 1980b; Quicke, 1997; Harvey et al., 2013a, b). This applies to self- and con-specific superparasitism as well as heterospecific superparasitism (= multiparasitism).
The first-instar larvae of almost all solitary parasitoid wasp species are equipped with robust, often sickle-shaped mandibles (Fisher, 1961; Salt, 1961; Fig. 2.59). Fighting often takes place between larvae that are of approximately the same age, although in some species first-instar larvae will attack and kill later instars that either have reduced mandibles or lack mandibles altogether (Chow & Mackauer, 1984, 1986). Note that the possession by first-instar larvae of large mandibles does not necessarily mean that fighting is the sole mechanism employed in the elimination of rivals (Strand, 1986; Mackauer, 1990). Also, bear in mind that the first-instar larvae of some facultatively gregarious species possess sharp mandibles, but the larvae do not practise siblicide (e.g., Aphaereta pallipes, Mayhew & van Alphen, 1999).

Source Salt (1961), reproduced by permission of The Company of Biologists Ltd
Larvae of parasitoid wasps that in the first instar have mandibles for fighting (a, c, e) but do not have such mandibles in the second instar (b, d, f). a, b Biosteres fletcheri (Braconidae); c, d Psilus silvestri (Diapriidae). e, f Diplazon fissorius (Ichneumonidae).
The mechanisms employed in the elimination of larval competitors in three solitary braconid parasitoids are summarised in Fig. 2.60. As with other parasitoids, in cases of intraspecific larval competition the oldest larva generally survives and the younger larva dies, although this may not apply where the larval age difference is either very small or very large (in the latter case the older larva may have developed to the second, i.e., non-mandibulate instar by the time the second egg is either laid or hatches; Bakker et al., 1985; see also Marris & Casperd, 1996).

Source Mackauer (1990). Reproduced by permission of Intercept Ltd
The mechanisms used in the elimination of competitors by the solitary braconid parasitoids Aphidius smithi, Ephedrus californicus and Praon pequodorum in pea aphids. F = fighting among first-instar larvae (LI); T = toxin released at eclosion of LI; V = venom injected by female at oviposition. Median times taken from eclosion to LI and LII refer to parasitoid larvae developing in second-instar pea aphids at 20 °C.
The ‘oldest larva advantage’ applies to some cases of interspecific larval competition among parasitoids but not to others (Mackauer, 1990; Tillman & Powell, 1992; de Moraes et al., 1999; de Moraes & Mescher, 2005; Harvey et al., 2009a, b, 2013a, b; Cingolani et al., 2013; Chen et al., 2019b, see below). Relative age differences can influence the outcome of an interaction, but the factors that appear to be more important in determining who survives are the particular competitive mechanism(s) and the developmental stage at which each comes into play. Bear in mind that: the eggs of two species may be laid at the same time, but hatch at different times, and/or the development rate of the larva may be greater in one species than in another, and these factors may determine the ‘window of interaction’. For example, the braconids Aphidius smithi and Praon pequodorum require approximately the same amount of time to develop from oviposition to the second instar, but the embryonic period is much shorter in Aphidius than in Praon. This difference enables Praon to compete as a mandibulate first-instar larva with an older Aphidius larva. Aphidius larvae usually survive only if they have reached the end of the fourth (final) instar while Praon is still in the embryonic stage and thus unable to attack an older competitor (Chow & Mackauer, 1984, 1985).
A parasitoid species that wins under most conditions is described as intrinsically superior (Zwölfer, 1971, 1979). Ectoparasitoids tend to be intrinsically superior to endoparasitoids (Petters & Stefanelli, 1983; Harvey et al., 2013a, b), but see Sullivan (1971) for one exception. The superiority of ectoparasitoids is a result of envenomation and/or more rapid destruction of the host, rather than a result of the endoparasitoid being attacked directly (Askew, 1971; Vinson & Iwantsch, 1980b).
Collier et al. (2002) tested the hypothesis that relative egg size can be used to predict the outcome of ‘intrinsic competition’ between closely related parasitoid species (Encarsia spp.): a species with relatively large eggs should be superior to one with small eggs. The hypothesis was not supported by the experimental evidence: the species with the smaller eggs (E. formosa) prevailed in competition, irrespective of the order of exposure (however, E. formosa females killed the progeny of its superior larval competitor by host-feeding).
An experiment designed to investigate the relative competitive superiority of solitary endoparasitoid larvae in instances of superparasitism would involve varying the time interval between ovipositions (from a few seconds to many hours), either by the same parasitoid species or females of different species. If heterospecific superparasitism is being studied, then the sequence of species ovipositions can be reversed. Whatever the type of interaction being investigated, by taking regular samples of the superparasitised hosts and singly parasitised hosts at successive points in time from the second oviposition and dissecting them, the following can be recorded:
-
1.
The stage of development (embryonic or larval) already reached by the older parasitoid at the time of the second oviposition (determine this from dissection of singly parasitised hosts);
-
2.
The stage of development subsequently reached;
-
3.
The stage of development of the younger parasitoid;
-
4.
Which, if any, of the eggs or larvae are dead or alive (exceptionally, both may be dead, as suggested by the data in Table 2.1);
-
5.
Any behavioural evidence of physical combat;
-
6.
Whether either of the parasitoid immatures bear wounds (the latter may show signs of melanisation [Salt, 1961]).
Threshold time intervals for the different outcomes of competition (if there can be more than one outcome) can then be found. Note that for some interactions, the period of time between oviposition and the development of the host to a certain stage indirectly determines which parasitoid species is the survivor. For example, in the case of Trieces tricarinatus and Triclistus yponomeutae, this interval determines the extent of development of the parasitoids after host pupation and the extent of development at the time of combat (irrespective of whether the host is singly or multiparasitised, development of larvae beyond the first instar can only take place after host pupation) (Dijkerman & Koenders, 1988).
Instead of dissecting superparasitised hosts, the outcome of competition can be studied by rearing the parasitoids to the adult stage. However, in studies of intraspecific superparasitism, this method requires that distinguishable (preferably morphologically) strains be used. This method would also prove useful for studying intraspecific superparasitism when the interval between ovipositions is so short that it is not possible, through dissection, to distinguish between the progeny of the first female and the progeny of the second female. For example, Visser et al. (1992) measured the pay-off from superparasitism in the solitary parasitoid Leptopilina heterotoma. They used two strains of this species: a wild type with black eyes and a mutant with yellow eyes. Hosts parasitised by females of one strain were exposed to females of the other strain and the interval between ovipositions was varied. The sequence of ovipositions was reversed to take account of any competitive asymmetry between strains. The probability of a second female realising an offspring from superparasitism, i.e., the pay-off, was then calculated for each strain.
Harvey et al. (1993) examined whether parasitoid mortality from superparasitism varies with host instar in cases of near-concurrent oviposition by two conspecific females (Venturia canescens). Parasitoids were reared from third- and fifth-instar hosts (the moth Plodia interpunctella) containing either one, two or four parasitoid eggs. Parasitoid mortality was found to be significantly higher in fifth-instar hosts than in third-instar hosts, but within instars did not vary with egg number (Fig. 2.61). The likely reason for the higher mortality in fifth-instar hosts is that there is some physiological incompatibility between the parasitoid and fifth-instar hosts associated with pupation (Harvey et al., 1993).

Source Harvey et al. (1993). Reproduced by permission of Blackwell Publishing
The effects of superparasitism on survival in the solitary ichneumonid parasitoid Venturia canescens: Mortality of parasitoids reared from a third-instar b fifth-instar hosts, containing one, two or four parasitoid eggs. Encapsulation was not a complicating factor in the experiments. Bars show 95% confidence limits for percentages.
Gregarious Parasitoids
In gregarious species where survival declines monotonically with increasing clutch size, the addition of an egg or clutch of eggs will (further) reduce percentage survival per host. The reduction will normally result from increased resource competition, since larvae of gregarious species do not engage in physical combat. In those species in which there is an Allee effect (Sect. 1.10), there will be a threshold number of progeny per host below which all parasitoids die, so superparasitism of a host containing a clutch of eggs that is a number short of this threshold number is likely to raise the survival chances of the parasitoid immatures.
Assuming competitive equivalence of first and second clutches laid in or on a host, the effect on survival of simultaneous oviposition by two females would be analogous to the effects of increasing the initial clutch size (Strand & Godfray, 1989). However, in gregarious species mortality may vary not only with the number of eggs initially present but also with the time interval between ovipositions, i.e., it will depend on how soon superparasitism occurs after the laying of the initial clutch (Strand, 1986). Strand and Godfray (1989) demonstrated this for Habrobracon hebetor. In this species progeny survival within a second egg clutch, equal in size to the first, was approximately 42% (each clutch comprising 20 eggs), 78% (each clutch comprising 10 eggs) and 83% (each clutch comprising four) when the first and second clutches were ‘laid’ simultaneously (they were placed on hosts by the experimenter, see below). However, when the time between ‘ovipositions’ was 12 h or more, progeny survival within the second clutch was reduced to less than 10% for clutches comprising either 10 or 20 eggs (Fig. 2.62).

Source Strand and Godfray (1989). Reproduced by permission of Springer Verlag
The relationship between progeny survival within first and second clutches of eggs, and the time between ‘ovipositions’ for starting clutches of a 4; b 10; c 20 eggs, in the gregarious parasitoid wasp, Habrobracon hebetor (Braconidae). First and second clutches were equal in size for each experiment.
Experiments aimed at investigating the mortality effects of superparasitism in a gregarious species can be conducted along the lines described in the section on superparasitism in relation to growth and development rates. Sex differences in survival may be examined in such experiments; several studies (Vinson & Iwantsch, 1980b) have shown that with increased larval crowding there is a tendency for preferential survival of males.
Superparasitism in egg parasitoids can be investigated using in vitro techniques (Strand & Vinson, 1985; Strand et al., 1986; Marris & Casperd, 1996); parasitoid eggs and larvae can be added to a volume of culture medium equivalent in volume to a host egg.
As noted in Chap. 1 (Sect. 1.9), the survival chances of parasitoid immatures can in some case be improved by superparasitism. For example, of eggs of Asobara tabida laid in larvae of Drosophila melanogaster, 1% survive in singly parasitised hosts whereas 7% survive in superparasitised hosts (van Alphen & Visser, 1990), encapsulation being the principal cause of mortality in both cases. Van Strien-van Liempt (1983) measured the survival of Asobara tabida and Leptopilina heterotoma in multiparasitised Drosophila hosts and compared these values with survival in singly parasitised hosts. Percentage survival in instances of multiparasitism was not always lower than survival in singly parasitised hosts; in most cases, multiparasitism provided a mutual survival advantage. In cases such as these where parasitoid survival is increased through superparasitism, the mechanism is thought to be exhaustion of the host’s supply of haemocytes (see Host Physiological Defence Reactions, for further discussion).
Compared with an Israeli strain, a Californian strain of the aphelinid Comperiella bifasciata was subject to a higher encapsulation rate in red scale and also superparasitised more hosts. Blumberg and Luck (1990) suggested that since the risk of encapsulation is reduced in superparasitised hosts (see also Sagarra et al., 2000a), the higher degree of superparasitism shown by the Californian strain is a strategy to avoid encapsulation.
For a study of intra- and interspecific larval interactions among a subweb of dipteran (specialist and generalist tachinid) and hymenopteran parasitoids, and their consequences for parasitoid survival, see Iwao and Ohsaki (1996). The mortality effects of superparasitism can be expressed as k-values (Sect. 7.3.4).
2.10.2.9 Host Physiological Defence Reactions
Introduction
Endoparasitoid larvae and eggs may die owing to a reaction of the host’s immune system. The term immune system is used in the loose sense that the hosts are capable of mounting a defensive response against foreign bodies. The response does not involve either a specific ‘memory’, with accelerated rejection of the second of two sets of an introduced foreign tissue, or a marked increase in the concentration of some specific humoral component, as has been shown for vertebrates. Thus, the probability of a parasitoid eliciting an immune response in an insect is independent of previous challenges (Boulétreau, 1986).
Host defence reactions are of several kinds (Strand & Pech, 1995; Carton & Nappi, 1997; Quicke, 1997; Fellowes & Hutcheson, 2001; Strand, 2008; Smilanich et al., 2009, for reviews), but the most commonly encountered type of reaction is encapsulation. Usually in encapsulation the foreign invader becomes surrounded by a multicellular sheath composed of the host’s haemocytes (Fig. 2.63). Successive layers of cells can often be discerned, and on the outer surface of the parasitoid egg or larva there often develops a necrotic layer of melanised cells, representing the remnants of the blood cells that initiated the encapsulation reaction. The melanin deposits on the surfaces of encapsulated parasitoid eggs and larvae often provide the first clue to the occurrence of encapsulation (Fig. 2.63a–c). Parasitoid immatures die probably from asphyxiation, although starvation may be the principal cause of death in some cases. Phagocytosis of parasitoid tissues gradually occurs, at least during the initial stages of encapsulation.

Source Salt (1970). Reproduced by permission of Cambridge University Press
Encapsulation and melanisation: a‒c encapsulated larvae and egg of Venturia canescens implanted in a non-host insect (deposits of melanin can be seen); d‒f deposits of melanin on eggs 24, 32 and 48 h after implantation in a non-host insect.
Parasitoids can resist, i.e., evade and/or supress the immune responses of their hosts (Quicke, 1997; Beckage, 1998a, b, 2008; Kraaijeveld et al., 1998; Fellowes & Hutcheson, 2001; Schmidt et al., 2001; Schmidt, 2008; Strand & Burke, 2014; Ye et al., 2018). One means of evasion is the laying of eggs in refuges from encapsulation. Some parasitoids oviposit into specific host organs such as the nerve ganglia and salivary glands, where an egg cannot be reached by the host’s haemocytes (Strickland, 1923; Salt, 1970; Rotheray, 1979; Dijkerman, 1988). Many early-instar parasitoid larvae, which are also potentially exposed to a host’s immune defences, migrate to specific regions of the host after they hatch from the egg (the first-instar larvae of many ichneumonids use their caudal appendage for this purpose) (Salt, 1968). In other parasitoids, the immature stages have surface properties that prevent encapsulation (Rotheram, 1967; Salt, 1968). The risk of encapsulation in a particular host species can be drastically increased by washing the surface of the parasitoid eggs using either solvents or water before they are artificially injected. Eggs of Venturia canescens removed from the ovarioles are encapsulated if they are artificially injected into the haemocoel of Anagasta, whereas eggs removed from the calyx region of the lateral oviduct do not become encapsulated. In some parasitoids the ovipositing female or her offspring are able to manipulate or disrupt the immune system (see reviews by Strand & Pech, 1995; Lavine & Beckage, 1996; Beckage, 1998a, b). Population genetic and dynamic aspects of encapsulation are discussed by Boulétreau (1986), Godfray and Hassell (1991), Kraaijeveld et al. (1998) and Fellowes and Godfray (2000); see also Chap. 3.
Encapsulation is usually studied in vivo in either laboratory-cultured or field-collected hosts. However, some workers have successfully used in vitro techniques (e.g., Ratner & Vinson, 1983; Benson, 1989; Lovallo et al., 2002).
Host Populations and Species
The ability of a host to encapsulate parasitoids is genetically determined (Chap. 3) and there may be considerable variability in encapsulation rate between populations of a host species (Boulétreau, 1986; Maund & Hsiao, 1991; Kraaijeveld & van Alphen, 1994, 1995a; Hufbauer, 2001; see also Dijkerman, 1990). For example, in Drosophila melanogaster there are clear differences between fly populations from different parts of the world with respect to the frequency with which Leptopilina boulardi is encapsulated (Boulétreau, 1986). Such effects are an important consideration when one is planning to release biological control agents (Maund & Hsiao, 1991).
The risk of encapsulation also varies between host species. The ability of a parasitoid species to avoid encapsulation may determine at least partly: the range of host species that it parasitises in nature, and also the different levels of successful parasitism recorded among these hosts (e.g., Heimpel et al., 2003). The relevance of this to classical biological control introductions is discussed by Alleyne and Wiedenmann (2001). Differential mortality in different host species due to encapsulation may have played an important role in the evolution of host specificity, including preferences, of many endoparasitoids. Dijkerman (1990) observed that the abundance of Diadegma armillata, a solitary endoparasitic ichneumonid, in the parasitoid complexes associated with Yponomeuta moths, varies among host species, being high in the complex associated with Y. evonymellus and very low in that associated with Y. cagnagellus. To determine whether this variation corresponds with the ability of each host species to encapsulate the parasitoid, Dijkerman (1990) used the following methods:
A. Parasitism experiments: Larvae of the different moth species were exposed to female D. armillata. Several days later, a sample of the hosts was taken and the insects dissected. The remaining hosts were maintained until the parasitoids emerged. By dissecting the hosts, the presence of parasitoid eggs or larvae was recorded, and the following noted:
-
1.
The rate of infestation, i.e., the number of host larvae containing at least one egg of D. armillata as a percentage of the total number of larvae dissected.
-
2.
Percentage encapsulation: [the number of encapsulated progeny divided by the total number of eggs found at dissection] × 100 (this measure of encapsulation efficiency might be less useful in cases where there is a high and variable degree of superparasitism among hosts, which was not the case in this study, see below).
By rearing hosts, the following were measured:
-
3.
The rate of successful parasitism: [the number of host individuals yielding D. armillata adults divided by the total number of Yponomeuta yielding moths or parasitoids] × 100;
-
4.
The percentage mortality of larvae: [the number of larvae dying during their development divided by the initial number of parasitoid larvae] × 100 (note that if the mean number of parasitoid eggs per parasitised host significantly exceeds 1.0, a correction factor will need to be applied to the data to allow for the effects of parasitoid mortality through superparasitism).
Simultaneously, under the same conditions, host larvae that were not exposed to parasitoids were reared to moth emergence. This was done to establish whether the results could be biased by a higher mortality of parasitised hosts, compared with unparasitised hosts, in rearings.
B. Dissections of field-collected late-instar, hosts: The following were recorded:
-
5.
Percentage encapsulation (see above); percentage of successful attacks (successful at the time of dissection, notwithstanding encapsulation later on), calculated as: [the number of parasitoid eggs or larvae recorded at dissection, divided by the total number of hosts dissected] × 100. To exclude the potentially confounding effects of time and place, comparisons were made only for samples collected at the same locality and same time of day.
Except for one species, Y. evonymellus, infestation rates and successful parasitism rates recorded in the laboratory were markedly different. In Y. mahalebellus and Y. plumbellus no wasps were reared despite infestation rates of 30% and 95%, whereas in Y. evonymellus almost all infested larvae yielded adult parasitoids. Since mortality of parasitised hosts was not different from that of control larvae, and the mean number of parasitoid eggs per parasitised host was little more than 1.0, the differences between infestation and successful parasitism could be explained in part by encapsulation. The field dissections revealed that Y. cagnagellus suffers fewer successful attacks than Y. evonymellus, despite being the more abundant species at some localities. The low successful parasitism in Y. cagnagellus corresponds with the very low probability of survival of D. armillata in that species. An interesting footnote to Dijkerman’s (1990) findings is the observation that all of the Yponomeuta species in which there was a high rate of encapsulation of D. armillata are considered to have diverged early in the evolution of the genus, whereas the more recently evolved moth species show either an intermediate rate of encapsulation or do not encapsulate eggs at all (Dijkerman, 1990).
An alternative approach was taken by Benson (1989), who used an in vitro technique. He tested the eggs of three aphidophagous ichneumonid species (Diplazontinae) against the haemolymph of a range of hover-fly species. The host ranges and preferences (including behavioural preferences) of each species were already well known, and this enabled rank orders of reaction to be predicted. Haemolymph from a host species was mixed with insect tissue culture fluid and an egg of a diplazontine was added. When 24 h had elapsed, the fluid was examined for changes in colour, the extent of the change, and the formation of a capsule. The predictions for each parasitoid species in different hosts and for each host species with different parasitoids were confirmed, strongly suggesting that differential host suitability has played a significant role in determining host specificity in diplazontine ichneumonids.
Heimpel et al. (2003) make a distinction between ‘suitable’ hosts, in which most or all parasitoid progeny can complete development, and ‘marginal’ hosts, in which a substantial fraction of host individuals is able to debilitate the immature parasitoids and survive, and point out that marginal hosts may act as a ‘sink’ for parasitoid eggs. The ecological significance of this effect was explored through modelling by Heimpel et al. (2003). Note, however, that ‘suitability’ was used by Heimpel et al. (2003) in a narrow sense for the purposes of their study; ‘suitability’ sensu lato (broad sense) encompasses constraints upon larval growth and survival, as well as upon survival.
Host Plant
The rate of encapsulation of a parasitoid in a particular host species may vary with the species of plant that the insect feeds on (Ben-Dov, 1972; Blumberg, 1991; Soussi and Le Ru, 1998, but see Blumberg et al., 1995). For example, the scale insect Protopulvinaria pyriformis encapsulates a larger percentage of eggs of Metaphycus stanleyi when grown on Hedera helix or Schefflera arboricola than when grown on avocado plants (Blumberg, 1991). Similarly, the mealybug Pseudococcus affinis encapsulates a higher proportion of the eggs of the encyrtid Anagyrus pseudococci when reared on Aeschynanthus ellipticus than when reared on Streptocarpus hybridus (Perera, 1990). Blumberg et al. (1995) did not find a host plant effect for Anagyrus pseudococci in their study.
Host Stage and Age
With many endoparasitoids the probability of encapsulation occurring increases with host stage or host age (Berberet, 1982; van Alphen & Vet, 1986; Slansky, 1986; Van Driesche, 1988; Dijkerman, 1990; Strand & Pech, 1995; Sagarra et al., 2000a). An explanation given by Salt (1968) for such a relationship is that earlier stages have fewer haemocytes available than later ones. Host stage does not affect the probability of encapsulation of Habrolepis rouxi (Encyrtidae) in its red scale hosts (Blumberg & DeBach, 1979). Note that insect eggs lack a cellular defence response to foreign bodies (Salt, 1968, 1970; Askew, 1971; Strand, 1986; Quicke, 1997).
Superparasitism
The reduction in encapsulation ability of a host with superparasitism has already been discussed. Askew (1968) drew attention to this phenomenon. Explanations given in the literature are that the host is ‘weakened’ or that its supply of haemocytes becomes exhausted as a result of the increased parasitoid load.
Temperature
In some parasitoid species, the temperature at which the host is reared does not affect the frequency at which encapsulation occurs (e.g., Habrolepis rouxi: Blumberg & DeBach, 1979; Aprostocetus ceroplastae: Ben-Dov, 1972; Anagyrus pseudococci: Blumberg et al., 1995; Aphidius spp.: Stacey & Fellowes, 2002), whereas in others it does (e.g., Apoanagyrus diversicornis: Van Driesche et al., 1986; Metaphycus stanleyi: Blumberg, 1991; see also Blumberg & Van Driesche, 2002). In A. diversicornis the rate of encapsulation is highest at the lower of two temperatures, whereas in M. stanleyi it is highest under high temperature regimes (Fig. 2.64). It follows that, for some species, there may be seasonal or geographical variations in encapsulation rate.

Source Blumberg (1991)
The relationship between the rate of encapsulation of eggs and mean temperature in Metaphycus stanleyi (Encyrtidae) parasitising the pyriform scale on: a Hedera helix, b Schefflera arboricola, under glasshouse conditions; c avocado in an orchard.

Source Mackauer (1983). Reproduced by permission of The Entomological Society of Canada
Age-specific fecundity and survival rates of Aphidius smithi provided with different densities of its host Acyrthosiphon pisum.
The Costs of Counterdefences to Host Resistance
While significant insights have been gained into the costs, to the host, of physiological resistance to parasitoid immatures (Fellowes & Hutcheson, 2001, provide a review), little is known about the costs of counterdefence in parasitoids. Kraaijeveld et al. (2001) sought evidence for the costs of counterdefence by Asobara tabida against Drosophila (see their paper for a protocol which involved artificially selecting populations); the only cost they could detect was the delay in hatching of the eggs (which results from them being embedded in host tissue, a defence against host haemocytes); this delay will, Kraaijeveld et al. (2001) conclude, reduce the chances of parasitoid survival if another parasitoid egg is laid in the same host. No cost was recorded in terms of either mean adult size, fat content or egg load of A. tabida.
2.10.3 Effects of Physical Factors on Survival of Immatures
2.10.3.1 Temperature
Parasitoids may be more hot or cold hardy than their hosts, in which case the lethal range of temperatures for the host will determine parasitoid survival. Prolonged exposure to extreme temperatures will kill the host first, and the parasitoid will then die as a result of starvation, anoxia or host putrefaction. Prior to death, a parasitoid’s growth and development may be increased or decreased by the extreme temperature (Tingle & Copland, 1988).
On the other hand, parasitoids may be less hot or cold hardy than their hosts, such that they cannot tolerate the extremes of temperature that the host can tolerate, and so die as result of thermal stress. Parasitised hosts may theoretically even seek out warmer than optimal sites, raising their body temperature with the potential result that the parasitoid is killed (‘behavioural fever’) (Karban, 1998; see Elliot et al., 2002, and Ouedraogo et al., 2003 on behavioural fever employed by locusts to suppress fungal pathogen infection).
Within the range of temperatures that are not immediately lethal to predator larvae, the lower the temperature, the longer totally starved larvae will be able to survive, and, in the case of larvae that have prey available, the less food larvae will require to stay alive (Lawton et al., 1980). Kfir and van Hamburg (1988) have shown that the outcome of heterospecific superparasitism can be influenced by temperature. The influence of temperature on the host’s ability to encapsulate parasitoids is discussed in the previous section.
2.10.3.2 Humidity
Low humidity can cause death of ectoparasitoid and predator larvae directly through desiccation (as with adults, small-bodied insects will be more prone to desiccation, all else being equal, due to their higher surface area to volume ratio), whereas high humidity can cause death indirectly by encouraging the growth of fungal pathogens.
2.10.3.3 Photoperiod
Photoperiod, because of its influence upon diurnal activity and therefore consumption rate, could affect survival of larval predators. Urbaneja et al. (2001a) found no evidence for an effect of photoperiod on survival in the parasitoid Cirrospilus sp. near lyncus (Eulophidae).
2.11 Intrinsic Rate of Natural Increase
2.11.1 Introduction
The parameter known as the ‘intrinsic rate of natural increase’ describes the growth potential of a population under a given set of environmental conditions. It is often used, both by ecologists (Gaston, 1988) and by biological control workers (Messenger, 1964b), as a comparative statistic. In a biological control programme, practitioners may be faced with a choice of candidate parasitoid species; in the absence of other criteria they would select, for obvious reasons, the species with the greatest value for the intrinsic rate of natural increase (Chap. 7).
This population growth parameter is calculated, as described below, from age-specific survival and fecundity schedules. To understand first what it represents, we need to consider the most general of all population growth models, the exponential equation:
where N is the number of individuals in the population at any given time t, and r is the intrinsic rate of natural increase or the instantaneous per capita change in population size. Under conditions of an unlimited environment and with a stable age distribution, r is a constant.
For a given species, r can take a number of values. In theory at least, the species has an optimal natural environment in which its r will attain the maximum possible value, rm, with a stable age distribution.
2.11.2 Calculating rm for a Parasitoid Wasp Species
Rm is calculated by iteratively solving the following equation:
where x is the mid-point of age intervals in days, lx is the fraction of the females surviving to the pivotal age x (or, put another way, the probability of a female surviving to age x), mx is the mean number of female ‘births’ during age interval x per female aged x, and e is the base of natural logarithms. Trial rm values are substituted into the above expression until the left-hand side is (arbitrarily) close to 1.
lx and mx are calculated by tabulating (Table 2.2) age-specific fecundity and age-specific survival data obtained from cohort fecundity and survival experiments (Sects. 2.7.2 and 2.8.1 discuss the experiments; a graphical display of such data is given in Fig. 2.65). If we find from examination of the life-table that only 50% of wasps survive to the age of 5 days, then l5 = 0.5. If we find that the average number of female offspring produced per individual alive during the age interval x is 25, then m25 = 25 (see caption to Table 2.2, for calculations based on another data set). The mean time taken from oviposition to adult eclosion, which can be measured in a separate experiment, is added to the pivotal age of each female. For example, this time period was 12.5 days for Aphidius smithi at 20.5 °C (Mackauer, 1983). Parasitoid mortality during the immature stages also needs to be measured. In A. smithi this mortality was negligible, so the probability of being alive at pivotal age 12.5 days + 1 day was set equal to 1.0 for all females (Mackauer, 1983). In Aphidius sonchi the time from oviposition to adult eclosion was 11.3 days and mortality of immatures was 8.0%, so the probability of being alive at pivotal age 11.3 days + 1 day was set equal to 0.92 (Liu, 1985b).
Once the values for lx and mx are calculated, then the following population statistics can also be calculated (Messenger, 1964b):
-
1.
The gross reproductive rate, GRR = ∑mx (the mean total number of eggs produced by females over their lifetimes, measured in females/female/generation);
-
2.
The net reproductive rate, or ‘basic reproductive rate’ (the number of times a population will multiply per generation) Ro = ∑lxmx (measured in females/female/generation);
-
3.
The finite capacity for increase, \(\lambda = e^{{r_{m} }}\) (the number of times the population will multiply itself per unit of time; measured in females/female/day);
-
4.
The mean generation time, (T = (loge Ro)/rm (measured in days);
-
5.
The doubling time (DT = loge 2/rm (the time, measured in days, required for a given population to double its numbers).
Using the data in Table 2.2, rc = 0.289, rm = 0.296, GRR = 108, Ro = 71.2, λ = 1.344, Tc = 14.74 (see below for explanation of rc and Tc), T = 14.41, DT = 2.24. Statistical and computational aspects of the estimation of rm are discussed by Maia et al. (2000). These authors also provide an SAS program that uses the jackknife technique.
rm can be measured (in female/female/day) for each of a range of host densities. It increases with increasing host density (Mackauer, 1983; Liu, 1985b). In Aphidius smithi this increase is also reflected in λ and also DT, which was less than half as long at the highest than at the lowest host density (Mackauer, 1983). Because in both A. smithi and A. sonchi the ovipositional pattern and the pattern of survival were similar to one another at the different densities (Fig. 2.65), host density showed no significant effect on T.
To obtain a true measure of the influence of host density on the parasitoid’s population statistics, some authors have based the mx values on the number of hosts actually parasitised (‘effective eggs’ of Messenger, 1964b). This takes account of superparasitism; thus the number of hosts parasitised can be assumed to equal the number of progeny eventually produced (ignoring cases where no parasitoid progeny succeeds in developing in a parasitised host).
Another factor that needs to be taken into account is the sex ratio of the progeny. This can be achieved by multiplying all mx values in the life-table by the overall population sex ratio, P, which is the proportion of females in all offspring produced. Regression of rm on the natural logarithm of host density for different values of the sex ratio gives a series of parallel lines (Mackauer, 1983; Liu, 1985b; Tripathi & Singh, 1991) (Fig. 2.66 shows regressions obtained for Aphidius smithi). The variation in rm as a function both of the parasitoid’s sex ratio and of host density can be shown as a response surface (Fig. 2.67 shows the response surface for Aphidius sonchi) (Mackauer, 1983, gives details of the statistical procedure involved in obtaining the response surface). As can be seen from Fig. 2.67, rm increases as either host density or sex ratio increases, and at a given value of P the rate of increase in rm slows at higher host densities. In A. sonchi the deceleration in rm at high densities is such that the percentage increase in host density required to obtain a given percentage increase in rm is constant. For example, at P = 0.70, a 20% increase in rm from 0.25 to 0.30 requires an increase in host density from 15 to 39 per day, i.e., 24 hosts, while a 20% increase in rm from 0.30 to 0.36 requires an increase in host density from 39 to 101 per day, i.e., 62 hosts. This rule applies over the whole range of 0 ≤ P ≤ 1.0, although the required increment in host density increases in absolute terms as the value of P declines. When P = 0.40, an increase of 48 hosts, from 30 to 78 per day, is required to obtain a 20% increase in rm from 0.25 to 0.30.

Source Mackauer (1983). Reproduced by permission of The Entomological Society of Canada
The relationship between the intrinsic rate of natural increase (rm) of Aphidius smithi (Braconidae) and natural logarithm of host density, for different overall sex ratios.

Source Liu (1985b)
Response surface showing lines of equal rm for Aphidius sonchi (Braconidae) for different host densities and parasitoid sex ratios (P, proportion of females). The broken line indicates a sex ratio of P = 0.7 observed in the laboratory.
The rm of Hyperomyzus lactucae, the host of A. sonchi, is 0.3375. For a P value of 0.7, which is the sex ratio for A. sonchi in laboratory cultures, the parasitoid will achieve an rm of 0.3378 at a host density of 74/day (preferably, the field sex ratio should be used in this computation, Mackauer, 1983). If the host density is increased to 200 per day, a sex ratio as low as 0.3 will yield an rm value of 0.3367, which is again close to that of the host.
Assuming an absence of superparasitism (which is typically higher at low densities), the parasitoid’s realised mx will be equal to its oviposition rate, so yielding values of rm higher than those computed. The minimum host density required to eliminate egg wastage through superparasitism can be determined. Theoretically, at that density the parasitoid’s rm will reach a maximum value that can be computed by setting mx equal to the daily totals of eggs laid at the highest oviposition rate (Mackauer, 1983, gives details of the statistical procedure involved).
Knowing how rm varies in relation to factors such as host density (see above) and temperature (see below) can help biological control practitioners in deciding on the timing of introduction, for example in an inoculative release programme.
Equation 2.20 is not very ‘transparent’, that is, it is not particularly useful for any broad consideration of the relation between rm and ‘synoptic’ life-history parameters such as generation times (Laughlin, 1965; May, 1976). A more useful statistic is rc, the capacity for increase, which is an approximation for rm. It is calculated as follows:
where Tc is the cohort generation time, defined as the mean age of maternal parents in the cohort at birth of female offspring (Laughlin, 1965; May, 1976) (for a discussion of the relationship between T and Tc, see May, 1976):
Equation 2.21 is based on the assumption that the reproductive period is brief relative to the total life-cycle, which results in a small error in the estimation of generation time. rc is a good approximation for rm when Ro and thus population size remains approximately constant, or when there is little variation in generation length, or for some combination of these two factors (May, 1976).
A relatively simple method for calculating values for rc was developed by Livdahl and Sugihara (1984). It dispenses with the need to construct detailed survivorship and fecundity schedules, and uses indirect estimates of Ro and Tc. It assumes the organisms being studied to have a Type III survivorship curve for the whole life-cycle, with high larval mortality and negligible adult mortality through the reproductive period; this assumption is only partly satisfied in the case of parasitoids, since in the laboratory there is likely to be low larval mortality while in the field there is likely, in many species, to be high mortality of females during the reproductive period. To use Livdahl and Sugihara’s (1984) method, one only needs to observe cohorts during the maturation period in order to obtain measurements of the number of newly emerged adult females and their average size.
2.11.3 Effects of Host or Prey Species and Stage
Host stage and species, through their effects on body size in parasitoids, influence life-history variables such as fecundity and longevity, so they would be expected to affect rm and rc. This is indeed the case: see Cloutier et al. (2000) on rm in Aphidius nigripes, and Yu et al. (1990) on rc in Encarsia perniciosi. In both species, the intrinsic rate of natural increase/capacity for increase was higher in larger hosts.
Prey species can also be expected to influence the intrinsic rate of natural increase of predators, as has been confirmed, for example, by Venzon et al. (2002) for the bug Orius laevigatus and Fathi (2009) for Orius niger and O. minutus.
2.11.4 Effects of Temperature
Since larval development rate, female survival and female fecundity vary with temperature (Sects. 2.7.3, 2.9.3 and 2.8.4) we would expect rm to vary also, which is the case. Figure 2.68 shows how rm varies with temperature in three species of parasitoid and their aphid host (Force & Messenger, 1964).

Source Force and Messenger (1964). Reproduced by permission of The Ecological Society of America
Comparison of intrinsic rate of natural increase (rm) of the aphid parasitoids Praon palitans, Trioxys utilis (Braconidae), Aphelinus semiflavus (Aphelinidae) and their aphid host, Therioaphis maculata, over a range of constant temperatures.
For examples of other studies, see Geusen-Pfister (1987) (Episyrphus balteatus), Cave and Gaylor (1989) (Telenomus reynoldsi), Lohr et al. (1989) (Apoanagyrus lopezi), Smith and Rutz (1987) (Urolepis rufipes), Mendel et al. (1987) (Anastatus semiflavidis), Miura (1990) (Gonatocerus cinticipitis), Cocuzza et al. (1997b) (Orius spp.), Urbaneja et al. (2001b) (Cirrospilus sp.), Ren et al. (2002) (Nephaspis oculatus), Seal et al. (2002) (Catolaccus hunteri), Roy et al. (2003) (Stethorus punctillum), Pakyari et al. (2011) (Scolothrips longicornis) and Souna et al. (2021) (Therophilus javanus).
Siddiqui et al. (1973) provide a model to describe the relationship of 1/rm to temperature. Using data for Aphidius matricariae, one of us (M.J.W. Copland) found the model to provide a good fit to the data over part of the temperature range only. A simple polynomial model could express the relationship much more accurately.
2.12 Dormancy
2.12.1 Introduction
Life-cycles in most insects are characterised by profound season-related changes in growth, developmental and reproductive characteristics. Different species possess unique sets of ecophysiological responses that regulate seasonal cycles, facilitating temporal synchrony with seasonal variations in the availability and state of biotic and abiotic factors in their habitat (Tauber et al., 1986, 1994). Understanding seasonal changes in the growth, development and reproduction of insect natural enemies is also an important tool in applied ecology. In particular, it is necessary to investigate the degree of synchrony between generations of pests and beneficial insects in order to determine the best strategies for successfully mass-rearing, storing and releasing biological control agents (van Lenteren, 1986; Chang et al., 1996; Ringel et al., 1998; Chap. 7). This is particularly true for parasitoids, most of which have very limited host ranges (Askew, 1971; Godfray, 1994; Quicke, 1997) and are therefore closely synchronised with successive generations of their hosts.
Particularly in temperate environments, insects enter a dormant state during unfavourable periods e.g., winter. Dormancy in insects occurs in a number of ways that differ both physiologically and ecologically. Types of dormancy are generally classified according to whether they are obligate and/or seasonally recurring (diapause and aestivation) or facultative in nature, occurring in direct response to certain stimuli (quiescence). Dormancy has been frequently reported among predators and parasitoids, where examples occur in all stages of development. Investigations of dormancy involving parasitoids are potentially much more complicated than in predatory insects, because host‒parasitoid interactions occur over three, rather than two trophic levels. Furthermore, parasitoids are generally much more specific in their choice of hosts than predators are with their prey (Chaps. 1 and 6). Factors which stimulate the onset of diapause, aestivation or quiescence in parasitoids may be perceived directly by the natural enemy or indirectly in response to physiological cues released by the host. The dynamic effects and evolution of diapause in coupled parasitoid‒host systems have been explored by Ringel et al. (1998) using theoretical modelling.
2.12.1.1 ‘Obligate’ or ‘Predictive’ Dormancy: Diapause and Aestivation
Predictive dormancy is initiated in advance of adverse conditions, and most commonly occurs in response to predictable changes in seasonal environments (Müller, 1970). Two types of predictive dormancy have been described: diapause (during winter) and aestivation, or summer diapause (during summer). Tauber et al. (1986) define diapause as a neurohormonally mediated dynamic state of low metabolic activity associated with reduced morphogenesis, increased resistance to environmental extremes, and altered or reduced behavioural activity. Diapause occurs during a genetically determined state of metamorphosis and generally in response to token environmental cues that precede the unfavourable condition.
The important point to bear in mind is that diapause-inducing stimuli are ‘registered’ commonly before the diapausing stage is reached. Diapause occurs in response to changes in, and interactions between, various biotic and abiotic factors, including photoperiod, temperature, humidity, and prey or host availability. Diapause termination also requires specific environmental conditions (Tauber et al., 1993).
2.12.1.2 ‘Facultative’ or ‘Consequential’ Dormancy: Quiescence
Quiescence is a reversible state of suppressed metabolic activity that occurs in response to environmental stimuli but does not involve preparatory hormonal or physiological changes in anticipation of environmental conditions. In many cases, timing and duration of quiescence are not fixed seasonally, but are highly variable and may last for many months or even years. The breaking of quiescence may require some kind of stimulation, signifying that the environment is favorable for development or activity.
Identifying, for a particular natural enemy, the nature of its dormancy, and establishing which biotic and physical factors play a role in its initiation, maintenance and termination, determining how these factors interact, and establishing which of the insect’s life-stages are sensitive to predictive dormancy-inducing factors, can be very difficult, involving in some cases complex multifactorial experimental designs. Often, knowledge of the dormancy characteristics of related species can be helpful in simplifying experiments; for example, it can help in narrowing down the list of candidate abiotic factors. We do not provide detailed advice on protocols here (for such information see Leather et al., 1993); instead, we provide a brief overview of diapause-inducing factors, supplemented with a few snippets of practical information.
2.12.2 Effects of Biotic Factors on Dormancy
2.12.2.1 Prey Availability and Quality (Predators)
Seasonal variation in the availability of prey has been reported to have a marked influence on the incidence of dormancy in predators. Aestivation in Coccinella septempunctata is stimulated by availability of suitable prey, as well as by other factors (Kawauchi, 1985; Zaslavsky & Vagina, 1996). Polymorphic seasonal cycles in the lacewing, Chrysoperla carnea, are similarly influenced by the abundance of prey (Tauber et al., 1986). In some predator species diapause incidence appears to depend on the type or the quality of the diet fed upon (Horton et al., 1998). Since prey availability is, in many predators, likely to be linked to various biotic factors, it is important to try and devise an experimental design that enables the effects of the various factors to be disentangled (and interaction effects tested for), although this may be difficult or even impossible in many cases.
2.12.2.2 Host Physiology (Parasitoids)
Many parasitoids oviposit in nutritionally suboptimal early host stages, and their larvae exhibit developmental arrest, completing their development only after the host has moulted to the penultimate or even final instar (Vinson & Iwantsch, 1980a; Harvey et al., 1994, 1999). Developmental delays are adaptive in a number of respects. First, they reduce the selection pressure for a fixed maternal response at oviposition by allowing female parasitoids to attack a wide range of host stages rather than a single one (Cloutier et al., 1991). Second, they ensure that the host reaches a critical size and physiological condition in which the parasitoid can complete its development (Hemerik & Harvey, 1999). Finally, they synchronise parasitoid and host generations intra- and interseasonally. There remains debate as to whether developmental delays are a form of diapause or of quiescence (Lees, 1955; Mellini, 1972; Godfray, 1994). Tauber et al. (1983) argue that host-mediated developmental arrest in the first-instar parasitoid larva is a form of obligate diapause because it shares many characteristics associated with the diapause syndrome (see their paper, and also Doutt et al., 1976).
Parasitoid larvae may also enter diapause in response to dormancy-related physiological changes in the host. For example, Polgar et al. (1991) and Christiansen-Weniger and Hardie (1997, 1999) examined factors influencing diapause induction in several braconid endoparasitoids attacking different morphotypes of their common aphid hosts (see also Polgar & Hardie, 2000). Parasitoids tended to enter diapause more in sexual hosts (oviparae) which occur in late summer, than in asexual hosts (virginoparae) which occur earlier in the season. Diapause appeared to be initiated mostly by hormonal differences between different aphid morphs. Diapause in idiobiont parasitoids has been reported to be influenced by the diapause status of their host in some associations (McNeil & Rabb, 1973; Strand, 1986), but not in others (Mackay & Kring, 1998).
The incidence of diapause among parasitoid progeny can vary with host species (Kraaijeveld & van Alphen, 1995b).
2.12.3 Effect of Physical Factors on Dormancy
2.12.3.1 Photoperiod
Insect natural enemies, like other insects, are very sensitive to the duration and intensity of light exposure. In temperate regions, photoperiod is a major factor controlling diapause initiation, maintenance and termination in insects (Tauber et al., 1983, 1986). Danilevskii (1965) defined the ‘critical photoperiod’ as that which elicits a >50% response amongst individuals in a population.
Many heteropteran bugs overwinter in a state of reproductive diapause as adults, and typically diapause is induced by the photoperiod during nymphal development, although the adult stage may also be sensitive (Yeargan & Barney, 1996; Ruberson et al., 2000). The multivoltine coccinnellid Coccinella septempunctata, which is widely distributed over much of the Palearctic, undergoes aestivation as first-generation adults, from April to August, in response to increasing day length (Sakurai et al., 1986; Katsoyannos et al., 1997) (this is immediately followed by a variable period of quiescence during winter). Photoperiod is also reported to be an important diapause-inducing stimulus for odonates (Norling, 1971; Pritchard, 1989).
In parasitoids, many studies have reported a key role for photoperiodic induction of dormancy (reviewed by Askew, 1971; Tauber et al., 1983; Godfray, 1994; Quicke, 1997). Field sampling of hosts is a useful starting point for gathering tentative evidence of the role of photoperiod in diapause induction in bivoltine endoparasitoids (Jervis, 1980).
2.12.3.2 Temperature
Temperature is another important diapause-inducing stimulus for predators. In coccinellids, diapause may be stimulated by seasonal exposure to low temperatures (Kawauchi, 1985) or be due to an interaction of temperature and photoperiod (Ongagna & Iperti, 1994). The coccinellid Rhyzobius forestieri does not enter diapause, but the application of a cold shock at 8 °C induces quiescence which can persist for several months if this condition is maintained (Katsoyannos, 1984).
In parasitoids, most studies have shown that temperature interacts with photoperiod in stimulating diapause induction (Brodeur & McNeil, 1989; Pivnick, 1993; Polgar et al., 1995), although some parasitoids may enter diapause in response to temperature alone (Wang & Laing, 1989). Temperature is also an important determinant in the breaking of diapause: for some species it may need to be low (amateur entomologists are well acquainted with the technique of ‘chilling’ insect pupae, in a refrigerator, for several weeks during the winter, before exposing them to warm indoor temperatures, to achieve a pre- or early-spring emergence of adults), whereas in others it may need to be high (e.g., Hodek & Hodková, 1988; van den Meiracker, 1994; Ishii et al., 2000).
To create more natural conditions in dormancy experiments, insects can be reared under gradually increasing temperatures (to stimulate the onset of summer aestivation) or gradually decreasing temperatures (to stimulate the onset of winter diapause).
The threshold temperature and the thermal constant (Sect. 2.9.3) for postdiapause development can be estimated for a parasitoid or predator (e.g., Trimble et al., 1990).
2.12.3.3 Moisture
Among the physical factors influencing dormancy in insects, the effects of moisture and/or humidity are the most poorly understood and least studied. This is principally because the vast majority of phenological studies have been performed in the temperate zones, where photoperiod and temperature are considered, a priori, to play major roles. Evidence is accruing that moisture plays a vital role in the maintenance of dormancy in a range of predatory insects. For example, soil moisture, acting independently or in combination with photoperiod and temperature has been shown to influence rates of development or activity (Jayanth & Bali, 1993; Bell, 1994; Bethke & Redak, 1996; Sanon et al., 1998; Nahrung & Merritt, 1999; see also review by Tauber et al., 1998).
2.12.4 The Fitness Costs of Dormancy
This is a little explored area of insect natural enemy biology. Chang et al. (1996) revealed that post-diapause adults of the lacewing, Chrysoperla carnea experienced higher reproductive success than individuals which had overwintered in a state of quiescence. Moreover, first-generation offspring of parents that had overwintered in diapause developed more rapidly and survived better than individuals whose parents had experienced quiescence. Ellers and van Alphen (2002) showed that in Asobara tabida an increase in diapause length led to higher mortality among diapausing pupae, together with decreases in egg load, fat reserves and dry weight of emerging adult females. See also Anderson (1962), on Anthocoris nemorum, and Leather et al. (1993) for a discussion of the costs of overwintering among insects generally.
2.13 Investigating Physiological Resource Allocation and Dynamics
2.13.1 Introduction
This section is concerned with techniques used to study both: (1) the optimal strategy for the allocation, within the adult stage of parasitoids or predators, of carried-over physiological resources, i.e., those derived from the immature phase of the life-cycle; and (2) quantitative changes in these resources during adult life, in relation to variation in environmental factors such as food availability and quality, and host/prey abundance.
2.13.2 Patterns in Resource Allocation
Intra- and interspecific differences in the pattern of resource allocation are of considerable interest, as they help ecologists and evolutionary biologists to understand why individuals and species differ in terms of key life-history traits. Negative correlations between the amounts of resources serving different life-history functions such as egg production and survival are particularly intriguing, as they imply the existence of trade-offs, and as such are evidence that life-histories are compromises. An associated goal of ecologists is to understand the integration of suites of life-history traits, and as is becoming apparent from the literature, studying patterns of resource allocation is the way forward in this quest.
Testable hypotheses relating to resource allocation include the following:
-
1.
All else being equal, species whose females are longer-lived and which have higher resource intake prospects should invest more in building a ‘sturdy body’ or ‘soma’ (musculature and exoskeleton) at the expense of ‘abdominal reserves’ (principally reproductive organs and their contents i.e., eggs, together with fat body) (Boggs, 1981). Empirical support for Boggs’ hypothesis comes from her study of three species of heliconiine butterflies (Boggs, 1981; see also Karlsson & Wickman, 1989; Wickman & Karlsson, 1989).
-
2.
Among abdominal ‘reserves’ there will be a trade-off between those resources allocated to initial egg production and those allocated to survival (fat body and other reserves). This is predicted by general life-history, on the basis of between-function competition for limited resources (Bell & Koufopanou, 1986; van Noordwijk & de Jong, 1986; Smith, 1991; Segoli & Wajnberg, 2020). Empirical support for this hypothesis comes from the known differential allocation of carried-over larval resources to fat body storage and initial egg load in the parasitoid wasp Asobara tabida (Ellers & van Alphen, 1997).
-
3.
As body size increases in parasitoid wasps, the total amount of ‘abdominal reserves’ increases, and allocation to both initial eggs (initial egg load) and stored reserves increases, but the increase in allocation to initial eggs is proportionately smaller than the increase in allocation to initial reserves. For an explanation of the adaptive significance of these relationships, and how they relate to ovigeny index, see Ellers and Jervis (2003).
-
4.
Smaller parasitoid wasp individuals suffer disproportionately, in terms of survival, the costs of not feeding, because they emerge with smaller initial reserves. This is supported by Rivero and West’s (2002) study of Nasonia vitripennis (Sect. 2.8.3).
-
5.
Solitary parasitoid species should allocate relatively more resources to survival (as fat reserves) than gregarious species (Pexton & Mayhew, 2002; the hypothesis is based on optimal allocation theory, e.g., Roff, 2002). This was supported by Pexton and Mayhew’s study of two Aphaereta species.
-
6.
Mothers should reduce egg provisioning with age (Begon & Parker, 1986; Roff, 2002). This is supported by Giron and Casas’s (2003b) study of Eupelmus vuilletti.
2.13.3 Resource Dynamics
Quantitative changes in resources will occur during adult life, in relation to environmental factors such as extrinsic nutrient availability and quality, and host or prey availability. Behavioural ecologists in particular are interested in these changes because they know foraging decisions to be physiologically state dependent (Chap. 1), and they appreciate that foraging, mating behaviour and other activities (including dispersal) are constrained by nutrient (intrinsic and extrinsic) supply. Hypotheses relating to resource dynamics in insect natural enemies have been tested by Ellers et al. (1998, 2001), Olson et al. (2000), Rivero and West (2002), Ellers and van Alphen (2002), Giron and Casas (2003a) and Casas et al. (2003) (parasitoids), and Otronen (1995) (the predatory fly, Scathophaga stercoraria) (see also Legaspi et al., 1996, on the predatory bug Podisus maculiventris).
2.13.4 The Techniques
Measuring Allocation, Among the Total Carried-over Resources, to ‘Soma’ and ‘Abdominal Reserves’
This can be done by measuring the dry weight, the total nitrogen content, and the total carbon content of: (1) the head + thorax + legs + wings (collectively ‘soma’, sensu Boggs, 1981); and (2) the abdomen (‘abdominal reserves’ resource pool, sensu Boggs, 1981).
The total amount of nitrogen in each body region can be measured using Kjeldahl digestion and subsequent Nesslerization (Minari & Zilversmit, 1963), while the total amount of carbon can be measured using bomb calorimetry. Better still is elemental analysis using a CHN analyser.
Measuring Allocation, Among ‘Abdominal Reserves’, to Initial Egg Production and Survival, and Studying Resource Dynamics
Measuring resource allocation to initial egg production, and also the subsequent qualitative and quantitative changes that occur in reproductive tissues, can be determined using modifications of well-proven techniques (van Handel, 1984, 1985a, b; van Handel & Day, 1988; Olson et al., 2000). Except in the case of small-bodied species (in which case separate individuals would have to be used), ovary protein content can be determined for one ovary, and both lipid and glycogen content determined for the other ovary. The Bradford dye-binding colorimetric micro-assay (Bradford, 1976) can be used for protein measurement, and lipid and glycogen measurement can be done using modifications of colorimetric techniques (vanillin reaction and chemical precipitation followed by hot anthrone reaction, van Handel, 1985a, b; van Handel & Day, 1988).
Measuring allocation to energy reserves, and also measuring alterations in the amounts of these resources, would involve measuring the quantities of lipid, glycogen, and stored sugars in the ovary-less abdomen (this would include haemolymph). Lipid and glycogen content can be measured as for the ovaries (see above); an alternative method of lipid measurement is ether extraction (Ellers, 1996; Ellers & van Alphen, 1997, 2002; Eijs et al., 1998). Stored sugar content can be measured using the hot anthrone reaction (Olson et al., 2000; Fadamiro & Heimpel, 2001).
The strategy of allocation from among the pool of ‘abdominal reserves’ could be influenced by: (1) nutrient intake prospects (Chap. 8); (2) egg resorption capability (Sect. 2.3.4); (3) thoracic musculature resorption capability (Kaitala, 1988, and Kaitala & Huldén, 1990, for an example of flight muscle resorption in water-striders, and see Kobayashi & Ishikawa, 1993, for histological methodology); or (d) combinations of these (Jervis & Kidd, 1986). Unless it is already one of the variables under consideration, body mass will need to be included as a covariable in data analyses. Phylogeny-based statistical methods (Sect. 1.2.3) should be employed in the case of interspecific comparisons.
If one is interested in knowing the total level of energy reserves within an insect, these can be calculated by adding the energy content of carbohydrate to that of lipids, assuming 16.74 J per milligram of carbohydrate and 37.65 J per milligram of lipid (Casas et al., 2003).
By studying carbohydrate and lipid dynamics in both field and laboratory experimental populations (freshly emerged, starved to death, fed ad libitum, partially starved), Casas et al. (2003) were able to show that Venturia canescens females are able to maintain a nearly constant level of energy over an extended foraging period, that they take sugars in the field, and also that lipid reserves may be limiting as lipogenesis does not occur in adults even under conditions of high sugar availability (all parasitoid wasps studied so far are unable to synthesise lipids from sugars in significant quantities, see Giron & Casas, 2003a).
2.14 Tracking Resources
Radiotracer studies, which have been applied to other insects (e.g., Boggs, 1997b, on Lepidoptera), are now being used to study the utilisation of extrinsic nutrients by parasitoid wasps (Rivero & Casas, 1999; Giron et al., 2002; Giron & Casas, 2003a). Rivero and Casas (1999) fed females of Dinarmus basalis on an artificial diet comprising a sugar + radiolabelled (3H) amino acid solution. The liquid food was supplied in a capillary tube, and the weight of females was compared before and after feeding, so allowing the amount of radioactivity both in the insects themselves and in the eggs they laid to be related to the amount of food ingested. It was found that the maximum incorporation, into eggs, of labelled nutrients obtained via a discrete feeding event occurred with a short period of time. However, it was also found that a large proportion of the nutrient input is stored and used gradually throughout the life of the parasitoid.
References
Abdi, M. K., Jucker, C., de Marchi, B., Hardy, I. C. W., & Lupi, D. (2021). Performance of Sclerodermus brevicornis, a parasitoid of invasive longhorn beetles, when reared on rice moth larvae. Entomologia Experimentalis et Applicata, 169, 64–78.
Ables, J. R., Shepard, M., & Holman, J. R. (1976). Development of the parasitoids Spalangia endius and Muscidifurax raptor in relation to constant and variable temperature: Simulation and validation. Environmental Entomology, 5, 329–332.
Agarwala, B. K., & Dixon, A. F. G. (1992). Laboratory study of cannibalism and interspecific predation in ladybirds. Ecological Entomology, 17, 303–309.
Aksit, T., Cakmak, I., & Ozer, G. (2007). Effect of temperature and photoperiod on development and fecundity of an acarophagous ladybird beetle, Stethorus gilvifrons. Phytoparasitica, 35, 357–366.
Albuquerque, G. S., Tauber, M. J., & Tauber, C. A. (1997). Life-history adaptations and reproductive costs associated with specialization in predacious insects. Journal of Animal Ecology, 66, 307–317.
Alleyne, M., & Wiedenmann, R. N. (2001). Encapsulation and hemocyte numbers in three lepidopteran stemborers parasitized by Cotesia flavipes-complex endoparasitoids. Entomologia Experimentalis et Applicata, 100, 279–293.
Allsopp, P. C. (1981). Development, longevity and fecundity of the false wireworms Pterohelaeus darlingensis and P. alternatus (Coleoptera: Tenebrionidae). 1. Effect of constant temperature. Australian Journal of Zoology, 29, 605–619.
van Alphen, J. J. M., & Vet, L. E. M. (1986). An evolutionary approach to host finding and selection. In J. Waage & D. Greathead (Eds.), Insect parasitoids (pp. 23–61). Academic Press.
van Alphen, J. J. M., & Visser, M. E. (1990). Superparasitism as an adaptive strategy for insect parasitoids. Annual Review of Entomology, 351, 59–79.
Amante, M., Schöller, M., Hardy, I. C. W., & Russo, A. (2017). Reproductive biology of Holepyris sylvanidis (Hymenoptera: Bethylidae). Biological Control, 106, 1–8.
Amarasekare, P. (2002). Interference competition and species coexistence. Proceedings of the Royal Society of London B, 269, 2541–2550.
Ameri, M., Rasekh, A., & Mohammadi, Z. (2015). A comparison of life history traits of sexual and asexual strains of the parasitoid wasp, Lysiphlebus fabarum (Braconidae: Aphidiinae). Ecological Entomology, 40, 50–61.
Anderson, J. F. (1990). The size of spider eggs and estimates of their energy content. Journal of Arachnology, 18, 73–78.
Anderson, N. H. (1962). Studies on overwintering of Anthocoris (Hem., Anthocoridae). Entomologist’s Monthly Magazine, 98, 1–3.
Anholt, B. R. (1990). An experimental separation of interference and exploitative competition in a larval dragonfly. Ecology, 71, 1483–1493.
Anunciada, L., & Voegelé, J. (1982). The importance of nutrition in the biotic potential of Trichogramma maidis Pintureau and Voegelé and T. nagarkattii Voegele et Pintureau and oösorption in the females. Les Trichrogrammes, Les Colloques de L’INRA, 9, 79–84. (In French).
Arthur, A. P., & Wylie, H. G. (1959). Effects of host size on sex ratio, development time and size of Pimpla turionellae (L.) (Hymenoptera: Ichneumonidae). Entomophaga, 4, 297–301.
Artiss, T. (2001). Structure and function of male genitalia in Libellula, Ladona and Plathemis (Anisoptera: Libellulidae). Odonatologica, 30, 13–27.
Askew, R. R. (1968). A survey of leaf-miners and their parasites on laburnum. Transactions of the Royal Entomological Society of London, 120, 1–37.
Askew, R. R. (1971). Parasitic insects. Heinemann.
van den Assem, J., van Iersal, J. J. A., & los den Hartogh, R. L. (1989). Is being large more important for female than for male parasitic wasps? Behaviour, 108, 160–195.
Aung, K. S. D., Takasu, K., Ueno, T., & Takagi, M. (2010). Effect of temperature on egg maturation and longevity of the egg parasitoids Ooencyrtus nezarae (Ishii) (Hymenoptera: Encyrtidae). Journal of the Faculty of Agriculture of Kyushu University, 55, 87–89.
Austin, A. D. (1983). Morphology and mechanics of the ovipositor system of Ceratobaeus Ashmead (Hymenoptera: Scelionidae) and related genera. International Journal of Insect Morphology and Embryology, 12, 139–155.
Austin, A. D., & Browning, T. O. (1981). A mechanism for movement of eggs along insect ovipositors. International Journal of Insect Morphology and Embryology, 10, 93–108.
Austin, A. D., & Field, S. A. (1997). The ovipositor system of scelionid and platygastrid wasps (Hymenoptera: Platygastroidea): Comparative morphology and phylogenetic implications. Invertebrate Taxonomy, 11, 1–87.
Avilla, J., & Copland, M. J. W. (1987). Effects of host age on the development of the facultative autoparasitoid Encarsia tricolor (Hymenoptera: Aphelinidae). Annals of Applied Biology, 110, 381–389.
van Baalen, M. (2000). The evolution of parasitoid egg load. In M. E. Hochberg & A. R. Ives (Eds.), Parasitoid population biology (pp. 103–120). Princeton University Press.
van Baalen, M., & Hemerik, L. (2008). Parasitoid fitness: from a simple idea to an intricate concept. In E. Wajnberg, C. Bernstein, & J. J. M. van Alphen (Eds.), Behavioral ecology of insect parasitoids: From theoretical approaches to field applications (pp. 31–50). Blackwell-Wiley.
Bai, B., & Mackauer, M. (1992). Influence of superparasitism on development rate and adult size in a solitary parasitoid Aphidius ervi. Functional Ecology, 6, 302–307.
Bailey, P. C. E. (1986). The feeding behaviour of a sit-and-wait predator, Ranatra dispar (Heteroptera: Nepidae): Optimal foraging and feeding dynamics. Oecologia, 68, 291–297.
Baker, R. L. (1981). Behavioural interactions and use of feeding areas by nymphs of Coenagrion resolutum (Coenagrionidae: Odonata). Oecologia, 49, 353–358.
Baker, R. L. (1989). Condition and size of damselflies: A field study of food limitation. Ecology, 81, 111–119.
Bakker, K., van Alphen, J. J. M., van Batenberg, F. H. D., van der Hoeven, N., Nell, N. W., van Strien-van Liempt, W. T. F. H., & Turlings, T. C. (1985). The function of host discrimination and superparasitism in parasitoids. Oecologia, 67, 572–576.
Banks, M. J., & Thompson, D. J. (1987a). Lifetime reproductive success of females of the damselfly Coenagrion puella. Journal of Animal Ecology, 56, 815–832.
Banks, M. J., & Thompson, D. J. (1987b). Regulation of damselfly populations: The effects of larval density on larval survival, development rate and size in the field. Freshwater Biology, 17, 357–365.
Barbosa, P. J. A., Saunders, J. A., Kemper, R., Trumbule, J., Olechno, J., & Martinat, P. (1986). Plant allelochemicals and insect parasitoids: Effects of nicotine on Cotesia congregata and Hyposoter annulipes. Journal of Chemical Ecology, 12, 1319–1328.
Barbosa, P. R., Oliveira, M. D., Giorgi, J. A., Oliveira, J. E., & Torres, J. B. (2014). Suitability of two prey species for development, reproduction, and survival of Tenuisvalvae notata (Coleoptera: Coccinellidae). Annals of the Entomological Society of America, 107, 1102–1109.
Barfield, C. S., Bottrell, D. C., & Smith, J. W., Jr. (1977a). Influence of temperature on oviposition and adult longevity of Bracon mellitor reared on boll weevils. Environmental, Entomology, 6, 133–137.
Barfield, C. S., Sharpe, P. J. H., & Bottrell, D. G. (1977b). A temperature driven development model for the parasite Bracon mellitor (Hymenoptera: Braconidae). Canadian Entomologist, 109, 1503–1514.
Barker, G. M., & Addison, P. J. (1996). Influence of clavicipitaceous endophyte infection in ryegrass on development of the parasitoid Microctonus hyperodae Loan (Hymenoptera: Braconidae) in Listronotus bonariensis (Kuschel) (Coleoptera: Curculionidae). Biological Control, 7, 281–287.
Barlow, C. A. (1961). On the biology and reproductive capacity of Syrphus corollae Fab. (Syrphidae) in the laboratory. Entomologia Experimentalis et Applicata, 4, 91–100.
Bartlett, B. R. (1964). Patterns in the host-feeding habit of adult Hymenoptera. Annals of the Entomological Society of America, 57, 344–350.
Bazzocchi, G. G., Lanzoni, A., Burgio, G., & Fiacconi, M. R. (2003). Effects of temperature and host on the pre-imaginal development of the parasitoid Diglyphus isaea (Hymenoptera: Eulophidae). Biological Control, 26, 74–82.
Beckage, N. E. (1998a). Modulation of immune responses to parasitoids by polydnaviruses. Parasitology, 116, S57–S64.
Beckage, N. E. (1998b). Parasitoids and polydnaviruses–an unusual mode of symbiosis in which a DNA virus causes host insect immunosuppression and allows the parasitoid to develop. BioScience, 48, 305–311.
Beckage, N. E. (2008). Parasitoid polydnaviruses and insect immunity. In N. E. Beckage (Ed.), Insect immunology (pp. 243–270). Academic Press.
Beckage, N. E., & Riddiford, L. M. (1978). Developmental interactions between the tobacco hornworm Manduca sexta and its braconid parasite Apanteles congregatus. Entomologia Experimentalis et Applicata, 23, 139–151.
Beckage, N. E., & Riddiford, L. M. (1983). Growth and development of the endoparasitic wasp Apanteles congregatus: Dependence on host nutritional status and parasite load. Physiological Entomology, 8, 231–241.
Beddington, J. R., Hassell, M. P., & Lawton, J. H. (1976). The components of arthropod predation. II. The predator rate of increase. Journal of Animal Ecology, 45, 165–185.
Begon, M., & Parker, G. A. (1986). Should egg size and clutch size decrease with age? Oikos, 47, 293–302.
Begon, M., Harper, J. L., & Townsend, C. R. (1996). Ecology: Individuals, populations and communities (3rd ed.). Blackwell.
Bell, C. H. (1994). A review of diapause in stored-product insects. Journal of Stored Products Research, 30, 99–120.
Bell, G., & Koufopanou, V. (1986). The cost of reproduction. Oxford Surveys in Evolutionary Biology, 3, 83–131.
Bellows, T. S., Jr. (1985a). Effects of host and parasitoid age on search behaviour and oviposition rates in Lariophagus distinguendus Forster (Hymenoptera: Pteromalidae). Researches on Population Ecology, 27, 65–76.
Bellows, T. S., Jr. (1985b). Effects of host age and host availability on developmental period, adult size, sex ratio, longevity and fecundity in Lariophagus distinguendus Förster (Hymenoptera: Pteromalidae). Researches on Population Ecology, 27, 55–64.
Ben-Dov, Y. (1972). Life history of Tetrastichus ceroplastae (Girault) (Hymenoptera: Eulophidae), a parasite of the Florida wax scale, Ceroplastes floridensis Comstock (Homoptera: Coccidae), in Israel. Journal of the Entomological Society of South Africa, 35, 17–34.
Benelli, G., Giunti, G., Tena, A., Desneux, N., Caselli, A., & Canale, A. (2017). The impact of adult diet on parasitoid reproductive performance. Journal of Pest Science, 90, 807–823.
Benson, J. F. (1973). Intraspecific competition in the population dynamics of Bracon hebetor Say (Hymenoptera: Braconidae). Journal of Animal Ecology, 42, 105–124.
Benson, M. (1989). The biology and specificity of the host-parasitoid relationship, with reference to aphidophagous syrphid larvae and their associated parasitoids. MPhil thesis, University of Nottingham, UK.
Berberet, R. C. (1982). Effects of host age on embryogenesis and encapsulation of the parasite Bathyplectes curculionis in the alfalfa weevil. Journal of Invertebrate Pathology, 40, 359–366.
Berberet, R. C., Bisges, A. D., & Zarrabi, A. A. (2002). Role of cold tolerance in the seasonal life history of Bathyplectes curculionis (Hymenoptera: Ichneumonidae) in the Southern Great Plains. Environmental Entomology, 31, 739–745.
van Bergeijk, K. E., Bigler, F., Kaashoek, N. K., & Pak, G. A. (1989). Changes in host acceptance and host suitability as an effect of rearing Trichogramma maidis on a factitious host. Entomologia Experimentalis et Applicata, 52, 229–238.
Bernal, J. S., Luck, R. F., & Morse, J. G. (1999). Host influences of sex ratio, longevity, and egg load of two Metaphycus species parasitic on soft scales: Implications for insectary rearing. Entomologia Experimentalis et Applicata, 92, 191–204.
Berrigan, D. (1991). The allometry of egg size and number in insects. Oikos, 60, 313–321.
Berry, I. L., Foerster, K. W., & Ilken, E. H. (1976). Prediction model for development time of stable flies. Transactions of the American Society of Agricultural Engineers, 19, 123–127.
Bess, H. A. (1936). The biology of Leschenaultia exul Townsend, a tachinid parasite of Malacosoma distria Hubner. Annals of the Entomological Society of America, 29, 593–613.
Bethke, J. A., & Redak, R. A. (1996). Temperature and moisture effects on the success of egg hatch in Trirhabda geminata (Coleoptera: Chrysomelidae). Annals of the Entomological Society of America, 89, 661–666.
Bezemer, T. M., & Mills, N. J. (2003). Clutch size decisions of a gregarious parasitoid under laboratory and field conditions. Animal Behaviour, 66, 1119–1128.
Bézier, A., Annaheim, M., Herbinière, J., Wetterwald, C., Gyapay, G., Bernard-Samain, S., Wincker, P., Roditi, I., Heller, M., Belghazi, M., & Pfister-Wilhem, R. (2009). Polydnaviruses of braconid wasps derive from an ancestral nudivirus. Science, 323, 926–930.
Bigler, F., Meyer, A., & Bosshart, S. (1987). Quality assessment in Trichogramma maidis Pinteureau et Voegelé reared from eggs of the factitious hosts Ephestia kuehniella Zell. and Sitotroga cerealella (Olivier). Journal of Applied Entomology, 104, 340–353.
Blackburn, T. M. (1991a). A comparative examination of lifespan and fecundity in parasitoid Hymenoptera. Journal of Animal Ecology, 60, 151–164.
Blackburn, T. M. (1991b). Evidence for a ‘fast-slow’ continuum of life-history traits among parasitoid Hymenoptera. Functional Ecology, 5, 65–74.
Blackman, R. L. (1967). The effect of different aphid foods on Adalia bipunctata L. and Coccinella 7-punctata L. Annals of Applied Biology, 59, 207–219.
Blumberg, D. (1991). Seasonal variations in the encapsulation of eggs of the encyrtid parasitoid Metaphycus stanleyi by the pyriform scale, Protopulvinaria pyriformis. Entomologia Experimentalis et Applicata, 58, 231–237.
Blumberg, D., & DeBach, P. (1979). Development of Habrolepis rouxi Compere (Hymenoptera: Encyrtidae) in two armoured scale hosts (Homoptera: Diaspididae) and parasite egg encapsulation by California red scale. Ecological Entomology, 4, 299–306.
Blumberg, D., & Van Driesche, R. G. (2002). Encapsulation rates of three encyrtid parasitoids by three mealybug species (Homoptera: Pseudococcidae) found commonly as pests in commercial greenhouses. Biological Control, 22, 191–199.
Blumberg, D., & Luck, R. F. (1990). Differences in the rates of superparasitism between two strains of Comperiella bifasciata (Howard) (Hymenoptera: Encyrtidae) parasitizing California red scale (Homoptera: Diaspididae): An adaptation to circumvent encapsulation? Annals of the Entomological Society of America, 83, 591–597.
Blumberg, D., Klein, M., & Mendel, Z. (1995). Response by encapsulation of four mealybug species (Homoptera: Pseudococcidae) to parasitization by Anagyrus pseudococci. Phytoparasitica, 23, 157–163.
Bodin, A., Jaloux, B., Delbecque, J. P., Vannier, F., Monge, J. P., & Mondy, N. (2009). Reproduction in a variable environment: How does Eupelmus vuilleti, a parasitoid wasp, adjust oogenesis to host availability? Journal of Insect Physiology, 55, 643–648.
Boggs, C. L. (1981). Nutritional and life-history determinants of resource allocation in holometabolous insects. American Naturalist, 117, 692–709.
Boggs, C. L. (1992). Resource allocation: Exploring connections between foraging and life history. Functional Ecology, 6, 508–518.
Boggs, C. L. (1997a). Reproductive allocation from reserves and income in butterfly species with differing diets. Ecology, 78, 181–191.
Boggs, C. L. (1997b). Dynamics of reproductive allocation from juvenile and adult feeding: Radiotracer studies. Ecology, 78, 192–202.
Boivin, G. (2013). Sperm as a limiting factor in mating success in Hymenoptera parasitoids. Entomologia Experimentalis et Applicata, 146, 149–155.
Bommarco, R. (1998). Stage sensitivity to food limitation for a generalist arthropod predator, Pterostichus cupreus (Coleoptera: Carabidae). Environmental Entomology, 27, 863–869.
Boulétreau, M. (1986). The genetic and coevolutionary interactions between parasitoids and their hosts. In J. K. Waage & D. Greathead (Eds.), Insect parasitoids (pp. 169–200). Academic Press.
Bowler, K., & Terblanche, J. S. (2008). Insect thermal tolerance: What is the role of ontogeny, ageing and senescence? Biological Reviews, 83, 339–355.
Bradford, M. M. (1976). A rapid and sensitive method for the quantification of microgram quantities of protein utilizing the principle of protein-dye binding. Analytical Biochemistry, 72, 248–254.
Brakefield, P. (1985). Polymorphic Müllerian mimicry and interactions with thermal melanism in ladybirds and a soldier beetle: A hypothesis. Biological Journal of the Linnean Society, 26, 243–267.
Braman, S. K., & Yeargan, K. V. (1988). Comparison of developmental and reproductive rates of Nabis americoferus, N. roseipennis and N. rufusciilus (Hemiptera: Nabidae). Journal of the Entomological Society of America, 81, 923–930.
Branquart, E., & Hemptinne, J.-L. (2000). Development of ovaries, allometry of reproductive traits and fecundity of Episyrphus balteatus (Diptera: Syrphidae). European Journal of Entomology, 97, 165–170.
Brodeur, J., & McNeil, J. N. (1989). Biotic and abiotic factors involved in diapause induction of the parasitoid, Aphidius nigripes. Journal of Insect Physiology, 35, 969–974.
Brodin, T., & Johansson, F. (2002). Effects of predator-induced thinning and activity changes on life history in a damselfly. Oecologia, 132, 316–322.
Browning, H. W., & Oatman, E. R. (1981). Effects of different constant temperatures on adult longevity, development time, and progeny production of Hyposoter exiguae (Hymenoptera: Lchneumonidae). Annals of the Entomological Society of America, 74, 79–82.
Bultman, T. L., Borowicz, K. L., Schneble, R. M., Coudron, T. A., & Bush, L. P. (1997). Effect of a fungal endophyte on the growth and survival of two Euplectrus parasitoids. Oikos, 78, 170–176.
Burkhard, D. U., Ward, P. I., & Blanckenhorn, W. U. (2002). Using age grading by wing injuries to estimate size-dependent adult survivorship in the field: A case study of the yellow dung fly Scathophaga stercoraria. Ecological Entomology, 27, 514–520.
Bursell, E. (1964). Environmental aspects: Temperature. In M. Rockstein (Ed.), The physiology of the insecta (pp. 283–321). Academic Press.
Burstone, M. S. (1957). Polyvinyl pyrrolidone. American Journal of Clinical Pathology, 28, 429–430.
van Buskirk, J. (1987). Density-dependent population dynamics in larvae of the dragonfly Pachydiplax longipennis: A field experiment. Oecologia, 72, 221–225.
Butts, R. A., & McEwen, F. L. (1981). Seasonal populations of the diamondback moth in relation to day-degree accumulation. Canadian Entomologist, 113, 127–131.
Campbell, A., Frazer, B. D., Gilbert, N., Gutierrez, A. P., & Mackauer, M. (1974). Temperature requirements of some aphids and their parasites. Journal of Applied Ecology, 11, 431–438.
Campbell, B. C., & Duffey, S. S. (1979). Tomatine and parasitic wasps: Potential incompatibility of plant antibiosis with biological control. Science, 205, 700–702.
Carbone, S. S., Nieto, M. P., & Rivera, A. C. (2008). Egg resorption behaviour by the solitary egg parasitoid Anaphes nitens under natural conditions. Entomologia Experimentalis et Applicata, 127, 191–198.
Carton, Y., & Nappi, A. J. (1997). Drosophila cellular immunity against parasitoids. Parasitology Today, 13, 218–227.
Casas, J., Driessen, G., Mandon, N., Wileaard, S., Desouhant, E., van Alphen, J. J. M., Lapchin, L., Rivero, A., Christides, J. P., & Bernstein, C. (2003). Energy dynamics in a parasitoid foraging in the wild. Journal of Animal Ecology, 72, 691–697.
Cave, R. D., & Gaylor, M. J. (1988). Influence of temperature and humidity on development and survival of Telenomus reynoldsi (Hymenoptera: Scelionidae) parasitising Geocoris punctipes (Heteroptera: Lygaeidae) eggs. Annals of the Entomological Society of America, 81, 278–285.
Cave, R. D., & Gaylor, M. J. (1989). Longevity, fertility, and population growth statistics of Telenomus reynoldsi (Hymenoptera: Scelionidae). Proceedings of the Entomological Society of Washington, 91, 588–593.
Cerkvenik, U., van de Straat, B., Gussekloo, S. W., & van Leeuwen, J. L. (2017). Mechanisms of ovipositor insertion and steering of a parasitic wasp. Proceedings of the National Academy of Sciences USA, 114, E7822–E7831.
Chan, M. S., & Godfray, H. C. J. (1993). Host-feeding strategies of parasitoid wasps. Evolutionary Ecology, 7, 593–604.
Chang, Y. F., Tauber, M. J., & Tauber, C. A. (1996). Reproduction and quality of F1 offspring in Chrysoperla carnea: Differential influence of quiescence, artificially-induced diapause, and natural diapause. Journal of Insect Physiology, 42, 521–528.
Chapman, R. F. (1998). The insects: Structure and function. Cambridge University Press.
Chapman, R. F. (2013). The insects: Structure and function, 5th ed. (Eds. S. J. Simpson & A. E. Douglas). Cambridge University Press.
Charnov, E. L., Los-den Hartogh, R. L., Jones, W. T., & van den Assem, J. (1981). Sex ratio evolution in a variable environment. Nature, 289, 27–33.
Chelliah, J., & Jones, D. (1990). Biochemical and immunological studies of proteins from polydnavirus Chelonus sp. near curvimaculatus. Journal of General Virology, 71, 2353–2359.
Chen, C., Donner, S. H., Biere, A., Gols, R., & Harvey, J. A. (2019a). Simulated heatwave conditions associated with global warming affect development and competition between hyperparasitoids. Oikos, 128, 1783–1792.
Chen, C., Gols, R., Biere, A., & Harvey, J. A. (2019b). Differential effects of climate warming on reproduction and functional responses on insects in the fourth trophic level. Functional Ecology, 33, 693–702.
Chiappini, E., & Mazzoni, E. (2000). Differing morphology and ultrastructure of the male copulatory apparatus in species-groups of Anagrus Haliday (Hymenoptera: Mymaridae). Journal of Natural History, 34, 1661–1676.
Chong, J. H., & Oetting, R. D. (2006). Influence of temperature and mating status on the development and fecundity of the mealybug parasitoid, Anagyrus sp. nov. nr. sinope Noyes and Menezes (Hymenoptera: Encyrtidae). Environmental Entomology, 35, 1188–1197.
Chow, F. J., & Mackauer, M. (1984). Inter- and intraspecific larval competition in Aphidius smithi and Praon pequodorum (Hymenoptera: Aphidiidae). Canadian Entomologist, 116, 1097–1107.
Chow, F. J., & Mackauer, M. (1985). Multiple parasitism of the pea aphid: Stage of development of parasite determines survival of Aphidius smithi and Praon pequodorum (Hymenoptera: Aphidiidae). Canadian Entomologist, 117, 133–134.
Chow, F. J., & Mackauer, M. (1986). Host discrimination and larval competition in the aphid parasite Ephedrus californicus. Entomologia Experimentalis et Applicata, 41, 243–254.
Christiansen-Weniger, P., & Hardie, J. (1997). Development of the aphid parasitoid, Aphidius ervi, in asexual and sexual females of the pea aphid, Acyrthosiphon pisum, and the blackberry-cereal aphid, Sitobion fragariae. Entomophaga, 42, 165–172.
Christiansen-Weniger, P., & Hardie, J. (1999). Environmental and physiological factors for diapause induction and termination in the aphid parasitoid, Aphidius ervi (Hymenoptera: Aphidiidae). Journal of Insect Physiology, 45, 357–364.
Chyzik, R., Klein, M., & Bendov, Y. (1995). Reproduction and survival of the predatory bug Orius albidipennis on various arthropod prey. Entomologia Experimentalis et Applicata, 75, 27–31.
Cingolani, M. F., Greco, N. M., & Liljesthröm, G. G. (2013). Multiparasitism of Piezodorus guildinii eggs by Telenomus podisi and Trissolcus urichi. BioControl, 58, 37–44.
Clausen, C. P., King, J. L., & Teranishi, C. (1927). The parasites of Popillia japonica in Japan and Korea and their introduction into the United States. USDA, Departmental Bulletin (Vol. 1429, 56pp).
Clausen, C. P. (1940). Entomophagous insects. McGraw-Hill Co.
de Clercq, P., & Degheele, D. (1997). Effects of mating status on body weight, oviposition, egg load, and predation in the predatory stinkbug Podisus maculiventris (Heteroptera: Pentatomidae). Annals of the Entomological Society of America, 90, 121–127.
Cloutier, C. (1997). Facilitated predation through interaction between life stages in the stinkbug predator Perillus bioculatus (Hemiptera: Pentatomidae). Journal of Insect Behavior, 10, 581–598.
Cloutier, C., Duperron, J., Tertuliano, M., & McNeil, J. N. (2000). Host instar and fitness in the koinobiotic parasitoid Aphidius nigripes. Entomologia Experimentalis et Applicata, 97, 29–40.
Cloutier, C., Levesque, C. A., Eaves, D. M., & Mackauer, M. (1991). Maternal adjustment of sex–ratio in response to host size in the aphid parasitoid Ephedrus californicus. Canadian Journal of Zoology, 69, 1489–1495.
Cocuzza, G. E., de Clercq, P., van de Veire, M., de Cock, A., Degheele, D., & Vacante, V. (1997a). Reproduction of Orius albidipennis on pollen and Ephestia kuehniella eggs. Entomologia Experimentalis et Applicata, 82, 101–104.
Cocuzza, G. E., de Clercq, P., Lizzio, S., van de Veire, M., Tirry, L., Degheele, D., & Vacante, V. (1997b). Life tables and predation activity of Orius laevigatus and O. albidipennis at three constant temperatures. Entomologia Experimentalis et Applicata, 85, 189–198.
Coe, R. L. (1966). Diptera: Pipunculidae. Handbooks for the identification of british insects, 10(2c). Royal Entomological Society of London, London.
Cohen, A. C. (1984). Food consumption, food utilization, and metabolic rates of Geocoris punctipes (Het.: Lygaeidae) fed Heliothis virescens (Lep.: Noctuidae) eggs. Entomophaga, 29, 361–367.
Cohen, A. C. (1989). Ingestion efficiency and protein consumption by a heteropteran predator. Annals of the Entomological Society of America, 82, 495–499.
Cohen, A. C. (1995). Extra-oral digestion in predaceous terrestrial Arthropoda. Annual Review of Entomology, 40, 85–103.
Cohen, A. C., & Tang, R. (1997). Relative prey weight influences handling time and biomass extraction in Sinea confusa and Zelus renardii (Heteroptera: Reduviidae). Environmental Entomology, 26, 559–565.
Cole, L. R. (1967). A study of the life-cycles and hosts of some Ichneumonidae attacking pupae of the green oak-leaf roller moth, Tortrix viridana (L.) (Lepidoptera: Tortricidae) in England. Transactions of the Royal Entomological Society of London, 119, 267–281.
Collier, T., Kelly, S., & Hunter, M. (2002). Egg size, intrinsic competition, and lethal interference in the parasitoids Encarsia pergandiella and Encarsia formosa. Biological Control, 23, 254–261.
Collins, M. D., & Dixon, A. F. G. (1986). The effect of egg depletion on the foraging behaviour of an aphid parasitoid. Journal of Applied Entomology, 102, 342–352.
Commonwealth Scientific and Industrial Research Organisation (CSIRO). (1991). The insects of Australia (Vol. 1). Melbourne University Press.
Cônsoli, E. L., Kitajima, E. W., & Parra, J. R. P. (1999). Sensilla on the antenna and ovipositor of the parasitic wasps Trichograma galloi Zucchi and T. pretiosum Riley (Hymenoptera., Trichogrammatidae). Microscopy Research and Technique, 45, 313–324.
Cook, R. M., & Cockrell, B. J. (1978). Predator ingestion rate and its bearing on feeding time and the theory of optimal diets. Journal of Animal Ecology, 47, 529–548.
Coombs, M. T. (1997). Influence of adult food deprivation and body size on fecundity and longevity of Trichopoda giacomellii: A South American parasitoid of Nezara viridula. Biological Control, 8, 119–213.
Copland, M. J. W. (1976). Female reproductive system of the Aphelinidae (Hymenoptera: Chalcidoidea). International Journal of Insect Morphology and Embryology, 5, 151–166.
Copland, M. J. W., & King, P. E. (1971). The structure and possible function of the reproductive system in some Eulophidae and Tetracampidae. Entomologist, 104, 4–28.
Copland, M. J. W., & King, P. E. (1972a). The structure of the female reproductive system in the Pteromalidae (Chalcidoidea: Hymenoptera). Entomologist, 105, 77–96.
Copland, M. J. W., & King, P. E. (1972b). The structure of the female reproductive system in the Eurytomidae (Chalcidoidea: Hymenoptera). Journal of Zoology, 166, 185–212.
Copland, M. J. W., & King, P. E. (1972c). The structure of the female reproductive system in the Torymidae (Hymenoptera: Chalcidoidea). Transactions of the Royal Entomological Society of London, 124, 191–212.
Copland, M. J. W., & King, P. E. (1972d). The structure of the female reproductive system in the Chalcididae (Hym.). Entomologist’s Monthly Magazine, 107, 230–239.
Copland, M. J. W., King, P. E., & Hill, D. S. (1973). The structure of the female reproductive system in the Agaonidae (Chalcidoidea, Hymenoptera). Journal of Entomology (A), 48, 25–35.
Cordoba-Aguilar, A. (2002). Sensory trap as the mechanism of sexual selection in a damselfly genitalic trait (Insecta: Calopterygidae). American Naturalist, 160, 594–601.
Cornelius, M., & Barlow, C. A. (1980). Effect of aphid consumption by larvae on development and reproductive efficiency of a flower-fly, Syrphus corollae (Diptera: Syrphidae). Canadian Entomologist, 112, 989–992.
Cornell, H. V., Hawkins, B. A., & Hochberg, M. E. (1998). Towards an empirically–based theory of herbivore demography. Ecological Entomology, 23, 340–349.
Corrigan, J. E., & Lashomb, J. H. (1990). Host influences on the bionomics of Edovum puttleri (Hymenoptera: Eulophidae): Effects on size and reproduction. Environmental Entomology, 19, 1496–1502.
Cox, D. R., & Oakes, D. (1984). Analysis of survival data. Chapman and Hall.
Crawley, M. J. (1993). GLIM for ecologists. Blackwell Scientific Publications.
Crawley, M. J. (2002). Statistical computing: An introduction to data analysis using S-Plus. John Wiley.
Croft, P., & Copland, M. (1993). Size and fecundity in Dacnusa sibirica Telenga. Bulletin OILB/SROP, 16, 53–56.
Crowley, P. H., & Martin, E. K. (1989). Functional responses and interference within and between year classes of a dragonfly population. Journal of the North American Benthological Society, 8, 211–221.
Crowley, P. H., Nisbet, R. M., Gurney, W. S. C., & Lawton, J. H. (1987). Population regulation in animals with complex life-histories: Formulation and analysis of a damselfly model. In A. Macfadyen & E. D. Ford (Eds.), Advances in ecological research (Vol. 17, pp. 1–59). Academic Press.
Crum, D. A., Weiser, L. A., & Stamp, N. E. (1998). Effects of prey scarcity and plant material as a dietary supplement on an insect predator. Oikos, 81, 549–557.
Cusumano, A., Peri, E., & Colazza, S. (2016). Interspecific competition/facilitation among insect parasitoids. Current Opinion in Insect Science, 14, 12–16.
Cusumano, A., Peri, E., Boivin, G., & Colazza, S. (2015). Fitness costs of intrinsic competition in two egg parasitoids of a true bug. Journal of Insect Physiology, 81, 52–59.
van Dam, N. M., Hadwich, K., & Baldwin, I. T. (2000). Induced responses in Nicotiana attenuata affect behavior and growth of the specialist herbivore Manduca sexta. Oecologia, 122, 371–379.
Damien, M., & Tougeron, K. (2019). Prey–predator phenological mismatch under climate change. Current Opinion in Insect Science, 35, 60–68.
Danilevskii, A. S. (1965). Photoperiodism and seasonal development in insects. Oliver and Boyd, Edinburgh and London.
Davidson, J. (1944). On the relationship between temperature and the rate of development of insects at constant temperatures. Journal of Animal Ecology, 13, 26–38.
Davies, D. H., Burghardt, R. L., & Vinson, S. B. (1986). Oögenesis of Cardiochiles nigriceps Viereck (Hymenoptera: Braconidae): Histochemistry and development of the chorion with special reference to the fibrous layer. International Journal of Insect Morphology and Embryology, 15, 363–374.
Davies, J. (1974). The effect of age and diet on the ultrastructure of Hymenopteran flight muscle. Experimental Gerontology, 9, 215–219.
Debach, P., & Rosen, D. (1991). Biological control by natural enemies (2nd ed.). Cambridge University Press.
Dhillon, M. K., & Sharma, H. C. (2009). Temperature influences the performance and effectiveness of field and laboratory strains of the ichneumonid parasitoid, Campoletis chlorideae. BioControl, 54, 743–750.
van Dijk, T. S. (1994). On the relationship between food, reproduction and survival of two carabid beetles: Calathus melanocephalus and Pterostichus versicolor. Ecological Entomology, 19, 262–270.
Dijkerman, H. J. (1988). Notes on the parasitation behaviour and larval development of Trieces tricarinatus and Triclistus yponomeutae (Hymenoptera, Ichneumonidae), endoparasitoids of the genus Yponomeuta (Lepidoptera, Yponomeutidae). Proceedings Koninklijke Nederlandse Akademie van Wetenschappen, 91, 19–30.
Dijkerman, H. J. (1990). Suitability of eight Yponomeuta species as hosts of Diadegma armillata. Entomologia Experimentalis et Applicata, 54, 173–180.
Dijkerman, H. J., & Koenders, J. T. H. (1988). Competition between Trieces tricarinatus and Triclistus yponomeutae in multiparasitized hosts. Entomologia Experimentalis et Applicata, 47, 289–295.
Dixon, A. F. G. (1959). An experimental study of the searching behaviour of the predatory coccinellid beetle Adalia decempunctata (L.). Journal of Animal Ecology, 28, 259–281.
Dixon, A. F. G. (2000). Insect predator-prey dynamics: Ladybird beetles and biological control. Cambridge University Press.
Dixon, A. F. G., & Guo, Y. (1993). Egg and cluster size in ladybird beetles (Coleoptera: Coccinellidae): The direct and indirect effects of aphid abundance. European Journal of Entomology, 90, 457–463.
Dmitriew, C., & Rowe, L. (2007). Effects of early resource limitation and compensatory growth on lifetime fitness in the ladybird beetle (Harmonia axyridis). Journal of Evolutionary Biology, 20, 1298–1310.
Domenichini, G. (1953). Studio sulla morfologia dell’addome degli Hymenoptera Chalcidoidea. Bolletino di Zoologie Agraria e Bachicoltura, 19, 1–117.
Donaldson, J. S., & Walter, G. H. (1988). Effects of egg availability and egg maturity on the ovipositional activity of the parasitic wasp, Coccophagus atratus. Physiological Entomology, 13, 407–417.
Doutt, R. L., Annecke, D. P., & Tremblay, E. (1976). Biology and host relationships of parasitoids. In C. B. Huffaker & P. S. Messenger (Eds.), Theory and practice of biological control (pp. 143–168). Academic Press.
Dransfield, R. D. (1979). Aspects of host-parasitoid interactions of two aphid parasitoids, Aphidius urticae (Haliday) and Aphidius uzbeckistanicus (Luzhetski) (Hymenoptera, Aphidiidae). Ecological Entomology, 4, 307–316.
Drapela, T., Frank, T., Heer, X., Moser, D., & Zaller, J. G. (2011). Landscape structure affects activity density, body size and fecundity of Pardosa wolf spiders (Araneae: Lycosidae) in winter oilseed rape. European Journal of Entomology, 108, 609–614.
Dreisig, H. (1981). The rate of predation and its temperature dependence in a tiger beetle, Cicindela hybrida. Oikos, 36, 196–202.
Drent, R. H., & Daan, S. (1980). The prudent parent: Energetic adjustments in avian breeding. Ardea, 68, 225–252.
Dudgeon, D. (1990). Feeding by the aquatic heteropteran, Diplonychus rusticum (Belostomatidae): An effect of prey density on meal size. Hydrobiologia, 190, 93–96.
Duffey, S. S., Bloem, K. A., & Campbell, B. C. (1986). Consequences of sequestration of plant natural products in plant–insect–parasitoid interactions. In D. J. Boethel & R. D. Eikenbary (Eds.), Interactions of plant resistance and parasitoids and predators of insects (pp. 31–60). Horwood.
Dunlap-Pianka, H., Boggs, C. L., & Gilbert, L. E. (1977). Ovarian dynamics in heliconiine butterflies: Programmed senescence versus eternal youth. Science, 197, 487–490.
Eben, A., Benrey, B., Sivinski, J., & Aluja, M. (2000). Host species and host plant effects on preference and performance of Diachasmimorpha longicaudata (Hymenoptera: Braconidae). Environmental Entomology, 29, 87–94.
Eberhard, W. G., Huber, B. A., Briceño, R. D., Salas, I., & Rodriguez, V. (1998). One size fits all? Relationships between the size and degree of variation in genitalia and other body parts in twenty species of insects and spiders. Evolution, 52, 415–431.
Edwards, R. L. (1954). The effect of diet on egg maturation and resorption in Mormoniella vitripennis (Hymenoptera, Pteromalidae). Quarterly Journal of Microscopical Science, 95, 459–468.
Eijs, I., Ellers, J., & van Duinen, G.-J. (1998). Feeding strategies in drosophilid parasitoids: The impact of natural food resources on energy reserves in females. Ecological Entomology, 23, 133–138.
Eisenbeis, G., Hänel, A., McDonnell, M., Hahs, A., & Breuste, J. (2009). Light pollution and the impact of artificial night lighting on insects. In Ecology of cities and towns: A comparative approach (pp. 243–263). Cambridge University Press.
Ekbom, B. S. (1982). Diurnal activity patterns of the greenhouse whitefly, Trialeurodes vaporariorum (Homoptera: Aleyrodidae) and its parasitoid Encarsia formosa (Hymenoptera: Aphelinidae). Protection Ecology, 4, 141–150.
Eller, F. J., Tumlinson, J. H., & Lewis, W. J. (1990). Intraspecific competition in Microplitis croceipes (Hymenoptera: Braconidae), a parasitoid of Heliothis species (Lepidoptera: Noctuidae). Annals of the Entomological Society of America, 83, 504–508.
Ellers, J. (1996). Fat and eggs: An alternative method to measure the trade-off between survival and reproduction in insect parasitoids. Netherlands Journal of Zoology, 46, 227–235.
Ellers, J., & Jervis, M. (2003). Body size and the timing of egg production in parasitoid wasps. Oikos, 102, 164–172.
Ellers, J., & van Alphen, J. J. M. (1997). Life history evolution in Asobara tabida: Plasticity in allocation of fat reserves to survival and reproduction. Journal of Evolutionary Biology, 10, 771–785.
Ellers, J., & van Alphen, J. J. M. (2002). A trade-off between diapause duration and fitness in female parasitoids. Ecological Entomology, 27, 279–284.
Ellers, J., van Alphen, J. J. M., & Sevenster, J. G. (1998). A field study of size-fitness relationships in the parasitoid Asobara tabida. Journal of Animal Ecology, 67, 318–324.
Ellers, J., Bax, M., & van Alphen, J. J. M. (2001). Seasonal changes in female size and its relation to reproduction in the parasitoid Asobara tabida. Oikos, 92, 309–314.
Ellers, J., Driessen, G., & Sevenster, J. G. (2000). The shape of the trade-off function between egg production and life-span in the parasitoid Asobara tabida. Netherlands Journal of Zoology, 50, 29–36.
Elliot, S. L., Blanford, S., & Thomas, M. B. (2002). Host-pathogen interactions in a varying environment: Temperature, behavioural fever and fitness. Proceedings of the Royal Society of London B, 269, 1599–1607.
Emana, G. D. (2007). Comparative studies of the influence of relative humidity and temperature on the longevity and fecundity of the parasitoid, Cotesia flavipes. Journal of Insect Science, 7, 19.
Engelmann, F. (1970). The physiology of insect reproduction. Pergamon Press.
Erb, M., & Robert, C. A. (2016). Sequestration of plant secondary metabolites by insect herbivores: Molecular mechanisms and ecological consequences. Current Opinion in Insect Science, 14, 8–11.
Ernsting, G., & Huyer, F. A. (1984). A laboratory study on temperature relations of egg production and development in two related species of carabid beetle. Oecologia, 62, 361–367.
Ernsting, G., & Isaaks, J. A. (1988). Reproduction, metabolic rate and survival in a carabid beetle. Netherlands Journal of Zoology, 38, 46–60.
Ernsting, G., & Isaaks, J. A. (1991). Accelerated ageing: A cost of reproduction in the carabid beetle Notiophilus biguttatus F. Functional Ecology, 5, 299–303.
Eubank, W. P., Atmar, J. W., & Ellington, J. J. (1973). The significance and thermodynamics of fluctuating versus static thermal environments on Heliothis zea egg development rates. Environmental Entomology, 2, 491–496.
Evans, H. F. (1973). A study of the predatory habits of Anthocoris species (Hemiptera-Heteroptera). DPhil thesis, University of Oxford, UK.
Evans, H. F. (1976). Mutual interference between predatory arthropods. Ecological Entomology, 1, 283–286.
Evans, E. W., Stevenson, A. T., & Richards, D. R. (1999). Essential versus alternative foods of insect predators: Benefits of a mixed diet. Oecologia, 121, 107–112.
Fadamiro, H. Y., & Heimpel, G. E. (2001). Effects of partial sugar deprivation on lifespan and carbohydrate mobilization in the parasitoid Macrocentrus grandii (Hymenoptera: Braconidae). Annals of the Entomological Society of America, 94, 909–916.
Farrar, R. R., Barbour, J. D., & Kennedy, G. C. (1989). Quantifying food consumption and growth in insects. Annals of the Entomological Society of America, 82, 593–598.
Fathi, S. A. A. (2009). The abundance of Orius niger (Wolf.) and O. minutus (L.) in potato fields and their life table parameters when fed on two prey species. Journal of Pest Science, 82, 267–272.
Fellowes, M., & Hutcheson, K. (2001). Flies in the face of adversity. Biologist, 48, 75–78.
Fellowes, M. D. E., & Godfray, H. C. J. (2000). The evolutionary ecology of resistance to parasitoids by Drosophila. Heredity, 84, 1–8.
Ferkovich, S. M., & Dillard, C. R. (1987). A study of uptake of radiolabelled host proteins and protein synthesis during development of eggs of the endoparasitoid, Microplitis croceipes (Cresson) (Braconidae). Insect Biochemistry, 16, 337–345.
Ferran, A., Buscarlet, A., & Larroque, M. M. (1981). The use of HT18O for measuring the food consumption in aged larvae of the aphidophagous ladybeetle, Semiadalia 11-notata (Col: Coccinellidae). Entomophaga, 26, 71–77. (In French).
Fidgen, J. G., Eveleight, E. S., & Quiring, D. T. (2000). Influence of host size on oviposition behaviour and fitness of Elachertus cacoeciae attacking a low-density population of spruce budworm Choristoneura fumiferana larvae. Ecological Entomology, 25, 156–164.
Field, S. A., & Austin, A. D. (1994). Anatomy and mechanics of the telescopic ovipositor system of Scelio Latreille (Hymenoptera, Scelionidae) and related genera. International Journal of Insect Morphology and Embryology, 23, 135–158.
Finch, S., & Coaker, T. H. (1969). Comparison of the nutritive values of carbohydrates and related compounds to Erioischia brassicae. Entomologia Experimentalis et Applicata, 12, 441–453.
Fink, U., & Völkl, W. (1995). The effect of biotic factors on foraging and oviposition success of the aphid parasitoid, Aphidius rosae. Oecologia, 103, 371–378.
Firebaugh, A., & Haynes, K. J. (2019). Light pollution may create demographic traps for nocturnal insects. Basic and Applied Ecology, 34, 118–125.
Fisher, R. C. (1961). A study in insect multiparasitism. II. The mechanism and control of competition for the host. Journal of Experimental Biology, 38, 605–628.
Fisher, R. C. (1971). Aspects of the physiology of endoparasitic Hymenoptera. Biological Reviews, 46, 243–278.
Fitt, G. P. (1990). Comparative fecundity, clutch size, ovariole number and egg size of Dacus tryoni and D. jarvisi, and their relationship to body size. Entomologia Experimentalis et Applicata, 55, 11–21.
Flanders, S. E. (1934). The secretion of the colleterial glands in the parasitic chalcids. Journal of Economic Entomology, 27, 861–862.
Flanders, S. E. (1942). Oösorption and ovulation in relation to oviposition in the parasitic Hymenoptera. Annals of the Entomological Society of America, 35, 251–266.
Flanders, S. E. (1950). Regulation of ovulation and egg disposal in the parasitic Hymenoptera. Canadian Entomologist, 82, 134–140.
Fleming, J.-A.G.W. (1992). Polydnaviruses: Mutualists and pathogens. Annual Review of Entomology, 37, 401–425.
Fletcher, B. S., & Kapatos, E. T. (1983). An evaluation of different temperature-development rate models for predicting the phenology of the olive fly Dacus oleae. In R. Cavalloro (Ed.) Fruit flies of economic importance. CEC/IOBC symposium, Athens, November 1982 (pp. 321–330). Balkema, Rotterdam.
Force, D. C., & Messenger, P. S. (1964). Fecundity, reproductive rates, and innate capacity for increase in three parasites of Therioaphis maculata (Buckton). Ecology, 45, 706–715.
Forsythe, T. G. (1987). Common ground beetles, naturalists’ handbooks no 8. Richmond, Slough.
Fox, L. R., & Murdoch, W. W. (1978). Effects of feeding history on short term and long term functional responses in Notonecta hoffmani. Journal of Animal Ecology, 47, 945–959.
Fox, P. M., Pass, B. C., & Thurston, R. (1967). Laboratory studies on the rearing of Aphidius smithi (Hymenoptera: Braconidae) and its parasitism of Acyrthosiphon pisum (Homoptera: Aphididae). Annals of the Entomological Society of America, 60, 1083–1087.
Frank, S. D., Shrewsbury, P. M., & Denno, R. F. (2010). Effects of alternative food on cannibalism and herbivore suppression by carabid larvae. Ecological Entomology, 35, 61–68.
Frazer, B. D., & McGregor, R. R. (1992). Temperature-dependent survival and hatching rate of eggs of seven species of Coccinellidae. Canadian Entomologist, 124, 305–312.
Fritz, R. S., McDonough, S. F., & Rhoads, A. G. (1997). Effects of plant hybridization on herbivore-parasitoid interactions. Oecologia, 110, 360–367.
Gagné, I., Coderre, D., & Maufette, Y. (2002). Egg cannibalism by Coleomegilla maculata lengi neonates: Preference even in the presence of essential prey. Ecological Entomology, 27, 285–291.
Gajger, I. T., & Dar, S. A. (2021). Plant allelochemicals as sources of insecticides. Insects, 12, 189.
Gaston, K. J. (1988). The intrinsic rates of increase of insects of different sizes. Ecological Entomology, 14, 399–409.
Gauld, I., & Bolton, B. (1988). The hymenoptera. Oxford University Press.
Gauld, I. D., & Huddleston, T. (1976). The nocturnal Ichneumonidae of the British Isles, including a key to genera. Entomologist’s Gazette, 27, 35–49.
Gehan, E. A., & Siddiqui, M. M. (1973). Simple regression methods for survival time studies. Journal of American Statistical Association, 68, 848–856.
Gerling, D., Quicke, D. L. J., & Orion, T. (1998). Oviposition mechanisms in the whitefly parasitoids Encarsia transvana and Eretmocerus mundus. BioControl, 43, 289–297.
Geusen-Pfister, H. (1987). Studies on the biology and reproductive capacity of Episyrphus balteatus Deg. (Dipt., Syrphidae) under greenhouse conditions. Journal of Applied Entomology, 104, 261–270.
Ghimire, M. N., & Phillips, T. W. (2014). Oviposition and reproductive performance of Habrobracon hebetor (Hymenoptera: Braconidae) on six different pyralid host species. Annals of the Entomological Society of America, 107, 809–817.
Gilbert, F. S. (1986). Hoverflies, naturalists’ handbooks no. 5. Cambridge University Press.
Gilbert, F. S. (1990). Size, phylogeny and life-history in the evolution of feeding specialisation in insect predators. In F. S. Gilbert (Ed.), Insect life cycles: Genetics, evolution and co-ordination (pp. 101–124). Springer.
Gilbert, F. S. (1991). Feeding in adult hoverflies. Hoverfly Newsletter, 13, 5–11.
Gilbert, F. S., & Jervis, M. A. (1998). Functional, evolutionary and ecological aspects of feeding-related mouthpart specializations in parasitoid flies. Biological Journal of the Linnean Society, 63, 495–535.
Gilbert, N. (1984). Control of fecundity in Pieris rapae. II. Differential effects of temperature. Journal of Animal Ecology, 53, 589–597.
Gilbert, N., Gutierrez, A. P., Frazer, B. D., & Jones, R. E. (1976). Ecological relationships. W.H. Freeman and Co.
Giller, P. S. (1980). The control of handling time and its effects on the foraging strategy of a heteropteran predator, Notonecta. Journal of Animal Ecology, 49, 699–712.
Giron, D., & Casas, J. (2003a). Lipogenesis in an adult parasitic wasp. Journal of Insect Physiology, 49, 141–147.
Giron, D., & Casas, J. (2003b). Mothers reduce egg provisioning with age. Ecology Letters, 6, 271–277.
Giron, D., Rivero, A., Mandon, N., Darrouzet, E., & Casas, J. (2002). The physiology of host feeding in parasitic wasps: Implications for survival. Functional Ecology, 16, 750–757.
Glen, D. M. (1973). The food requirements of Blepharidopterus angulatus (Heteroptera: Miridae) as a predator of the lime aphid, Eucallipterus tiliae. Entomologia Experimentalis et Applicata, 16, 255–267.
Godfray, H. C. J. (1994). Parasitoids: Behavioral and evolutionary ecology. Princeton University Press.
Godfray, H. C. J., & Hassell, M. P. (1991). Encapsulation and host-parasitoid population biology. In C. A. Toft, A. Aeschlimann, & L. Bolis (Eds.), Parasite-host associations (pp. 131–147). Oxford University Press.
Goldson, S. L., Proffitt, J. B., & Baird, D. B. (1998). Establishment and phenology of the parasitoid Microctonus hyperodae (Hymenoptera: Braconidae) in New Zealand. Environmental Entomology, 27, 1386–1392.
González-Tokman, D., Córdoba-Aguilar, A., Dáttilo, W., Lira-Noriega, A., Sánchez-Guillén, R. A., & Villalobos, F. (2020). Insect responses to heat: Physiological mechanisms, evolution and ecological implications in a warming world. Biological Reviews, 95, 802–821.
Goodenough, J. L., Hartsack, A. W., & King, E. G. (1983). Developmental models for Trichogramma pretiosum (Hymenoptera: Trichogrammatidae) reared on four hosts. Journal of Economic Entomology, 76, 1095–1102.
Grbić, M., & Strand, M. R. (1998). Shifts in the life history of parasitic wasps correlate with pronounced alterations in early development. Proceedings of the National Academy of Sciences USA, 95, 1097–1101.
Greany, P. D., Hawke, S. D., Carlysle, T. C., & Anthony, D. W. (1977). Sense organs in the ovipositor of Biosteres (Opius) longicaudatus, a parasite of the Caribbean fruit fly Anastrepha suspensa. Annals of the Entomological Society of America, 70, 319–321.
Greenblatt, J. A., Barbosa, P., & Montgomery, M. E. (1982). Host’s diet effects on nitrogen utilization efficiency for two parasitoid species: Brachymeria intermedia and Coccygomimus turionellae. Physiological Entomology, 7, 263–267.
Greenfield, M. D., & Karandinos, M. G. (1976). Fecundity and longevity of Synanthedon pictipes under constant and fluctuating temperatures. Environmental Entomology, 5, 883–887.
Gresens, S. E., Cothran, M. L., & Thorp, J. H. (1982). The influence of temperature on the functional response of the dragonfly Celithemis fasciata (Odonata: Libellulidae). Oecologia, 53, 281–284.
Gribbin, S. D., & Thompson, D. J. (1990). Asymmetric intraspecific competition among larvae of the damselfly Ischnura elegans (Zygoptera: Coenagrionidae). Ecological Entomology, 15, 37–42.
Griffith, D. M., & Poulson, T. L. (1993). Mechanisms and consequences of intraspecific competition in a carabid cave beetle. Ecology, 74, 1373–1383.
Griffiths, D. (1980). The feeding biology of ant-lion larvae: Growth and survival in Morter obscitrus. Oikos, 34, 364–370.
Griffiths, D. (1992). Interference competition in antlion (Macroleon quinquemaculatus) larvae. Ecological Entomology, 17, 219–226.
Grosman, A. H., Janssen, A., De Brito, E. F., Cordeiro, E. G., Colares, F., Fonseca, J. O., Lima, E. R., Pallini, A., & Sabelis, M. W. (2008). Parasitoid increases survival of its pupae by inducing hosts to fight predators. PLoS ONE, 3, e2276.
Grubisic, M., van Grunsven, R. H., Kyba, C. C., Manfrin, A., & Hölker, F. (2018). Insect declines and agroecosystems: Does light pollution matter? Annals of Applied Biology, 173, 180–189.
Gunasena, G. H., Vinson, S. B., & Williams, H. J. (1990). Effects of nicotine on growth, development, and survival of the tobacco budworm (Lepidoptera: Noctuidae) and the parasitoid Campoletis sonorensis (Hymenoptera: Ichneumonidae). Journal of Economic Entomology, 83, 1777–1782.
Gutierrez, A. P. (1970). Studies on host selection and host specificity of the aphid hyperparasite Charips victrix (Hymenoptera: Cynipidae). 6. Description of sensory structures and a synopsis of host selection and host specificity. Annals of the Entomological Society of America, 63, 1705–1709.
Häckermann, J., Rott, A. S., & Dorn, S. (2007). How two different host species influence the performance of a gregarious parasitoid: Host size is not equal to host quality. Journal of Animal Ecology, 76, 376–383.
Hag Ahmed, S. E. M. K. (1989). Biological control of glasshouse Myzus persicae (Sulzer) using Aphidius matricariae Haliday. PhD thesis, Wye College, University of London, UK.
Hagen, K. (1964). Developmental stages of parasites. In P. DeBach (Ed.), Biological control of insect pests and weeds (pp. 168–246). Chapman and Hall.
Hagen, K. S. (1986). Ecosystem analysis: Plant cultivars (HPR), entomophagous species and food supplements. In D. J. Boethel & R. D. Eikenbary (Eds.), Interactions of plant resistance and parasitoids and predators of insects (pp. 151–197). Ellis Horwood.
Hågvar, E. B. (1972). The effect of intra- and interspecific larval competition for food (Myzus persicae) on the development at 20ºC of Syrphus ribesii and Syrphus corollae (Diptera: Syrphidae). Entomophaga, 17, 71–77.
Hågvar, E. B. (1973). Food consumption in larvae of Syrphus ribesii (L.) and Syrphus corollae (Fabr.) (Dipt., Syrphidae). Norsk Entomologisk Tiddskrift, 201, 315–321.
van Handel, E. (1984). Metabolism of nutrients in the adult mosquito. Mosquito News, 44, 573–579.
van Handel, E. (1985a). Rapid determination of glycogen and sugars in mosquitoes. Journal of the American Mosquito Association, 1, 299–301.
van Handel, E. (1985b). Rapid determination of lipids in mosquitoes. Journal of the American Mosquito Association, 1, 302–304.
van Handel, E., & Day, J. F. (1988). Assay of lipids, glycogen and sugars in individual mosquitoes: Correlations with wing length in field-collected Aedes vexans. Journal of the American Mosquito Association, 4, 549–550.
Hardy, I. C. W., & Godfray, H. C. J. (1990). Estimating the frequency of constrained sex allocation in field populations of Hymenoptera. Behaviour, 114, 137–147.
Hardy, I. C. W., Griffiths, N. T., & Godfray, H. C. J. (1992). Clutch size in a parasitoid wasp: A manipulation experiment. Journal of Animal Ecology, 61, 121–129.
Hariri, G. E. (1966). Laboratory studies on the reproduction of Adalia bipunctata (Coleoptera: Coccinellidae). Entomologia Experimentalis et Applicata, 9, 200–204.
Harvey, J. A. (2000). Dynamic effects of parasitism by an endoparasitoid wasp on the development of two host species: Implications for host quality and parasitoid fitness. Ecological Entomology, 25, 267–278.
Harvey, J. A. (2005). Factors affecting the evolution of development strategies in parasitoid wasps: The importance of functional constraints and incorporating complexity. Entomologia Experimentalis et Applicata, 117, 1–13.
Harvey, J. A. (2008). Comparing and contrasting development and reproductive strategies in the pupal hyperparasitoids Lysibia nana and Gelis agilis (Hymenoptera: Ichneumonidae). Evolutionary Ecology, 22, 153–166.
Harvey, J. A. (2021). Prey availability affects developmental trade-offs and sexual-size dimorphism in the false widow spider, Steatoda grossa. Journal of Insect Physiology, 136, 104267.
Harvey, J. A., & Gols, G. J. Z. (1998). The influence of host quality on progeny and sex allocation in the pupal ectoparasitoid, Muscidifurax raptorellus (Hymenoptera: Pteromalidae). Bulletin of Entomological Research, 88, 299–304.
Harvey, J. A., & Gols, R. (2018). Effects of plant-mediated differences in host quality on the development of two related endoparasitoids with different host-utilization strategies. Journal of Insect Physiology, 107, 110–115.
Harvey, J. A., & Malcicka, M. (2016). Nutritional integration between insect hosts and koinobiont parasitoids in an evolutionary framework. Entomologia Experimentalis et Applicata, 159, 181–188.
Harvey, J. A., & Strand, M. R. (2002). The developmental strategies of endoparasitoid wasps vary with host feeding ecology. Ecology, 83, 2439–2451.
Harvey, J. A., & Thompson, D. J. (1995). Developmental interactions between the solitary endoparasitoid Venturia canescens (Hymenoptera, Ichneumonidae) and 2 of its hosts, Plodia interpunctella and Corcyra cephalonica (Lepidoptera: Pyralidae). European Journal of Entomology, 92, 427–435.
Harvey, J. A., & Vet, L. E. M. (1997). Venturia canescens parasitizing Galleria mellonella and Anagasta kuehniella: Differing suitability of two hosts with highly variable growth potential. Entomologia Experimentalis et Applicata, 84, 93–100.
Harvey, J. A., Vet, L. E. M., Jiang, N., & Gols, R. (1998). Nutritional ecology of the interaction between larvae of the gregarious ectoparasitoid, Muscidifurax raptorellus (Hymenoptera: Pteromalidae), and their pupal host, Musca domestica (Diptera: Muscidae). Physiological Entomology, 23, 113–120.
Harvey, J. A., Bezemer, T. M., Elzinga, J. A., & Strand, M. R. (2004). Development of the solitary endoparasitoid Microplitis demolitor: Host quality does not increase with host age and size. Ecological Entomology, 29, 35–43.
Harvey, J. A., Bezemer, T. M., Gols, R., Nakamatsu, Y., & Tanaka, T. (2008a). Comparing the physiological effects and function of larval feeding in closely-related endoparasitoids (Braconidae: Microgastrinae). Physiological Entomology, 33, 217–225.
Harvey, J. A., Corley, L. S., & Strand, M. R. (2000a). Competition induces adaptive shifts in caste ratios of a polyembryonic wasp. Nature, 406, 183–186.
Harvey, J. A., Gols, R., & Strand, M. R. (2009a). Intrinsic competition and its effects on the survival and development of three species of endoparasitoid wasps. Entomologia Experimentalis et Applicata, 130, 238–248.
Harvey, J. A., Harvey, I. F., & Thompson, D. J. (1993). The effect of superparasitism on development of the solitary parasitoid wasp, Venturia canescens (Hymenoptera: Ichneumonidae). Ecological Entomology, 18, 203–208.
Harvey, J. A., Harvey, I. F., & Thompson, D. J. (1994). Flexible larval feeding allows use of a range of host sizes by a parasitoid wasp. Ecology, 75, 1420–1428.
Harvey, J. A., Harvey, I. F., & Thompson, D. J. (2001). Lifetime reproductive success in the solitary endoparasitoid, Venturia canescens. Journal of Insect Behavior, 14, 573–593.
Harvey, J. A., Heinen, R., Gols, R., & Thakur, M. P. (2020). Climate change-mediated temperature extremes and insects: From outbreaks to breakdowns. Global Change Biology, 26, 6685–6701.
Harvey, J. A., Jervis, M. A., Gols, R., Jiang, N., & Vet, L. E. M. (1999). Development of the parasitoid, Cotesia rubecula (Hymenoptera: Braconidae) in Pieris rapae and Pieris brassicae (Lepidoptera: Pieridae): Evidence for host regulation. Journal of Insect Physiology, 45, 173–182.
Harvey, J. A., Kadash, K., & Strand, M. R. (2000b). Differences in larval feeding behavior correlate with altered developmental strategies in two parasitic wasps: Implications for the size-fitness hypothesis. Oikos, 88, 621–629.
Harvey, J. A., Kos, M., Nakamatsu, Y., Tanaka, T., Dicke, M., Vet, L. E. M., Brodeur, J., & Bezemer, T. M. (2008b). Do parasitized caterpillars protect their parasitoids from hyperparasitoids? A test of the ‘usurpation hypothesis.’ Animal Behaviour, 76, 701–708.
Harvey, J. A., Molina, A. C., Bezemer, T. M., & Malcicka, M. (2015). Convergent development of a parasitoid wasp on three host species with differing mass and growth potential. Entomologia Experimentalis et Applicata, 154, 15–22.
Harvey, J. A., Poelman, E. H., & Tanaka, T. (2013a). Intrinsic inter- and intraspecific competition in parasitoid wasps. Annual Review of Entomology, 58, 333–351.
Harvey, J. A., Sano, T., & Tanaka, T. (2010). Differential host growth regulation by the solitary endoparasitoid, Meteorus pulchricornis in two hosts of greatly differing mass. Journal of Insect Physiology, 56, 1178–1183.
Harvey, J. A., Tanaka, T., Kruidhof, M., Vet, L. E. M., & Gols, R. (2011). The ‘usurpation hypothesis’ revisited: Dying caterpillar repels attack from a hyperparasitoid wasp. Animal Behaviour, 81, 1281–1287.
Harvey, J. A., van Dam, N. M., & Gols, R. (2003). Interactions over four trophic levels: Foodplant quality affects development of a hyperparasitoid as mediated through a herbivore and its primary parasitoid. Journal of Animal Ecology, 72, 520–531.
Harvey, J. A., van Dam, N. M., Witjes, L. M., Soler, R., & Gols, R. (2007). Effects of dietary nicotine on the development of an insect herbivore, its parasitoid and secondary hyperparasitoid over four trophic levels. Ecological Entomology, 32, 15–23.
Harvey, J. A., van Nouhuys, S., & Biere, A. (2005). Effects of quantitative variation in allelochemicals in Plantago lanceolata on development of a generalist and a specialist herbivore and their endoparasitoids. Journal of Chemical Ecology, 31, 287–302.
Harvey, J. A., Vet, L. E. M., Witjes, L. M., & Bezemer, T. M. (2006). Remarkable similarity in body mass of a secondary hyperparasitoid Lysibia nana and its primary parasitoid host Cotesia glomerata emerging from cocoons of comparable size. Archives of Insect Biochemistry and Physiology: Published in Collaboration with the Entomological Society of America, 61, 170–183.
Harvey, J. A., Visser, B., Le Lann, C., De Boer, J., Ellers, J., & Gols, R. (2014). Convergence and divergence in direct and indirect life-history traits of closely related parasitoids (Braconidae: Microgastrinae). Evolutionary Biology, 41, 134–144.
Harvey, J. A., Wagenaar, R., & Bezemer, T. M. (2009b). Interactions to the fifth trophic level: Secondary and tertiary parasitoid wasps show extraordinary efficiency in utilizing host resources. Journal of Animal Ecology, 78, 686–692.
Harvey, J. A., Weber, D., De Clercq, P., & Gols, R. (2013b). A bodyguard or a tastier meal? Dying caterpillar indirectly protects parasitoid cocoons by offering alternate prey to a generalist predator. Entomologia Experimentalis et Applicata, 149, 219–228.
Hassell, M. P. (1968). The behavioural response of a tachinid fly (Cyzenis albicans [Fall.]) to its host, the winter moth (Operophtera brumata [L.]). Journal of Animal Ecology, 37, 627–639.
Hassell, M.P. (1978) The Dynamics of Arthropod Predator-prey Systems. Monographs in Population Biology, 13. Princeton University Press, Princeton.
Hattingh, V., & Samways, M. J. (1990). Absence of interference during feeding by the predatory ladybirds Chilocorus spp. (Coleoptera: Coccinellidae). Ecological Entomology, 151, 385–390.
Havill, N. P., & Raffa, K. F. (2000). Compound effects of induced plant responses on insect herbivores and parasitoids: Implications for tritrophic interactions. Ecological Entomology, 25, 171–179.
Hawke, S. D., Farley, R. D., & Greany, P. D. (1973). The fine structure of sense organs in the ovipositor of the parasitic wasp, Orgilus lepidus Muesebeck. Tissue and Cell, 5, 171–184.
Heads, P. A. (1986). The costs of reduced feeding due to predator avoidance: Potential effects on growth and fitness in Ischnura elegans larvae (Odonata: Zygoptera). Ecological Entomology, 11, 369–377.
Heaversedge, R. C. (1967). Variation in the size of insect parasites of puparia of Glossina spp. Bulletin of Entomological Research, 58, 153–158.
Heidari, M. (1989). Biological control of glasshouse mealybugs using coccinellid predators. PhD thesis, Wye College, University of London, UK.
Heidari, M., & Copland, M. J. W. (1993). Honeydew–a food resource or arrestant for the mealybug predator Cryptolaemus montrouzieri. Entomophaga, 38, 63–68.
Heimpel, G. E. (2019). Linking parasitoid nectar feeding and dispersal in conservation biological control. Biological Control, 132, 36–41.
Heimpel, G. E., & Casas, J. (2008). Parasitoid foraging and oviposition behavior in the field. In E. Wajnberg, C. Bernstein, & J. J. M. van Alphen (Eds.), Behavioral ecology of insect parasitoids: From theoretical approaches to field applications (pp. 51–70). Blackwell Publishing.
Heimpel, G. E., & Collier, T. R. (1996). The evolution of host-feeding behaviour in insect parasitoids. Biological Reviews, 71, 373–400.
Heimpel, G. E., & Jervis, M. A. (2004). An evaluation of the hypothesis that floral nectar improves biological control by parasitoids. In F. Wäckers, P. van Rijn, & J. Bruin (Eds.), Plant-provided food and plant-carnivore mutualisms. Cambridge University Press.
Heimpel, G. E., & Rosenheim, J. A. (1995). Dynamic host feeding by the parasitoid Aphytis melinus: The balance between current and future reproduction. Journal of Animal Ecology, 64, 153–167.
Heimpel, G. E., & Rosenheim, J. A. (1998). Egg limitation in parasitoids: A review of the evidence and a case study. Biological Control, 11, 160–168.
Heimpel, G. E., Neuhauser, C., & Hoogendoorn, M. (2003). Effects of parasitoid fecundity and host resistance on indirect interactions among hosts sharing a parasitoid. Ecological Letters, 6, 556–566.
Heimpel, G. E., Rosenheim, J. A., & Mangel, M. (1997a). Predation on adult Aphytis parasitoids in the field. Oecologia, 110, 346–352.
Heimpel, G. E., Rosenheim, J. A., & Kattari, D. (1997b). Adult feeding and lifetime reproductive success in the parasitoid Aphytis melinus. Entomologia Experimentalis et Applicata, 83, 305–315.
Heinz, K. M., & Parrella, M. P. (1990). Holarctic distribution of the leafminer parasitoid Diglyphus begini (Hymenoptera: Eulophidae) and notes on its life history attacking Liriomyza trifolii (Diptera: Agromyzidae) in chrysanthemum. Annals of the Entomological Society of America, 83, 916–924.
Hemerik, L., & Harvey, J. A. (1999). Flexible larval development and the timing of destructive feeding by a solitary endoparasitoid: An optimal foraging problem in evolutionary perspective. Ecological Entomology, 24, 308–315.
Hemptinne, J.-L., Dixon, A. F. G., & Gauthier, C. (2000). Nutritive cost of intraguild predation on eggs of Coccinella septempuncata and Adalia bipunctata (Coleoptera: Coccinellidae). European Journal of Entomology, 97, 559–562.
Hentz, M. G., Ellsworth, P. C., Naranjo, S. E., & Watson, T. F. (1998). Development, longevity, and fecundity of Chelonus sp. nr curvimaculatus (Hymenoptera: Braconidae), an egg-larval parasitoid of pink bollworm (Lepidoptera: Gelechiidae). Environmental Entomology, 27, 443–449.
Hérard, F., Keller, M. A., & Lewis, W. J. (1988). Rearing Microplitis demolitor Wilkinson (Hymenoptera: Braconidae) in the laboratory for use in studies of semiochemical mediated searching behaviour. Journal of Entomological Science, 23, 105–111.
Heraty, J. M., & Quicke, D. L. J. (2003). Phylogenetic implications of ovipositor structure in Eucharitidae and Perilampidae (Hymenoptera: Chalcidoidea). Journal of Natural History, 37, 1751–1764.
Herniou, E. A., Huguet, E., Thézé, J., Bézier, A., Periquet, G., & Drezen, J. M. (2013). When parasitic wasps hijacked viruses: Genomic and functional evolution of polydnaviruses. Philosophical Transactions of the Royal Society of London B, 368, 20130051.
Herrera, C. J., Van Driesche, R. G., & Bellotti, A. C. (1989). Temperature-dependent growth rates for the cassava mealybug, Phenacoccus herreni, and two of its encyrtid parasitoids, Epidinocarsis diversicornis and Acerophagus coccois in Colombia. Entomologia Experimentalis et Applicata, 50, 21–27.
Hodek, I. (1973). Biology of coccinellidae. W. Junk, The Hague/Czechoslovakian Academy of Sciences, Prague.
Hodek, I., & Hodková, M. (1988). Multiple role of temperature during insect diapause: A review. Entomologia Experimentalis et Applicata, 49, 153–165.
van der Hoeven, N., & Hemerik, L. (1990). Superparasitism as an ESS: To reject or not to reject, that is the question. Journal of Theoretical Biology, 146, 467–482.
Hohmann, C. L., Luck, R. F., Oatman, E. R., & Platner, C. R. (1989). Effects of different biological factors on longevity and fecundity of Trichogramma platneri Nagarkatti (Hymenoptera: Trichogrammatidae). Anais da Sociedade Entomologica do Brasil, 18, 61–70.
Holling, C. S. (1966). The functional response of invertebrate predators to prey density. Memoirs of the Entomological Society of Canada, 48, 1–86.
Honek, A., Martinková, Z., Dixon, A. F. G., Skuhrovec, J., Roy, H. E., Brabec, M., & Pekár, S. (2018). Life cycle of Harmonia axyridis in central Europe. BioControl, 63, 241–252.
Hooker, M. E., Barrows, E. M., & Ahmed, S. W. (1987). Adult longevity as affected by size, sex, and maintenance in isolation or groups in the parasite Pediobius foveolatus (Hymenoptera: Eulophidae). Annals of the Entomological Society of America, 80, 655–659.
Hopper, K. R., Crowley, P. H., & Kielman, D. (1996). Density dependence, hatching synchrony, and within-cohort cannibalism in young dragonfly larvae. Ecology, 77, 191–200.
Horne, P. A., & Horne, J. A. (1991). The effects of temperature and host density on the development and survival of Copidosoma koehleri. Entomologia Experimentalis et Applicata, 59, 289–292.
Horton, D. R., Hinojosa, T., & Olson, S. R. (1998). Effects of photoperiod and prey type on diapause tendency and preoviposition period in Perillus bioculatus (Hemiptera: Pentatomidae) Canadian Entomologist, 130, 315–320.
Howe, A. G., Ravn, H. P., Pipper, C. B., & Aebi, A. (2016). Potential for exploitative competition, not intraguild predation, between invasive harlequin ladybirds and flowerbugs in urban parks. Biological Invasions, 18, 517–532.
Howe, R. W. (1967). Temperature effects on embryonic development in insects. Annual Review of Entomology, 12, 15–42.
Huang, F., Shi, M., Chen, Y. F., Cao, T. T., & Chen, X. X. (2008). Oogenesis of Diadegma semiclausum (Hymenoptera: Ichneumonidae) and its associated polydnavirus. Microscopy Research and Technique, 71, 676–683.
Huber, B. A., Sinclair, B. J., & Schmitt, M. (2007). The evolution of asymmetric genitalia in spiders and insects. Biological Reviews, 82, 647–698.
Hufbauer, R. A. (2001). Pea aphid-parasitoid interactions: Have parasitoids adapted to differential resistance? Ecology, 82, 717–725.
Ibrahim, M. M. (1955). Studies on Coccinella undecimpunctata aegyptiaca Reiche 2. Biology and life-history. Bulletin de la Societé Entomologique d’Egypte, 39, 395–423.
Iperti, G. (1966). Some components of efficiency in aphidophagous coccinellids. In I. Hodek (Ed.), Ecology of aphidophagous insects (p. 253). Academia and W. Junk.
Ishii, M., Sato, Y., & Tagawa, J. (2000). Diapause in the braconid wasp, Cotesia glomerata (L.) II. Factors inducing and terminating diapause. Entomological Science, 3, 201–206.
Ives, P. M. (1981). Feeding and egg production of two species of coccinellids in the laboratory. Canadian Entomologist, 113, 999–1005.
Iwao, K., & Ohsaki, N. (1996). Inter- and intraspecific interactions among larvae of specialist and generalist parasitoids. Researches on Population Ecology, 38, 265–273.
Iwata, K. (1959). The comparative anatomy of the ovary in Hymenoptera. Part 3. Braconidae (including Aphidiidae) with descriptions of ovarian eggs. Kontyû, 27, 231–238.
Iwata, K. (1960). The comparative anatomy of the ovary in Hymenoptera. Part 5. Ichneumonidae. Acta Hymenopterologica, 1, 115–169.
Iwata, K. (1962). The comparative anatomy of the ovary in Hymenoptera. Part 6. Chalcidoidea with descriptions of ovarian eggs. Acta Hymenopterologica, 1, 383–391.
Jackson, C. G. (1986). Effects of cold storage of adult Anaphes ovijentatus on survival, longevity, and oviposition. Southwestern Entomologist, 11, 149–153.
Jackson, D. J. (1928). The biology of Dinocampus (Perilitus) rutilus Nees, a braconid parasite of Sitona lineata L. Part 1. Proceedings of the Zoological Society of London, 1928, 597–630.
Jayanth, K. P., & Bali, G. (1993). Diapause behavior of Zygogramma bicolorata (Coleoptera: Chrysomelidae), a biological control agent for Parthenium hysterophorus (Asteraceae), in Bangalore, India. Bulletin of Entomological Research, 83, 383–388.
Jervis, M. A. (1980). Life history studies of Aphelopus species (Hymenoptera: Dryinidae) and Chalarus species (Diptera: Pipunculidae), primary parasites of typhlocybine leafhoppers (Homoptera: Cicadellidae). Journal of Natural History, 14, 769–780.
Jervis, M. A. (1992). A taxonomic revision of the pipunculid fly genus Chalarus Walker, with particular reference to the European fauna. Zoological Journal of the Linnean Society, 105, 243–352.
Jervis, M. A., & Kidd, N. A. C. (1986). Host-feeding strategies in hymenopteran parasitoids. Biological Reviews, 61, 395–434.
Jervis, M. A., & Kidd, N. A. C. (1999). Parasitoid nutritional ecology: Implications for biological control. In B. A. Hawkins & H. V. Cornell (Eds.), Theoretical approaches to biological control (pp. 131–151). Cambridge University Press.
Jervis, M. A., Ellers, J., & Harvey, J. A. (2008). Resource acquisition, allocation, and utilization in parasitoid reproductive strategies. Annual Review of Entomology, 53, 361–385.
Jervis, M. A., Ferns, P. N., & Heimpel, G. E. (2003). Body size and the timing of egg production in parasitoid wasps: A comparative analysis. Functional Ecology, 17, 375–383.
Jervis, M. A., Heimpel, G. E., Ferns, P. N., Harvey, J. A., & Kidd, N. A. C. (2001). Life-history strategies in parasitoid wasps: A comparative analysis of ‘ovigeny.’ Journal of Animal Ecology, 70, 442–458.
Jervis, M. A., Kidd, N. A. C., & Almey, H. A. (1994). Post-reproductive life in the parasitoid Bracon hebetor (Say) (Hym., Braconidae). Journal of Applied Entomology, 117, 72–77.
Jervis, M. A., Lee, J. C., & Heimpel, G. E. (2004). Use of behavioural and life-history studies to understand the effects of habitat manipulation. In G. Gurr, S. D. Wratten, & M. Altieri (Eds.), Ecological engineering for pest management (pp. 65–100). CSIRO Press.
Jespersen, L. B., & Toft, S. (2003). Compensatory growth following early nutritional stress in the wolf spider Pardosa prativaga. Functional Ecology, 17, 737–746.
Johnson, D. M., Akre, B. C., & Crowley, P. H. (1975). Modeling arthropod predation: Wasteful killing by damselfly naiads. Ecology, 36, 1081–1093.
Johnson, D. M., Bohanan, R. E., Watson, C. N., & Martin, T. H. (1984). Coexistence of Enallagma divagans and Enallagma traviatum (Zygoptera: Coenagrionidae) in Bays Mountain Lake: An in situ enclosure experiment. Advances in Odonatology, 2, 57–70.
Johnson, J. C., Trubl, P. J., & Miles, L. S. (2012). Black widows in an urban desert: City-living compromises spider fecundity and egg investment despite urban prey abundance. The American Midland Naturalist, 168, 333–340.
Jones, R. L., & Lewis, W. J. (1971). Physiology of the host-parasite relationship between Heliothis zea and Microplitis croceipes. Journal of Insect Physiology, 17, 921–927.
de Jong, P. W., & van Alphen, J. J. M. (1989). Host size selection and sex allocation in Leptomastix dactylopii, a parasitoid of Planococcus citri. Entomologia Experimentalis et Applicata, 50, 161–169.
Jucker, C., Hardy, I. C. W., de Milato, S., Zen, G., Malabusini, S., Savoldelli, S., & Lupi, D. (2020). Factors affecting the reproduction and mass-rearing of Sclerodermus brevicornis (Hymenoptera: Bethylidae), a natural enemy of exotic flat-faced longhorn beetles (Coleoptera: Cerambycidae: Lamiinae). Insects, 11, 657.
Juliano, S. A. (1985). The effects of body size on mating and reproduction in Brachinus lateralis (Coleoptera: Carabidae). Ecological Entomology, 10, 271–280.
Kaitala, A. (1988). Wing muscle dimorphism: Two reproductive pathways of the waterstrider Gerris thoracicus in relation to habitat instability. Oikos, 53, 222–228.
Kaitala, A. (1991). Phentotypic plasticity in reproductive behaviour of waterstriders: Trade-offs between reproduction and longevity during food stress. Functional Ecology, 5, 12–18.
Kaitala, A., & Huldén, L. (1990). Significance of spring migration and flexibility in flight muscle histolysis in waterstriders (Heteroptera, Gerridae). Ecological Entomology, 15, 409–418.
Kajita, H., & van Lenteren, J. C. (1982). The parasite-host relationship between Encarsia formosa (Hymenoptera: Aphelinidae) and Trialeurodes vaporariorum (Homoptera: Aleyrodidae), XIII. Effect of low temperatures on egg maturation of Encarsia formosa. Zeitschrift für Angewandte Entomologie, 93, 430–439.
Kalinkat, G., Rall, B. C., Björkman, C., & Niemelä, P. (2015). Effects of climate change on the interactions between insect pests and their natural enemies. In Climate Change and Insect Pests (pp. 74–91). CABI.
Kapranas, A., & Luck, R. F. (2008). Egg maturation, host feeding, and longevity in two Metaphycus parasitoids of soft scale insects. Biological Control, 47, 147–153.
Karban, R. (1998). Caterpillar basking behaviour and nonlethal parasitism by tachinid flies. Journal of Insect Behavior, 11, 713–723.
Karban, R., & Baldwin, I. T. (1997). Induced responses to herbivory. University of Chicago Press.
Karban, R., & English-Loeb, G. (1997). Tachinid parasitoids affect host plant choice by caterpillars to increase caterpillar survival. Ecology, 78, 603–611.
Karlsson, B., & Wickman, P.-O. (1989). The cost of prolonged life: An experiment on a nymphalid butterfly. Functional Ecology, 3, 399–405.
Karowe, D. N., & Martin, M. M. (1989). The effects of quantity and quality of diet nitrogen on the growth, efficiency of food utilisation, nitrogen budget, and metabolic rate of fifth-instar Spodoptera eridania larvae (Lepidoptera: Noctuidae). Journal of Insect Physiology, 35, 699–708.
Kasamatsu, E., & Abe, J. (2015). Influence of body size on fecundity and sperm management in the parasitoid wasp Anisopteromalus calandrae. Physiological Entomology, 40, 223–231.
Katsoyannos, P. (1984). The establishment of Rhizobius forestieri (Col, Coccinellidae) in Greece and its efficiency as an auxiliary control agent against a heavy infestation of Saissetia oleae (Hom, Coccidae). Entomophaga, 29, 387–397.
Katsoyannos, P., Kontodimas, D. C., & Stathas, G. J. (1997). Summer diapause and winter quiescence of Coccinella septempunctata (Col., Coccinellidae) in central Greece. Entomophaga, 42, 483–491.
Kawauchi, S. E. (1985). Effects of photoperiod on the induction of diapause, the live weight of emerging adult and the duration of development of three species of aphidophagous coccinellids (Coleoptera: Coccinellidae). Kontyû, 53, 536–546.
Kazmer, D. J., & Luck, R. F. (1995). Field tests of the size-fitness hypothesis in the egg parasitoid Trichogramma pretiosum. Ecology, 76, 412–415.
Kerkut, G. A., Gilbert, L. I. (1985). Comprehensive insect physiology, biochemistry and pharmacology. Vol. 1. Embryogenesis and reproduction. Pergamon.
Kessler, A., & Kalske, A. (2018). Plant secondary metabolite diversity and species interactions. Annual Review of Ecology, Evolution, and Systematics, 49, 115–138.
Kfir, R. (1981). Fertility of the polyembryonic parasite Copidosoma koehleri, effect of humidities on life length and relative abundance as compared with that of Apanteles subandinus in potato tuber moth. Annals of Applied Biology, 99, 225–230.
Kfir, R., & Luck, R. F. (1979). Effects of constant and variable temperature extremes on sex ratio and progeny production by Aphytis melinus and A. lingnanensis (Hymenoptera: Aphelinidae). Ecological Entomology, 4, 335–344.
Kfir, R., & van Hamburg, H. (1988). Interspecific competition between Telenomus ullyetti (Hymenoptera: Scelionidae) and Trichogramma lutea (Hymenoptera: Trichogrammatidae) parasitizing eggs of the cotton bollworm Heliothis armigera in the laboratory. Environmental Entomology, 17, 664–670.
Kidd, N. A. C., & Jervis, M. A. (1991). Host-feeding and oviposition strategies of parasitoids in relation to host stage. Researches on Population Ecology, 33, 13–28.
Kiman, Z. B., & Yeargan, K. V. (1985). Development and reproduction of the predator Orius insidiosus (Hemiptera: Anthocoridae) reared on diets of selected plant material and arthropod prey. Annals of the Entomological Society of America, 78, 464–467.
Kindlmann, P., Dixon, A. F. G., & Dostálková, I. (2001). Role of ageing and temperature in shaping reaction norms and fecundity functions in insects. Journal of Evolutionary Biology, 14, 835–840.
King, B. H., & King, R. B. (1994). Sex-ratio manipulation in response to host size in the parasitoid wasp Spalangia cameroni–is it adaptive? Behavioral Ecology, 5, 448–454.
King, P. E. (1963). The rate of egg resorption in Nasonia vitripennis (Walker) (Hymenoptera: Pteromalidae) deprived of hosts. Proceedings of the Royal Entomological Society of London A, 38, 98–100.
King, P. E., & Copland, M. J. W. (1969). The structure of the female reproductive system in the Mymaridae (Chalcidoidea: Hymenoptera). Journal of Natural History, 3, 349–365.
King, P. E., & Fordy, M. R. (1970). The external morphology of the ‘pore’ structures on the tip of the ovipositor in Hymenoptera. Entomologist’s Monthly Magazine, 106, 65–66.
King, P. E., & Ratcliffe, N. A. (1969). The structure and possible mode of functioning of the female reproductive system in Nasonia vitripennis (Hymenoptera: Pteromalidae). Journal of Zoology, 157, 319–344.
King, P. E., & Richards, J. G. (1968). Oösorption in Nasonia vitriperinis (Hymenoptera: Pteromalidae). Journal of Zoology, 54, 495–516.
King, P. E., & Richards, J. G. (1969). Oögenesis in Nasonia vitripennis (Walker) (Hymenoptera: Pteromalidae). Proceedings of the Royal Entomological Society, London A, 44, 143–157.
King, P. E., Ratcliffe, N. A., & Fordy, M. R. (1971). Oögenesis in a Braconid, Apanteles glomeratus (L.) possessing an hydropic type of egg. Zeitschrift für Zellforschung und Mikroskopische Anatomie, 119, 43–57.
Kitching, R. C. (1977). Time resources and population dynamics in insects. Australian Journal of Ecology, 2, 31–42.
Kobayashi, M., & Ishikawa, H. (1993). Breakdown of indirect flight muscles of alate aphids (Acyrthosiphon pisum) in relation to their flight, feeding and reproductive behaviour. Journal of Insect Physiology, 39, 549–554.
Kogan, M., & Parra, J. R. P. (1981). Techniques and applications of measurements of consumption and utilization of food by phytophagous insects. In G. Bhaskaran, S. Friedman, & J. G. Rodriguez (Eds.), Current topics in insect endocrinology and nutrition (pp. 337–352). Plenum Press.
Kopelman, A. H., & Chabora, P. C. (1992). Resource availability and life-history parameters of Leptopilina boulardi (Hymenoptera: Eucoilidae). Annals of the Entomological Society of America, 85, 195–199.
Kozanek, M., & Belcari, A. (1997). Structure of the ovipositor, associated sensilla and spermathecal system of entomoparasitic pipunculid flies (Diptera: Pipunculidae). Journal of Natural History, 31, 1273–1288.
Kraaijeveld, A. R., & van Alphen, J. J. M. (1994). Geographical variation in resistance of the parasitoid Asobara tabida against encapsulation by Drosophila melanogaster larvae: The mechanism explored. Physiological Entomology, 19, 9–14.
Kraaijeveld, A. R., & van Alphen, J. J. M. (1995a). Geographical variation in encapsulation ability of Drosophila melanogaster larvae and evidence for parasitoid-specific components. Evolutionary Ecology, 9, 10–17.
Kraaijeveld, A. R., & van Alphen, J. J. M. (1995b). Variation in diapause and sex ratio in the parasitoid Asobara tabida. Entomologia Experimentalis et Applicata, 74, 259–265.
Kraaijeveld, A. R., Hutcheson, K. A., Limentani, E. C., & Godfray, H. C. J. (2001). Costs of counterdefences to host resistance in a parasitoid of Drosophila. Evolution, 55, 1815–1821.
Kraaijeveld, A. R., van Alphen, J. J. M., & Godfray, H. C. J. (1998). The coevolution of host resistance and parasitoid virulence. Parasitology, 116, 29–45.
Krishnamoorthy, A. (1984). Influence of adult diet on the fecundity and survival of the predator, Chrysopa scelestes (Neur.: Chrysopidae). Entomophaga, 29, 445–450.
Krishnamoorthy, A. (1989). Effect of cold storage on the emergence and survival of the adult exotic parasitoid, Leptomastix dactylopii How. (Hym., Encyrtidae). Entomon, 14, 313–318.
Kruse, K. C. (1983). Optimal foraging by predaceous diving beetle larvae on toad tadpoles. Oecologia, 581, 383–388.
Kuja, J. O., Jackson, R. R., Sune, G. O., Karanja, R. N., Lagat, Z. O., & Carvell, G. E. (2012). Nectar meals of a mosquito-specialist spider. Psyche, 2012.
Kunkel, J. G., & Nordin, J. H. (1985). Yolk proteins. In G. A. Kerkut & L. J. Gilbert (Eds.), Comparative insect physiology, biochemistry and pharmacology (pp. 83–111). Pergamon Press.
Lampert, E. C., Dyer, L. A., & Bowers, M. D. (2010). Caterpillar chemical defense and parasitoid success: Cotesia congregata parasitism of Ceratomia catalpae. Journal of Chemical Ecology, 36, 992–998.
le Lannic, J., & Nenon, J. P. (1999). Functional morphology of the ovipositor in Megarhyssa atrata (Hymenoptera, Ichneumonidae) and its penetration into wood. Zoomorphology, 119, 73–79.
Laughlin, R. (1965). Capacity for increase: A useful population statistic. Journal of Animal Ecology, 34, 77–91.
Lauzière, I., Pérez-Lachaud, G., & Brodeur, J. (2000). Effect of female body size and adult feeding on the fecundity and longevity of the parasitoid Cephalonomia stephanoderis Betrem (Hymenoptera: Bethylidae). Annals of the Entomological Society of America, 93, 103–109.
Lavine, M. D., & Beckage, N. E. (1996). Temporal pattern of parasitism-induced immunosuppression in Manduca sexta larvae by parasitized Cotesia congregata. Journal of Insect Physiology, 42, 41–51.
Lawton, J. H. (1970). Feeding and food energy assimilation in larvae of the damselfly Pyrrhosoma nymphula (Sulz.) (Odonata: Zygoptera). Journal of Animal Ecology, 39, 669–689.
Lawton, J. H., Thompson, B. A., & Thompson, D. J. (1980). The effects of prey density on survival and growth of damsel fly larvae. Ecological Entomology, 5, 39–51.
Leather, S. R. (1988). Size, reproductive potential and fecundity in insects: Things aren’t as simple as they seem. Oikos, 51, 386–389.
Leather, S. R., Walters, K. F. A., & Bale, J. S. (1993). The ecology of insect overwintering. Cambridge University Press.
Lees, A. D. (1955). The physiology of diapause in arthropods. Cambridge University Press.
Legaspi, J. C., O’Neill, R. J., & Legaspi, B. C. (1996). Trade-offs in body weights, eggs loads and fat reserves of field-collected Podisus maculiventris (Heteroptera: Pentatomidae). Environmental Entomology, 25, 155–164.
van Lenteren, J. C. (1986). Parasitoids in the greenhouse: Successes with seasonal inoculative release systems. In J. K. Waage & D. Greathead (Eds.), Insect parasitoids (pp. 341–374). Academic Press.
van Lenteren, J. C., Isidoro, N., & Bin, F. (1998). Functional anatomy of the ovipositor clip in the parasitoid Leptopilina heterotoma (Thompson) (Hymenoptera: Eucolidae), a structure to grip escaping host larvae. International Journal of Insect Morphology and Embryology, 27, 263–268.
van Lenteren, J. C., Ruschioni, S., Romani, R., van Loon, J. J., Qiu, Y. T., Smid, H. M., Isidoro, N., & Bin, F. (2007). Structure and electrophysiological responses of gustatory organs on the ovipositor of the parasitoid Leptopilina heterotoma. Arthropod Structure and Development, 36, 271–276.
van Lenteren, J. C., van Vianen, A., Gast, H. F., & Kortenhoff, A. (1987). The parasite-host relationship between Encarsia formosa Gahan (Hymenoptera: Aphelinidae) and Trialeurodes vaporariorum (West-wood) (Homoptera: Aleyrodidae), XVI. Food effects on oögenesis, life span and fecundity of Encarsia formosa and other hymenopterous parasites. Zeitschrift für Angewandte Entomologie, 103, 69–84.
Li, D., & Jackson, R. R. (1996). How temperature affects development and reproduction in spiders: A review. Journal of Thermal Biology, 21, 245–274.
Liu, S.-S. (1985a). Development, adult size and fecundity of Aphidius sonchi reared in two instars of its aphid host, Hyperomyzus lactucae. Entomologia Experimentalis et Applicata, 37, 41–48.
Liu, S.-S. (1985b). Aspects of the numerical and functional responses of the aphid parasite, Aphidius sonchi, in the laboratory. Entomologia Experimentalis et Applicata, 37, 247–256.
Liu, W. X., Wang, W., Cheng, L. S., Guo, J. Y., & Wan, F. H. (2014). Contrasting patterns of ovarian development and oogenesis in two sympatric host-feeding parasitoids, Diglyphus isaea and Neochrysocharis formosa (Hymenoptera: Eulophidae). Applied Entomology and Zoology, 49, 305–314.
Liu, W. X., Wang, W. X., Zhang, Y. B., Wang, W., Lu, S. L., & Wan, F. H. (2015). Adult diet affects the life history and host-killing behavior of a host-feeding parasitoid. Biological Control, 81, 58–64.
Liu, Y. H., & Tsai, J. H. (2002). Effect of temperature on development, survivorship, and fecundity of Lysiphlebia mirzai (Hymenoptera: Aphidiidae), a parasitoid of Toxoptera citricida (Homoptera: Aphididae). Environmental Entomology, 31, 418–424.
Livdahl, T. P., & Sugihara, G. (1984). Non-linear interactions of populations and the importance of estimating per capita rates of change. Journal of Animal Ecology, 53, 573–580.
Logan, J. A., Wollkind, D. J., Hoyte, S. C., & Tanigoshi, L. K. (1976). An analytical model for description of temperature dependent rate phenomena in arthropods. Environmental Entomology, 5, 1133–1140.
Lohr, B., Varela, A. M., & Santos, B. (1989). Life-table studies on Epidinocarsis lopezi (DeSantis) (Hym., Encyrtidae), a parasitoid of the cassava mealybug, Phenacoccus manihoti Mat.-Ferr. (Hom., Pseudococcidae). Journal of Applied Entomology, 107, 425–434.
Lovallo, N., McPheron, B. A., & Cox-Foster, D. L. (2002). Effects of the polydnavirus of Cotesia congregata on the immune system and the development of non-habitual hosts of the parasitoid. Journal of Insect Physiology, 48, 517–526.
Lowe, E. C., Wolff, J. O., Aceves-Aparicio, A., Birkhofer, K., Branco, V. V., Cardoso, P., Chichorro, F., Fukushima, C. S., Gonçalves-Souza, T., Haddad, C. R., & Isaia, M. (2020). Towards establishment of a centralized spider traits database. The Journal of Arachnology, 48, 103–109.
Luff, M. L. (1978). Diel activity patterns of some field Carabidae. Ecological Entomology, 3, 53–62.
Lum, P. T. M., & Flaherty, B. R. (1973). Influence of continuous light on oocyte maturation in Bracon hebetor. Annals of the Entomological Society of America, 66, 355–357.
Luo, S., Zhang, F., & Wu, K. (2018). Interspecific competition between Peristenus spretus and Peristenus relictus (Hymenoptera: Braconidae), larval parasitoids of Apolygus lucorum (Hemiptera: Miridae). Biological Control, 117, 115–122.
Lupi, D., Favaro, R., Jucker, C., Azevedo, C. O., Hardy, I. C. W., & Faccoli, M. (2017). Reproductive biology of Sclerodermus brevicornis, a European parasitoid developing on three species of invasive longhorn beetles. Biological Control, 105, 40–48.
Ma, C. S., Ma, G., & Pincebourde, S. (2021). Survive a warming climate: Insect responses to extreme high temperatures. Annual Review of Entomology, 66, 163–184.
Macías-Hernández, N., Ramos, C., Domènech, M., Febles, S., Santos, I., Arnedo, M. A., Borges, P. A., Emerson, B. C., & Cardoso, P. (2020). A database of functional traits for spiders from native forests of the Iberian Peninsula and Macaronesia. Biodiversity Data Journal, 8, e49159.
Mackauer, M. (1983). Quantitative assessment of Aphidius smithi (Hymenoptera: Aphidiidae): Fecundity, intrinsic rate of increase, and functional response. Canadian Entomologist, 115, 399–415.
Mackauer, M. (1986). Growth and developmental interactions in some aphids and their hymenopteran parasites. Journal of Insect Physiology, 32, 275–280.
Mackauer, M. (1990). Host discrimination and larval competition in solitary endoparasitoids. In M. Mackauer, L. E. Ehler, & J. Roland (Eds.), Critical issues in biological control (pp. 14–62). Intercept.
Mackauer, M., & Henkelman, D. H. (1975). Effect of light-dark cycles on adult emergence in the aphid parasite Aphidius smithi. Canadian Journal of Zoology, 53, 1201–1206.
Mackauer, M., & Sequeira, R. (1993). Patterns of development in insect parasites. In N. E. Beckage, S. N. Thompson, & B. A. Frederici (Eds.), Parasites and pathogens of insects (Vol. 1, pp. 1–23). Academic Press.
Mackay, A. I., & Kring, T. J. (1998). Acceptance and utilization of diapausing Helicoverpa zea (Lepidoptera: Noctuidae) pupae by Ichneumon promissorius (Hymenoptera: Ichneumonidae). Environmental Entomology, 27, 1006–1009.
Magdaraog, P. M., Harvey, J. A., Tanaka, T., & Gols, R. (2012). Intrinsic competition among solitary and gregarious endoparasitoid wasps and the phenomenon of ‘resource sharing.’ Ecological Entomology, 37, 65–74.
Maia, A. D. N., Luiz, A. J. B., & Campanhola, C. (2000). Statistical inference on associated fertility life table parameters using jackknife technique: Computational aspects. Journal of Economic Entomology, 93, 511–518.
Mangel, M. (1989). Evolution of host selection in parasitoids: Does the state of the parasitoid matter? American Naturalist, 133, 157–172.
Mani, M., & Nagarkatti, S. (1983). Relationship between size of Eucelatoria bryani Sabrosky females and their longevity and fecundity. Entomon, 8, 83–86.
van Marle, J., & Piek, T. (1986). Morphology of the venom apparatus. In T. O. Piek (Ed.), Venoms of the hymenoptera, biochemical, pharmacological and behavioural aspects (pp. 17–44). Academic Press.
Marris, G. C., & Casperd, J. (1996). The relationship between conspecific superparasitism and the outcome of in vitro contests staged between different larval instars of the solitary endoparasitoid Venturia canescens. Behavioral Ecology and Sociobiology, 39, 61–69.
Marris, G. C., Hubbard, S. F., & Scrimgeour, C. (1996). The perception of genetic similarity by the solitary parthenogenetic parasitoid Venturia canescens, and its effects on the occurrence of superparasitism. Entomologia Experimentalis et Applicata, 78, 167–174.
Martínez-Martínez, L., & Bernal, J. S. (2002). Ephestia kuehniella Zeller as a factitious host for Telenomus remus Nixon: Host acceptance and suitability. Journal of Entomological Science, 37, 10–26.
le Masurier, A. D. (1991). Effect of host size on clutch size in Cotesia glomerata. Journal of Animal Ecology, 60, 107–118.
Matsura, T., & Morooka, K. (1983). Influences of prey density on fecundity in a mantis, Paratenodera angustipennis (S.). Oecologia, 56, 306–312.
Maund, C. M., & Hsiao, T. H. (1991). Differential encapsulation of two Bathyplectes parasitoids among alfalfa weevil strains, Hypera postica (Gyllenhal). Canadian Entomologist, 123, 197–203.
May, R. M. (1976). Estimating r: A pedagogical note. American Naturalist, 110, 496–499.
Mayhew, P. J. (1997). Fitness consequences of ovicide in a parasitoid wasp. Entomologia Experimentalis et Applicata, 84, 115–126.
Mayhew, P. J. (2016). Comparing parasitoid life histories. Entomologia Experimentalis et Applicata, 159, 147–162.
Mayhew, P. J., & van Alphen, J. J. M. (1999). Gregarious development in alysiine parasitoids evolved through a reduction in larval aggression. Animal Behaviour, 58, 131–141.
Mayhew, P. J., & Blackburn, T. M. (1999). Does development mode organize life-history traits in parasitoid Hymenoptera? Journal of Animal Ecology, 68, 906–916.
Mayhew, P. J., & Glaizot, O. (2001). Integrating theory of clutch size and body size evolution for parasitoids. Oikos, 92, 372–376.
McArdle, B. H. (1977). An investigation of a Notonecta glauca-Daphnia magna predator-prey system. Ph.D. thesis, University of York, UK.
McClain, D. C., Rock, G. C., & Stinner, R. E. (1990). Thermal requirements for development and simulation of the seasonal phonology of Encarsia perniciosi (Hymenoptera: Aphelinidae), a parasitoid of the San Jose Scale (Homoptera: Diaspididae) in North Carolina orchards. Environmental Entomology, 19, 1396–1402.
McDougall, S. J., & Mills, N. J. (1997). The influence of hosts, temperature and food sources on the longevity of Trichogramma platneri. Entomologia Experimentalis et Applicata, 83, 195–203.
McEwen, P., Clow, S., Jervis, M. A., & Kidd, N. A. C. (1993). Alteration in searching behaviour of adult female green lacewings (Chrysoperla carnea) (Neur: Chrysopidae) following contact with honeydew of the black scale (Saissetia oleae) (Hom: Coccidae) and solutions containing L-tryptophan. Entomophaga, 38, 347–354.
McEwen, P., New, T. R., & Whittington, A. E. (2001). Lacewings in the crop environment. Cambridge University Press.
McEwen, P. K., Jervis, M. A., & Kidd, N. A. C. (1996). The influence of an artificial food supplement on larval and adult performance in the green lacewing Chrysoperla carnea (Stephens). International Journal of Pest Management, 42, 25–27.
McNeil, J. N., & Rabb, R. L. (1973). Physical and physiological factors in diapause initiation of two hyperparasites of the tobacco hornworm, Manduca sexta. Journal of Insect Physiology, 19, 2107–2118.
McNeill, M. R., Vittum, P. J., & Baird, D. B. (1999). Suitability of Listronotus maculicollis (Coleoptera: Curculionidae) as a host for Microctonus hyperodae (Hymenoptera: Braconidae). Journal of Economic Entomology, 92, 1292–1300.
McPeek, M. A., & Crowley, P. H. (1987). The effects of density and relative size on the aggressive behaviour, movement, and feeding of damselfly larvae (Odonata: Coenagrionidae). Animal Behaviour, 35, 1051–1061.
McPeek, M. A., Grace, M., & Richardson, J. M. L. (2001). Physiological and behavioural responses to predators shape the growth/predation risk trade-off in damselflies. Ecology, 82, 1535–1545.
van den Meiracker, R. A. F. (1994). Induction and termination of diapause in Orius predatory bugs. Entomologia Experimentalis et Applicata, 73, 127–137.
Mellini, E. (1972). Studi sui detteri larvevoridi. XXV. Sul determinismo ormonale delle influenze esercitate dagli ospiti sui loro parassiti. Bolletino di Istituto di Bologna, 31, 165–203.
Mendel, M. J., Shaw, P. B., & Owens, J. C. (1987). Life history characteristics of Anastatus semiflavidus (Hymenoptera: Eupelmidae), an egg parasitoid of the range caterpillar, Hemileuca oliviae (Lepidoptera: Saturniidae) over a range of temperatures. Environmental Entomology, 16, 1035–1041.
Mendes, S. M., Bueno, V. H. P., Argolo, V. M., & Silveira, L. C. P. (2002). Type of prey influences biology and consumption rate of Orius insidiosus (Say) (Hemiptera, Anthocoridae). Revista Brasileira de Entomologia, 46, 99–103.
Messenger, P. S. (1964a). The influence of rhythmically fluctuating temperature on the development and reproduction of the spotted alfalfa aphid Therioaphis maculata. Journal of Economic Entomology, 57, 71–76.
Messenger, P. S. (1964b). Use of life tables in a bioclimatic study of an experimental aphid-braconid wasp host-parasite system. Ecology, 45, 119–131.
Messenger, P. S. (1970). Bioclimatic inputs to biological control and pest management programs. In R. L. Rabb & F. E. Guthrie (Eds.), Concepts of pest management (pp. 84–99). North Carolina State University.
Messenger, P. S., & van den Bosch, R. (1971). The adaptability of introduced biological control agents. In C. F. Huffaker (Ed.), Biological Control (pp. 68–92). Plenum.
Mesterton-Gibbons, M., Cusumano, A., & Hardy, I. C. W. (2021). Escaping the evolutionary trap: Can size-related contest advantage compensate for juvenile mortality disadvantage when parasitoids develop in unnatural invasive hosts? Journal of Theoretical Biology, 527, 110821.
Michaud, J. P. (2003). A comparative study of larval cannibalism in three species of ladybird. Ecological Entomology, 28, 92–101.
Michels, G. J., Jr., & Behle, R. W. (1991). Effects of two prey species on the development of Hippodamia sinuata (Coleoptera: Coccinellidae) larvae at constant temperatures. Journal of Economic Entomology, 84, 1480–1484.
Miles, L. R., & King, E. G. (1975). Development of the tachinid parasite, Lixophaga diatraeae, on various developmental stages of the sugar cane borer in the laboratory. Environmental Entomology, 4, 811–814.
Miller, P. L. (1987). Dragonflies, naturalists’ handbooks no 7. Cambridge University Press.
Mills, N. J. (1981). Some aspects of the rate of increase of a coccinellid. Ecological Entomology, 6, 293–299.
Mills, N. J. (1982). Voracity, cannibalism and coccinellid predation. Annals of Applied Biology, 101, 144–148.
Mills, N. J., & Kuhlmann, U. (2000). The relationship between egg load and fecundity among Trichogramma parasitoids. Ecological Entomology, 25, 315–324.
Milonas, P. G. (2005). Influence of initial egg density and host size on the development of the gregarious parasitoid Bracon hebetor on three different host species. BioControl, 50, 415–428.
Minari, O., & Zilversmit, D. B. (1963). Use of KCN for stabilisation of colour in direct Nesslerisation of Kjeldahl digests. Analytical Biochemistry, 6, 320–327.
Minkenberg, O. (1989). Temperature effects on the life history of the eulophid wasp Diglyphus isaea, an ectoparasitoid of leafminers (Liriomyza spp.), on tomatoes. Annals of Applied Biology, 115, 381–397.
Miura, K. (1990). Life-history parameters of Gonatocerus cincticipitis Sahad (Hym., Mymaridae), an egg parasitoid of the green rice leafhopper, Nephotettix cincticeps Uhler (Hem., Cicadellidae). Journal of Applied Entomology, 110, 353–357.
Mohan, C., Nair, C. P. R., Rajan, P., & Bindhumol, P. N. (2004). Influence of temperature on biological parameters of Goniozus nephantidis (Muesebeck) and Elasmus nephantidis Rohwer, two promising parasitoids of coconut black headed caterpillar, Opisina arenosella Walker. Journal of Plantation Crops, 32, 301–305.
Mohan, P., & Sinu, P. A. (2017). Parasitoid wasp usurps its host to guard its pupa against hyperparasitoids and induces rapid behavioral changes in the parasitized host. PLoS ONE, 12, e0178108.
Moiroux, J., Boivin, G., & Brodeur, J. (2018). Ovigeny index increases with temperature in an aphid parasitoid: Is early reproduction better when it is hot? Journal of Insect Physiology, 109, 157–162.
de Moraes, C. M., & Mescher, M. C. (2005). Intrinsic competition between larval parasitoids with different degrees of host specificity. Ecological Entomology, 30, 564–570.
de Moraes, C. M., Cortesero, A. M., Stapel, J. O., & Lewis, W. J. (1999). Intrinsic and extrinsic competitive interactions between two larval parasitoids of Heliothis virescens. Ecological Entomology, 24, 402–410.
Morales, J., & Hower, A. A. (1981). Thermal requirements for development of the parasite Microctonus aethiopoides. Environmental Entomology, 10, 279–284.
Moratorio, M. S. (1987). Effect of host species on the parasitoids Anagrus mutans and Anagrus silwoodensis Walker (Hymenoptera: Mymaridae). Environmental Entomology, 16, 825–827.
Mukerji, M. K., & LeRoux, E. J. (1969). The effect of predator age on the functional response of Podisus maculiventris to the prey size of Galleria mellonella. Canadian Entomologist, 101, 314–327.
Müller, H. J. (1970). Formen der dormanz bei insekten. Nova Acta Leopoldina, 35, 1–27.
Murdoch, W. W., & Sih, A. (1978). Age-dependent interference in a predatory insect. Journal of Animal Ecology, 47, 581–592.
Murthy, K. S., Rajeswari, R., Jalali, S. K., & Venkatesan, T. (2008). Influence of temperature on biological parameters of Goniozus nephantidis (Muesebeck), a promising parasitoid of the coconut black headed caterpillar Opisina arenosella Walker. Entomon, 33, 195–199.
Nahrung, H. F., & Merritt, D. J. (1999). Moisture is required for the termination of egg diapause in the chrysomelid beetle, Homichloda barkeri. Entomologia Experimentalis et Applicata, 93, 201–207.
Nakamatsu, Y., Tanaka, T., & Harvey, J. A. (2006). The mechanism of the emergence of Cotesia kariyai (Hymenoptera: Braconidae) larvae from the host. European Journal of Entomology, 103, 355.
Nakashima, Y., & Hirose, Y. (1999). Trail sex pheromone as a cue for searching mates in an insect predator Orius sauteri. Ecological Entomology, 24, 115–117.
Nakashima, Y., Higashimura, Y., & Mizutani, K. (2016). Host discrimination and ovicide by aphid hyperparasitoids Asaphes suspensus (Hymenoptera: Pteromalidae) and Dendrocerus carpenteri (Hymenoptera: Megaspilidae). Applied Entomology and Zoology, 51, 609–614.
Nasser, M., & Abdurahman, U. C. (1990). Reproductive biology and predatory behaviour of the anthocorid bugs (Anthocoridae: Hemiptera) associated with the coconut caterpillar Opisina arenosella (Walker). Entomon, 15, 149–158.
Nealis, V. G., & Fraser, S. (1988). Rate of development. reproduction, and mass-rearing of Apanteles fumiferanae Vier. (Hymenoptera: Braconidae) under controlled conditions. Canadian Entomologist, 120, 197–204.
Nealis, V. G., Jones, R. E., & Wellington, W. G. (1984). Temperature and development in host-parasite relationships. Oecologia, 61, 224–229.
Nechols, J. R., & Tauber, M. J. (1977). Age specific interaction between the greenhouse whitefly and Encarsia formosa: Influence of host on the parasite’s oviposition and development. Environmental Entomology, 6, 143–149.
Netting, J. F., & Hunter, M. S. (2000). Ovicide in the whitefly parasitoid, Encarsia formosa. Animal Behaviour, 60, 217–226.
Nguyen, T. M., Bressac, C., & Chevrier, C. (2013). Heat stress affects male reproduction in a parasitoid wasp. Journal of Insect Physiology, 59, 248–254.
Nicol, C. M. Y., & Mackauer, M. (1999). The scaling of body size and mass in a host parasitoid association: Influence of host species and stage. Entomologia Experimentalis et Applicata, 90, 83–92.
Nishida, R. (2014). Chemical ecology of insect–plant interactions: Ecological significance of plant secondary metabolites. Bioscience, Biotechnology, and Biochemistry, 78, 1–13.
van Noordwijk, A. J., & de Jong, G. (1986). Acquisition and allocation of resources: Their influence on variation in life history tactics. American Naturalist, 128, 137–142.
Norling, U. (1971). The life history and seasonal regulation of Aeschna viridis Eversm. in southern Sweden (Odonata). Entomologica Scandinavica, 2, 170–190.
Núñez-Campero, S. R., Ovruski, S. M., & Aluja, M. (2012). Survival analysis and demographic parameters of the pupal parasitoid Coptera haywardi (Hymenoptera: Diapriidae), reared on Anastrepha fraterculus (Diptera: Tephritidae). Biological Control, 61, 40–46.
Öberg, S. (2009). Influence of landscape structure and farming practice on body condition and fecundity of wolf spiders. Basic and Applied Ecology, 10, 614–621.
Ode, P. J. (2006). Plant chemistry and natural enemy fitness: Effects on herbivore and natural enemy interactions. Annual Review of Entomology, 51, 163–185.
Ode, P. J. (2019). Plant toxins and parasitoid trophic ecology. Current Opinion in Insect Science, 32, 118–123.
Ode, P. J., & Strand, M. R. (1995). Progeny and sex allocation decisions of the polyembryonic wasp Copidosoma floridanum. Journal of Animal Ecology, 64, 213–224.
Ogloblin, A. A. (1924). The role of extra-embryonic blastoderm of Dinocampus terminatus Nees during larval development. Memoires de la Société Royale des Sciences de Bohème, 3, 1–27. (In French).
Olson, D. M., & Andow, D. A. (1998). Larval crowding and adult nutrition effects on longevity and fecundity of female Trichogramma nubilale Ertle & Davis (Hymenoptera: Trichogrammatidae). Environmental Entomology, 27, 508–514.
Olson, D. M., Fadamiro, H., Lundgren, J. G., & Heimpel, G. E. (2000). Effects of sugar feeding on carbohydrate and lipid metabolism in a parasitoid wasp. Physiological Entomology, 25, 17–26.
Omacini, M., Chaneton, E. J., Ghersa, C. M., & Müller, C. B. (2001). Symbiotic fungal endophytes control insect host-parasite interaction webs. Nature, 409, 78–81.
O’Neill, K. M., & Skinner, S. W. (1990). Ovarian egg size and number in relation to female size in five species of parasitoid wasps. Journal of Zoology, 220, 115–122.
Ongagna, P., & Iperti, G. (1994). Influence of temperature and photoperiod in Harmonia axyridis Pall. (Col., Coccinellidae): Obtaining rapidly fecund adults or dormancy. Journal of Applied Entomology, 117, 314–317.
Opp, S. B., & Luck, R. F. (1986). Effects of host size on selected fitness components of Aphytis melinus and A. lingnanensis (Hymenoptera: Aphelinidae). Annals of the Entomological Society of America, 79, 700–704.
Orr, D. B., & Boethel, D. J. (1986). Influence of plant antibiosis through four trophic levels. Oecologia, 70, 242–249.
Osborne, L. S. (1982). Temperature-dependent development of greenhouse whitefly and its parasite Encarsia formosa. Environmental Entomology, 111, 483–485.
Otronen, M. (1995). Energy reserves and mating success in males of the yellow dung fly, Scathophaga stercoraria. Functional Ecology, 9, 683–688.
Otto, M., & Mackauer, M. (1998). The developmental strategy of an idiobiont ectoparasitoid, Dendrocerus carpenteri: Influence of variations in host quality on offspring growth and fitness. Oecologia, 117, 353–364.
Ouedraogo, R. M., Cusson, M., Goetell, M. S., & Brodeur, J. (2003). Inhibition of fungal growth in thermoregulating locusts, Locusta migratoria, infected by the fungus Metarhizium anisopliae var. acridum. Journal of Invertebrate Pathology, 82, 103–109.
Owens, A. C., & Lewis, S. M. (2018). The impact of artificial light at night on nocturnal insects: A review and synthesis. Ecology and Evolution, 8, 11337–11358.
Őzder, N., & Sağlam, O. (2003). Effects of aphid prey on larval development and mortality of Adalia bipunctata and Coccinella septempuncata (Coleoptera: Coccinellidae). Biocontrol Science and Technology, 13, 449–453.
Pakyari, H., Fathipour, Y., & Enkegaard, A. (2011). Estimating development and temperature thresholds of Scolothrips longicornis (Thysanoptera: Thripidae) on eggs of two-spotted spider mite using linear and nonlinear models. Journal of Pest Science, 84, 153–163.
Pampel, W. (1914). Die weiblischen geschlechtosorgane der ichneumoniden. Zeitschrift für Wissenschaftliche Zoologie, 108, 290–357.
Pandey, A. K., & Tripathi, C. P. M. (2008). Effect of temperature on the development, fecundity, progeny sex ratio and life-table of Campoletis chlorideae, an endolarval parasitoid of the pod borer, Helicoverpa armigera. BioControl, 53, 461–471.
Paoli, F., Gottardo, M., Dallai, R., & Roversi, P. F. (2013). Morphology of the male reproductive system and sperm ultrastructure of the egg parasitoid Gryon pennsylvanicum (Ashmead) (Hymenoptera, Platygastridae). Arthropod Structure and Development, 42, 297–308.
Papanikolaou, N. E., Milonas, P. G., Kontodimas, D. C., Demiris, N., & Matsinos, Y. G. (2013). Temperature-dependent development, survival, longevity, and fecundity of Propylea quatuordecimpunctata (Coleoptera: Coccinellidae). Annals of the Entomological Society of America, 106, 228–234.
Pappas, M. L., Broufas, G. D., & Koveos, D. S. (2007). Effects of various prey species on development, survival and reproduction of the predatory lacewing Dichochrysa prasina (Neuroptera: Chrysopidae). Biological Control, 43, 163–170.
Paradise, C. J., & Stamp, N. E. (1990). Variable quantities of toxic diet cause different degrees of compensatory and inhibitory responses by juvenile praying mantids. Entomologia Experimentalis et Applicata, 55, 213–222.
Paradise, C. J., & Stamp, N. E. (1991). Abundant prey can alleviate previous adverse effects on growth of juvenile praying mantids (Orthoptera: Mantidae). Annals of the Entomological Society of America, 84, 396–406.
Paradise, C. J., & Stamp, N. E. (1993). Episodes of unpalatable prey reduce consumption and growth of juvenile praying mantids. Journal of Insect Behavior, 6, 155–166.
Patel, K. J., & Schuster, D. J. (1983). Influence of temperature on the rate of development of Diglyphus intermedius (Hymenoptera: Eulophidae) Girault, a parasite of Lyriomyza spp. (Diptera: Agromyzidae). Environmental Entomology, 12, 885–887.
Peig, J., & Green, A. J. (2009). New perspectives for estimating body condition from mass/length data: The scaled mass index as an alternative method. Oikos, 118, 1883–1891.
Pennacchio, F., & Strand, M. R. (2006). Evolution of developmental strategies in parasitic Hymenoptera. Annual Review of Entomolgy, 51, 233–258.
Perera, H. A. S. (1990). Effect of host plant on mealybugs and their parasitoids. Ph.D. thesis, Wye College, University of London, UK.
Pérez-Lachaud, G., Batchelor, T. P., & Hardy, I. C. W. (2004). Wasp eat wasp: Facultative hyperparasitism and intra-guild predation by bethylid wasps. Biological Control, 30, 149–155.
Perkins, S. E., Alexander, L. V., & Nairn, J. R. (2012). Increasing frequency, intensity and duration of observed global heatwaves and warm spells. Geophysical Research Letters, 39.
Perkins-Kirkpatrick, S. E., & Lewis, S. C. (2020). Increasing trends in regional heatwaves. Nature Communications, 11, 1–8.
Pervez, A., & Omkar (2004). Temperature-dependent life attributes of an aphidophagous ladybird, Propylea dissecta. Biocontrol Science and Technology, 14, 587–594.
Petersen, M. K., & Hunter, M. S. (2002). Ovipositional preference and larval-early adult performance of two generalist lacewing predators of aphids in pecans. Biological Control, 25, 101–109.
Petschenka, G., & Agrawal, A. A. (2016). How herbivores coopt plant defenses: Natural selection, specialization, and sequestration. Current Opinion in Insect Science, 14, 17–24.
Petters, R. M., & Stefanelli, J. (1983). Developmental arrest of endoparasitoid wasp larvae (Nemeritis canescens Grav.) caused by an ectoparasitoid wasp (Bracon hebetor Say). Journal of Experimental Zoology, 225, 459–465.
Pexton, J., & Mayhew, P. J. (2002). Siblicide and life-history evolution in parasitoids. Behavioral Ecology, 13, 690–695.
Pickup, J., & Thompson, D. J. (1990). The effects of temperature and prey density on the development rates and growth of damselfly larvae (Odonata: Zygoptera). Ecological Entomology, 15, 187–200.
Piek, T. (1986). Venoms of the hymenoptera. Academic Press.
Pierce, C. L., Crowley, P. H., & Johnson, D. M. (1985). Behaviour and ecological interactions of larval Odonata. Ecology, 66, 1504–1512.
Pivnick, K. A. (1993). Diapause initiation and pupation site selection of the braconid parasitoid Microplitis mediator (Haliday): A case of manipulation of host behaviour. Canadian Entomologist, 125, 825–830.
Pizzol, J., Desneux, N., Wajnberg, E., & Thiéry, D. (2012). Parasitoid and host egg ages have independent impact on various biological traits in a Trichogramma species. Journal of Pest Science, 85, 489–496.
Polgar, L. A., & Hardie, J. (2000). Diapause induction in aphid parasitoids. Entomologia Experimentalis et Applicata, 97, 21–27.
Polgar, L. A., Darvas, B., & Völkl, W. (1995). Induction of dormancy in aphid parasitoids: Implications for enhancing their field effectiveness. Agriculture, Ecosystems and Environment, 52, 19–23.
Polgar, L. A., Mackauer, M., & Völkl, W. (1991). Diapause induction in two species of aphid parasitoids: The influence of aphid morph. Journal of Insect Physiology, 37, 699–702.
Pollard, S. (1988). Partial consumption of prey: The significance of prey water loss on estimates of biomass intake. Oecologia, 76, 475–476.
Postek, M. T., Howard, K. S., Johnson, A. H., & McMichael, K. L. (1980). Scanning electron microscopy–a student’s handbook. Ladd Research Industries.
Prenter, J., Elwood, R. W., & Montgomery, W. I. (1999). Sexual size dimorphism and reproductive investment by female spiders: A comparative analysis. Evolution, 53, 1987–1994.
Price, P. W. (1972). Parasitiods utilizing the same host: Adaptive nature of differences in size and form. Ecology, 53, 190–195.
Price, P. W. (1975). Reproductive strategies of parasitoids. In P. W. Price (Ed.), Evolutionary strategies of parasitic insects and mites (pp. 87–111). Plenum.
Principi, M. M. (1949). Contributi allo studio dei neurotteri italiani. 8. Morfologia, anafomia e funzionamento degli apparati genitali nel gen. Chrysopa Leach (Chrysopa septempunctata Wesm. e Chrysopa formosa Brauer). Bolletino di Istituto Enomologia di Bologna, 17, 316–362.
Principi, M. M., & Canard, M. (1984). Feeding habits. In M. Canard, Y. Semeria, & T. New (Eds.), Biology of the chrysopidae (pp. 76–92). W. Junk.
Pritchard, G. (1989). The roles of temperature and diapause in the life history of a temperate-zone dragonfly: Argia vivida. Ecological Entomolology, 14, 99–108.
Quicke, D. L. J. (1997). Parasitic wasps. Chapman and Hall.
Quicke, D. L. J. (2014). The braconid and ichneumonid parasitoid wasps: Biology, systematics, evolution and ecology. Wiley.
Quicke, D. L. J., Fitton, M. G., & Ingram, S. (1992). Phylogenetic implications of the structure and distribution of ovipositor valvilli in the Hymenoptera (Insecta). Journal of Natural History, 26, 587–608.
Quicke, D. L. J., Fitton, M. G., Tunstead, J. R., Ingram, S. N., & Gaitens, P. V. (1994). Ovipositor structure and relationships within the Hymenoptera, with special reference to the Ichneumonoidea. Journal of Natural History, 28, 635–682.
Ragusa, S. (1974). Influence of temperature on the oviposition rate and longevity of Opius concolor siculus (Hymenoptera: Braconidae). Entomophaga, 19, 61–66.
Rahman, M. H., Fitton, M. G., & Quicke, D. L. J. (1998). Ovipositor internal microsculpture in the Braconidae (Insecta, Hymenoptera). Zoologica Scripta, 27, 319–331.
Le Ralec, A. (1995). Egg contents in relation to host-feeding in some parasitic Hymenoptera. Entomophaga, 40, 87–93.
Le Ralec, A., Rabasse, J. M., & Wajnberg, E. (1996). Comparative morphology of the ovipositor of some parasitic Hymenoptera in relation to characteristics of their hosts. Canadian Entomologist, 128, 413–433.
Ramírez, M. J., & Michalik, P. (2019). The spider anatomy ontology (SPD)—a versatile tool to link anatomy with cross-disciplinary data. Diversity, 11, 202.
Ramírez-Ahuja, M. D. L., Garza-González, E., Talamas, E. J., Gómez-Govea, M. A., Rodríguez-Pérez, M. A., Zambrano-Robledo, P., Rebollar-Tellez, E., & Rodríguez-Sanchez, I. P. (2020). Parasitoids of chrysopidae eggs in Sinaloa Mexico. Insects, 11, 849.
Ratcliffe, N. A., & King, P. E. (1969). Morphological, ultrastructural, histochemical and electrophoretic studies on the venom system of Nasonia vitripennis Walker (Hymenoptera: Pteromalidae). Journal of Morphology, 127, 177–204.
Ratner, S., & Vinson, S. B. (1983). Encapsulation reactions in vitro by haemocytes of Heliothis virescens. Journal of Insect Physiology, 29, 855–863.
Reed, D. A., Luhring, K. A., Stafford, C. A., Hansen, A. K., Millar, J. G., Hanks, L. M., & Paine, T. D. (2007). Host defensive response against an egg parasitoid involves cellular encapsulation and melanization. Biological Control, 41, 214–222.
Reitz, S. R., & Trumble, J. T. (1997). Effects of linear furanocoumarins on the herbivore Spodoptera exigua and the parasitoid Archytas marmoratus: Host quality and parasitoid success. Entomologia Experimentalis et Applicata, 84, 9–16.
Ren, S. X., Stansly, P. A., & Liu, T. X. (2002). Life history of the whitefly predator Nephaspis oculatus (Coleoptera: Coccinellidae) at six constant temperatures. Biological Control, 23, 262–268.
Richards, O. W., & Davies, R. C. (1977). Imms’ general textbook of entomology (Vols. 1 and 2). Chapman and Hall.
Ridley, M. (1988). Mating frequency and fecundity in insects. Biological Reviews, 63, 509–549.
Ringel, M. S., Rees, M., & Godfray, H. C. J. (1998). The evolution of diapause in a coupled host-parasitoid system. Journal of Theoretical Biology, 194, 195–204.
Rivera-Quiroz, F. A., Schilthuizen, M., Petcharad, B., & Miller, J. A. (2020). Imperfect and askew: A review of asymmetric genitalia in araneomorph spiders (Araneae: Araneomorphae). PLoS ONE, 15, e0220354.
Rivero, A., & Casas, J. (1999). Rate of nutrient allocation to egg production in a parasitic wasp. Proceedings of the Royal Society of London B, 266, 1169–1174.
Rivero, A., & West, S. A. (2002). The physiological costs of being small in a parasitic wasp. Evolutionary Ecology Research, 4, 407–420.
Robertson, P. L. (1968). A morphological and functional study of the venom apparatus in representatives of some major groups of Hymenoptera. Australian Journal of Zoology, 16, 133–166.
Rodriguez-Saona, C., & Miller, J. C. (1999). Temperature-dependent effects on development, mortality, and growth of Hippodamia convergens (Coleoptera: Coccinellidae). Environmental Entomology, 28, 518–522.
Roff, D. A. (2002). Life history evolution. Sinauer.
Roitberg, B., Sircom, J., van Alphen, J. J. M., & Mangel, M. (1993). Life expectancy and reproduction. Nature, 364, 108.
Roitberg, B. D., Boivin, G., & Vet, L. E. M. (2001). Fitness, parasitoids, and biological control: An opinion. Canadian Entomologist, 133, 429–438.
Romo, C. M., & Tylianakis, J. M. (2013). Elevated temperature and drought interact to reduce parasitoid effectiveness in suppressing hosts. PLoS ONE, 8, e58136.
Rosenheim, J. A., & Rosen, D. (1992). Influence of egg load and host size on host-feeding behaviour of the parasitoid Aphytis lingnanensis. Ecological Entomology, 17, 263–272.
Rotheram, S. (1973a). The surface of the egg of a parasitic insect. 1. The surface of the egg and first-instar larva of Nemeritis. Proceedings of the Royal Society of London B, 183, 179–194.
Rotheram, S. (1973b). The surface of the egg of a parasitic insect. 2. The ultrastructure of the particulate coat on the egg of Nemeritis. Proceedings of the Royal Society of London B, 183, 195–204.
Rotheram, S. M. (1967). Immune surface of eggs of a parasitic insect. Nature, 214, 700.
Rotheray, G. E. (1979). The biology and host searching behaviour of a cynipoid parasite of aphidophagous Syrphidae. Ecological Entomology, 4, 75–82.
Rotheray, G. E., & Barbosa, P. (1984). Host related factors affecting oviposition behaviour in Brachymeria intermedia. Entomologia Experimentalis et Applicata, 35, 141–145.
Roy, M., Brodeur, J., & Cloutier, C. (2003). Effect of temperature on intrinsic rates of natural increase (rm) of a coccinellid and its spider mite prey. BioControl, 48, 57–72.
Ruberson, J. R., & Kring, T. J. (1993). Parasitism of developing eggs by Trichogramma pretiosum (Hymenoptera: Trichogrammatidae): Host age preference and suitability. Biological Control, 3, 39–46.
Ruberson, J. R., Shen, Y. J., & Kring, T. J. (2000). Photoperiodic sensitivity and diapause in the predator Orius insidiosus (Heteroptera: Anthocoridae). Annals of the Entomological Society of America, 93, 1123–1130.
Ruberson, J. R., Tauber, C. A., & Tauber, M. J. (1989). Development and survival of Telenomus lobatus, a parasitoid of chrysopid eggs: Effect of host species. Entomologia Experimentalis et Applicata, 51, 101–106.
Ruberson, J. R., Tauber, M. J., & Tauber, C. A. (1988). Reproductive biology of two biotypes of Edovum puttleri, a parasitoid of Colorado potato beetle eggs. Entomologia Experimentalis et Applicata, 46, 211–219.
Russel, R. J. (1970). The effectiveness of Anthocoris nemorum and A. confusus (Hemiptera: Anthocoridae) as predators of the sycamore aphid, Drepanosiphum platanoides. I. The number of aphids consumed during development. Entomologia Experimentalis et Applicata, 13, 194–207.
Ryoo, M. I., Hong, Y. S., & Yoo, C. K. (1991). Relationship between temperature and development of Lariophagus distinguendus (Hymenoptera: Pteromalidae), an ectoparasitoid of Sitophilus oryzae (Coleoptera: Curculionidae). Journal of Economic Entomology, 84, 825–829.
Sabelis, M. W. (1992). Predatory arthropods. In M. J. Crawley (Ed.), Natural enemies: The population biology of predators, parasites and diseases (pp. 225–264). Blackwell.
Sadeghi, H., & Gilbert, F. S. (1999). Individual variation in oviposition preference, and its interaction with larval performance in an insect predator. Oecologia, 118, 405–411.
Sagarra, L. A., Peterkin, D. D., Vincent, C., & Stewart, R. K. (2000a). Immune response of the hibiscus mealybug, Maconellicoccus hirsutus (Homoptera: Pseudococcidae), to oviposition of the parasitoid Anagyrus kamali Moursi (Hymenoptera: Encyrtidae). Journal of Insect Physiology, 46, 647–653.
Sagarra, L. A., Vincent, C., Peters, N. F., & Stewart, R. K. (2000b). Effect of host density, temperature, and photoperiod on the fitness of Anagyrus kamali, a parasitoid of the hibiscus mealybug Maconellicoccus hirsutus. Entomologia Experimentalis et Applicata, 96, 141–147.
Sahad, K. A. (1982). Biology and morphology of Gonatocerus sp. (Hymenoptera, Mymaridae), an egg parasitoid of the green rice leafhopper, Nephotettix cincticeps Uhler (Homoptera: Deltocephalidae). I. Biology. Kontyû, 50, 246–260.
Sahad, K. A. (1984). Biology of Anagrus optabilis (Perkins) (Hymenoptera, Mymaridae), an egg parasitoid of delphacid leafhoppers. Esakia, 22, 129–144.
Sahragard, A., Jervis, M. A., & Kidd, N. A. C. (1991). Influence of host availability on rates of oviposition and host-feeding, and on longevity in Dicondylus indianus Olmi (Hym., Dryinidae), a parasitoid of the Rice Brown Planthopper, Nilaparvata lugens Stål (Hem., Delphacidae). Journal of Applied Entomology, 112, 153–162.
Sakurai, H., Hirano, T., & Takeda, S. (1986). Physiological distinction between aestivation and hibernation in the lady beetle, Coccinella septempunctata bruckii (Coleoptera: Coccinellidae). Applied Entomology and Zoology, 21, 424–429.
Salt, G. (1940). Experimental studies in insect parasitism. VII. The effects of different hosts on the parasite Trichogramma evanescens Westw. (Hym.Chalcidoidea). Proceedings of the Royal Entomological Society of London A, 15, 81–124.
Salt, G. (1941). The effects of hosts upon their insect parasites. Biological Reviews, 16, 239–264.
Salt, G. (1961). Competition among insect parasitoids. Mechanisms in biological competition. Symposium of the Society for Experimental Biology, 15, 96–119.
Salt, G. (1968). The resistance of insect parasitoids to the defence reactions of their hosts. Biological Reviews, 43, 200–232.
Salt, G. (1970). The cellular defence reactions of insects. Cambridge University Press.
Sandlan, K. (1979). Host feeding and its effects on the physiology and behaviour of the ichneumonid parasite Coccygomimus turionellae. Physiological Entomology, 4, 383–392.
Sanger, C., & King, P. E. (1971). Structure and function of the male genitalia in Nasonia vitripennis (Walker) (Hym.: Pteromalidae). Entomologist, 104, 137–149.
Sanon, A., Ouedraogo, A. F., Tricault, Y., Credland, P. F., & Huignard, J. (1998). Biological control of bruchids in cowpea stores by release of Dinarmus basilis (Hymenoptera: Pteromalidae). Environmental Entomology, 27, 717–725.
Sarfraz, M., Dosdall, L. M., & Keddie, B. K. (2008). Host plant genotype of the herbivore Plutella xylostella (Lepidoptera: Plutellidae) affects the performance of its parasitoid Diadegma insulare (Hymenoptera: Ichneumonidae). Biological Control, 44, 42–51.
Sato, Y., Tagawa, J., & Hidaka, T. (1986). Effects of the gregarious parasitoids Apanteles rufricus and A. kariyai on host growth and development. Journal of Insect Physiology, 32, 281–286.
Schädler, M., Brandl, R., & Kempel, A. (2010). Host plant genotype determines bottom-up effects in an aphid-parasitoid-predator system. Entomologia Experimentalis et Applicata, 135, 162–169.
Scharf, I., Peter, F., & Martin, O. Y. (2013). Reproductive trade-offs and direct costs for males in arthropods. Evolutionary Biology, 40, 169–184.
Schlinger, E. I., & Hall, J. C. (1960). The biology, behaviour and morphology of Praon palitans Muesebeck, an internal parasite of the spotted alfalfa aphid, Therioaphis maculata (Buckton) (Hymenoptera; Braconidae, Aphidiinae). Annals of the Entomological Society of America, 53, 144–160.
Schmidt, O. (2008). Insect immune recognition and suppression. In N. E. Beckage (Ed.), Insect immunology (pp. 271–294). Academic Press.
Schmidt, O., Theopold, U., & Strand, M. (2001). Innate immunity and its evasion and suppression by hymenopteran endoparasitoids. BioEssays, 23, 344–351.
Schoonhoven, L. M., van Loon, J. J. A., & Dicke, M. (2005). Insect-plant biology (2nd ed.). Oxford University Press.
Scott, M., Berrigan, D., & Hoffmann, A. A. (1997). Costs and benefits of acclimation to elevated temperature in Trichogramma carverae. Entomologia Experimentalis et Applicata, 85, 211–219.
Scott, S. M., & Barlow, C. A. (1984). Effect of prey availability during development on the reproductive output of Metasyrphus corollae (Diptera: Syrphidae). Environmental Entomology, 13, 669–674.
Scriber, J. M., & Slansky, F., Jr. (1981). The nutritional ecology of immature insects. Annual Review of Entomology, 26, 183–211.
Scudder, G. G. E. (1971). Comparative morphology of insect genitalia. Annual Review of Entomology, 16, 379–406.
Seal, D. R., Stansly, P. A., & Schuster, D. J. (2002). Influence of temperature and host on life history parameters of Catolaccus hunteri (Hymenoptera: Pteromalidae). Environmental Entomology, 31, 354–360.
Segoli, M., & Wajnberg, E. (2020). The combined effect of host and food availability on optimized parasitoid life history traits based on a three-dimensional trade-off surface. Journal of Evolutionary Biology, 33, 850–857.
Sem’yanov, V. P. (1970). Biological properties of Adalia bipunctata L. (Coleoptera, Coccinellidae) in conditions of Leningrad region. Zashchchita Rastenii Vreditelet’ i Boleznii, 127, 105–112.
Sequeira, R., & Mackauer, M. (1992a). Covariance of adult size and development time in the parasitoid wasp Aphidius ervi in relation to the size of its host, Acyrthosiphon pisum. Evolutionary Ecology, 6, 34–44.
Sequeira, R., & Mackauer, M. (1992b). Nutritional ecology of an insect host-parasitoid association: The pea aphid-Aphidius ervi system. Ecology, 73, 183–189.
Shameer, K. S. (2017). Ecological interactions in the coconut cropping systems and the role of volatile organic compounds of selected varieties of coconut (Cocos nucifera L.) in the biological control of Opisina arenosella Walker (Lepidoptera: Oecophoridae). Ph.D. thesis, University of Calicut, India.
Shameer, K. S., Mohan, C., & Nair, C. P. R. (2002). Optimum weight of host larvae for the mass multiplication of Goniozus nephantidis (Muesebeck), the larval parasitoid of Opisina arenosella Walker. Planation Crops Research and Development in the New Millennium, 452–455.
Sharpe, P. J. H., Curry, C. L., DeMichele, D. W., & Cole, C. L. (1977). Distribution model of organism development times. Journal of Theoretical Biology, 661, 21–38.
Siddiqui, W. H., Barlow, C. A., & Randolph, P. A. (1973). Effect of some constant and alternating temperature on population growth of the pea aphid Acyrthosiphon pisum (Hom: Aphididae). Canadian Entomologist, 105, 145–156.
Siekmann, G., Tenhumberg, B., & Keller, M. A. (2001). Feeding and survival in parasitic wasps: Sugar concentration and timing matter. Oikos, 95, 425–430.
Sigsgaard, L., Toft, S., & Villareal, S. (2001). Diet-dependent survival, development and fecundity of the spider Atypena formosana (Oi) (Araneae: Linyphiidae) implications for biological control in rice. Biocontrol Science and Technology, 11, 233–244.
Sih, A. (1980). Optimal foraging: Partial consumption of prey. American Naturalist, 116, 281–290.
Sih, A. (1982). Foraging strategies and avoidance of predation by an aquatic insect, Notonecta hoffmani. Ecology, 63, 786–796.
Sih, A. (1987) Nutritional ecology of aquatic insect predators. In F. Slansky Jr. & J. G. Rodriguez (Eds.), Nutritional ecology of insects, mites, spiders and related invertebrates (pp. 579–607). Wiley Interscience.
Simmonds, F. J. (1943). The occurrence of superparasitism in Nemeritis canescens Grav.. Revue Canadienne de Biologie, 2, 15–58.
Singh, N., & Mishra, G. (2014). Does temperature modify slow and fast development in two aphidophagous ladybirds? Journal of Thermal Biology, 39, 24–31.
Sisterton, M. S., & Averill, A. L. (2002). Costs and benefits of food foraging for a braconid parasitoid. Journal of Insect Behavior, 15, 571–588.
Skinner, S. W. (1985). Clutch size as an optimal foraging problem for insects. Behavioural Ecology and Sociobiology, 17, 231–238.
Slansky, F., Jr. (1986). Nutritional ecology of endoparastic insects and their hosts: An overview. Journal of Insect Physiology, 32, 255–261.
Slansky Jr., F., & Rodriguez, J. G. (1987). Nutritional ecology of insects, mites, spiders and related invertebrates: an overview. In F. Slansky Jr. & J. G. Rodriguez (Eds.), Nutritional ecology of insects, mites, spiders and related invertebrates (pp. 1–69). Wiley Interscience.
Slansky, F., Jr., & Scriber, J. M. (1982). Selected bibliography and summary of quantitative food utilization by immature insects. Bulletin of the Entomological Society of America, 28, 43–55.
Slansky, F., Jr., & Scriber, J. M. (1985). Food consumption and utilization. In G. A. Kerkut & L. I. Gilbert (Eds.), Comprehensive insect physiology, biochemistry and pharmacology (pp. 87–163). Pergamon Press.
Smilanich, A. M., Dyer, L. A., & Gentry, G. L. (2009). The insect immune response and other putative defenses as effective predictors of parasitism. Ecology, 90, 1434–1440.
Smilowitz, Z., & Iwantsch, G. F. (1973). Relationships between the parasitoid Hyposoter exiguae and the cabbage looper Trichoplusia ni: Effects of host age on developmental rate of the parasitoid. Environmental Entomology, 2, 759–763.
Smith, B. C. (1961). Results of rearing some coccinellid (Coleoptera: Coccinellidae) larvae on various pollens. Proceedings of the Entomological Society of Ontario, 91, 270–271.
Smith, B. C. (1965). Growth and development of coccinellid larvae on dry foods (Coleoptera, Coccinellidae). Canadian Entomologist, 97, 760–768.
Smith, C. C., & Fretwell, S. D. (1974). The optimal balance between size and number of offspring. American Naturalist, 108, 499–506.
Smith, L., & Rutz, D. A. (1987). Reproduction, adult survival and intrinsic rate of growth of Urolepis rufipes (Hymenoptera: Pteromalidae), a pupal parasitoid of house flies, Musca domestica. Entomophaga, 32, 315–327.
Smith, R. H. (1991). Genetic and phenotypic aspects of life-history evolution in animals. Advances in Ecological Research, 21, 63–120.
Snart, C. J. P., Kapranas, A., Williams, H., Barrett, D. A., & Hardy, I. C. W. (2018). Sustenance and performance: Nutritional reserves, longevity and contest behaviour of fed and starved adult parasitoid wasps. Frontiers in Ecology and Evolution, 6, 1–12.
Snodgrass, R. E. (1935). Principles of insect morphology. McGraw-Hill.
Soares, A. O., & Serpa, A. (2007). Interference competition between ladybird beetle adults (Coleoptera: Coccinellidae): Effects on growth and reproductive capacity. Population Ecology, 49, 37–43.
Sokolovska, N., Rowe, L., & Johansson, F. (2000). Fitness and body size in mature odonates. Ecological Entomology, 25, 239–248.
Sopp, P. I., & Wratten, S. D. (1986). Rates of consumption of cereal aphids by some polyphagous predators in the laboratory. Entomologia Experimentalis et Applicata, 41, 69–73.
Souna, D. A., Bokonon-Ganta, A. H., Ravallec, M., Alizannon, M., Srinivasan, R., Pittendrigh, B. R., Volkoff, A.-N., & Tamò, M. (2021). Progeny fitness determines the performance of the parasitoid Therophilus javanus, a prospective biocontrol agent against the legume pod borer. Scientific Reports, 11, 8990.
Soussi, R., & Le Ru, B. (1998). Influence of the host plant of the cassava mealybug Phenacoccus manihoti (Hemiptera: Pseudoccidae) on biological characteristics of its parasitoid Apoanagyrus lopezi (Hymenoptera: Encyrtidae). Bulletin of Entomological Research, 88, 75–82.
Spieles, D. J., & Horn, D. J. (1998). The importance of prey for fecundity and behaviour in the gypsy moth (Lepidoptera: Lymantriidae) predator Calosoma sycophanta (Cleoptera: Carabidae). Environmental Entomology, 27, 458–462.
Sreenivas, A. G., & Hardy, I. C. W. (2016). Mutual interference reduces offspring production in a brood-guarding bethylid wasp. Entomologia Experimentalis et Applicata, 159, 260–269.
Stacey, D. A., & Fellowes, M. D. E. (2002). Influence of temperature on pea aphid (Acyrthosiphon pisum) (Hemiptera: Aphididae) resistance to natural enemy attack. Bulletin of Entomological Research, 92, 351–357.
Stack, P. A., & Drummond, F. A. (1997). Reproduction and development of Orius insidiosus in a blue light-supplemented short photoperiod. Biological Control, 9, 59–65.
Stearns, S. C. (1992). The evolution of life histories. Oxford University Press.
Steffan, S. A., Daane, K. M., & Mahr, D. L. (2001). 15N-enrichment of plant tissue to mark phytophagous insects, associated parasitoids, and flower-visiting entomophaga. Entomologia Experimentalis et Applicata, 98, 173–180.
Stewart, L. A., Hemptinne, J.-L., & Dixon, A. F. G. (1991). Reproductive tactics of ladybird beetles: Relationships between egg size, ovariole number and development time. Functional Ecology, 5, 380–385.
Stewart, L. A., & Dixon, A. F. G. (1989). Why big species of ladybird beetles are not melanic. Functional Ecology, 3, 165–177.
Stinner, R. E., Butler, G. D., Jr., Bacheler, J. S., & Tuttle, C. (1975). Simulation of temperature-dependent development in population dynamics models. Canadian Entomologist, 107, 1167–1174.
Stinner, R. E., Gutierrez, A. P., & Butler, G. D. (1974). An algorithm for temperature dependent growth rate simulation. Canadian Entomologist, 106, 519–524.
Stoks, R. (2001). Food stress and predator-induced stress shape developmental performance in a damselfly. Oecologia, 127, 222–229.
Stokkebo, S., & Hardy, I. C. W. (2000). The importance of being gravid: Egg load and contest outcome in a parasitoid wasp. Animal Behaviour, 59, 1111–1118.
Stoltz, D. B. (1981). A putative baculovirus in the ichneumonid parasitoid Mesoleius tenthredinis. Canadian Journal of Microbiology, 27, 116–122.
Stoltz, D. B. (1986). Interactions between parasitoidderived products and host insects: An overview. Journal of Insect Physiology, 32, 347–350.
Stoltz, D. B., & Vinson, S. B. (1979). Viruses and parasitism in insects. Advances in Virus Research, 24, 125–171.
Strand, M. R. (1986). The physiological interactions of parasitoids with their hosts and their influence on reproductive strategies. In J. K. Waage & D. Greathead (Eds.), Insect parasitoids (pp. 97–136). Academic Press.
Strand, M. R. (2000). Development traits and life history evolution in parasitoids. In M. E. Hochberg & A. R. Ives (Eds.), Parasitoid population biology (pp. 139–162). Princeton University Press.
Strand, M. R. (2008). The insect cellular immune response. Insect Science, 15, 1–14.
Strand, M. R., & Burke, G. R. (2014). Polydnaviruses: Nature’s genetic engineers. Annual Review of Virology, 1, 333–354.
Strand, M. R., & Godfray, H. C. J. (1989). Superparasitism and ovicide in parasitic Hymenoptera: Theory and a case study of the ectoparasitoid Bracon hebetor. Behavioural Ecology and Sociobiology, 24, 421–432.
Strand, M. R., & Pech, L. L. (1995). Immunological basis for compatibilty in parasitoid-host relationships. Annual Review of Entomology, 40, 31–56.
Strand, M. R., & Vinson, S. B. (1985). In vitro culture of Trichogramma pretiosum on an artificial medium. Entomologia Experimentalis et Applicata, 391, 203–209.
Strand, M. R., Johnson, J. A., & Culin, J. D. (1988). Developmental interactions between the parasitoid Microplitis demolitor (Hymenoptera: Braconidae) and its host Heliothis virescens (Lepidoptera: Noctuidae). Annals of the Entomological Society of America, 81, 822–830.
Strand, M. R., Johnson, J. A., & Culin, J. D. (1990). Intrinsic interspecific competition between the polyembryonic parasitoid Copidosoma floridanum and solitary endoparasitoid Microplitis demolitor in Pseudoplusia includens. Entomologia Experimentalis et Applicata, 55, 275–284.
Strand, M. R., Meola, S. M., & Vinson, S. B. (1986). Correlating pathological symptoms in Heliothis virescens eggs with development of the parasitoid Telenomus heliothidis. Journal of Insect Physiology, 32, 389–402.
Strickland, E. H. (1923). Biological notes on parasites of prairie cutworms. Bulletin of the Department of Agriculture Dominion of Canada, Entomology Branch, 22, 1–40.
van Strien-van Liempt, W. T. F. H. (1983). The competition between Asobara tabida Nees von Esenbeck, 1834 and Leptopilina heterotoma (Thomson, 1862) in multiparasitized hosts. Netherlands Journal of Zoology, 33, 125–163.
Strohmeyer, H. H., Stamp, N. E., Jarzomski, C. M., & Bowers, D. M. (1998). Prey species and prey diet affect growth of invertebrate predators. Ecological Entomology, 23, 68–79.
Sullivan, D. J. (1971). Comparative behaviour and competition between two aphid hyperparasites: Alloxysta victrix and Asaphes californicus. Environmental Entomology, 1, 234–244.
Syrett, P., & Penman, D. R. (1981). Developmental threshold temperatures for the brown lacewing, Micromus tasmaniae (Neuroptera: Hemerobiidae). New Zealand Journal of Zoology, 8, 281–283.
Takagi, M. (1985). The reproductive strategy of the gregarious parasitoid, Pteromalus puparum (Hymenoptera: Pteromalidae). 1. Optimal number of eggs in a single host. Oecologia, 68, 1–6.
Tauber, M. J., Tauber, C. A., Nechols, J. R., & Obrycki, J. J. (1983). Seasonal activity of parasitoids: Control by external, internal and genetic factors. In V. K. Brown & I. Hodek (Eds.), Diapause and life cycle strategies in insects (pp. 87–108). Jung.
Tauber, M. J., Tauber, C. A., & Gardescu, S. (1993). Prolonged storage of Chrysoperla carnea (Neuroptera: Chrysopidae). Environmental Entomology, 22, 843–848.
Tauber, M. J., Tauber, C. A., & Nyrop, J. P. (1994). Soil moisture and postdormancy emergence of Colorado potato beetles (Coleoptera: Chrysomelidae): Descriptive model and field emergence patterns. Environmental Entomology, 23, 1485–1496.
Tauber, M. J., Tauber, C. A., Nyrop, J. P., & Villani, M. G. (1998). Moisture, a vital but neglected factor in the seasonal ecology of insects: Hypotheses and tests of mechanisms. Environmental Entomology, 27, 523–530.
Tauber, M. J., Tauber, C. A., & Masaki, S. (1986). Seasonal adaptations of insects. Oxford University Press.
Taylor, A. D. (1988). Host effects on larval competition in the gregarious parasitoid Bracon hebetor. Journal of Animal Ecology, 57, 163–172.
Taylor, A. J., Müller, C. B., & Godfray, H. C. J. (1998). Effect of aphid predators on oviposition behaviour of aphid parasitoids. Journal of Insect Behavior, 11, 297–302.
Taylor, R. M., & Foster, W. A. (1996). Spider nectarivory. American Entomologist, 42, 82–86.
Taylor, R. M., & Pfannenstiel, R. S. (2009). How dietary plant nectar affects the survival, growth, and fecundity of a cursorial spider Cheiracanthium inclusum (Araneae: Miturgidae). Environmental Entomology, 38, 1379–1386.
Teder, T. (1998). Limited variability of genitalia in the genus Pimpla (Hymenoptera: Ichneumonidae): Inter- or intraspecific causes? Netherlands Journal of Zoology, 48, 335–347.
Thompson, D. J. (1975). Towards a predator-prey model incorporating age-structure: The effects of predator and prey size on the predation of Daphnia magna by Ischnura elegans. Journal of Animal Ecology, 44, 907–916.
Thompson, D. J. (1978). Prey size selection by larvae of the damselfly Ischnura elegans (Odonata). Journal of Animal Ecology, 47, 786–796.
Thompson, D. J., & Fincke, O. M. (2002). Body size and fitness in Odonata, stabilising selection and a meta-analysis too far? Ecological Entomology, 27, 378–384.
Tillman, P. G., & Powell, J. E. (1992). Intraspecific host discrimination and larval competition in Microplitis croceipes, Microplitis demolitor, Cotesia kazak (Hym.: Braconidae), and Hyposoter didymator (Hym.: Ichneumonidae), parasitoids of Heliothis virescens (Lep.: Noctuidae). Entomophaga, 37, 429–437.
Tingle, C. C. D., & Copland, M. J. W. (1988). Predicting development of the mealybug parasitoids Anagyrus pseudococci, Leptomastix dactylopii, and Leptomastidea abnormis under glasshouse conditions. Entomologia Experimentalis et Applicata, 46, 19–28.
Tingle, C. C. D., & Copland, M. J. W. (1989). Progeny production and adult longevity of the mealybug parasitoids Anagyrus pseudococci, Leptomastix dactylopii, and Leptomastidea abnormis (Hym.: Encyrtidae) in relation to temperature. Entomophaga, 34, 111–120.
Tokeshi, M. (1985). Life-cycle and production of the burrowing mayfly, Ephemera danica: A new method for estimating degree-days required for growth. Journal of Animal Ecology, 54, 919–930.
Toth, R. S., & Chew, R. M. (1972). Development and energetics of Notonecta undulata during predation on Culex tarsalis. Annals of the Entomological Society of America, 65, 1270–1279.
Tran, T. V., & Takasu, K. (2000). Life history of the pupal parasitoid Diadromus subtilicornis (Gravenhorst) (Hymenoptera: Ichneumonidae) as influenced by temperature, photoperiod, and availability of food and hosts. Entomological Science, 3, 255–264.
Traynor, R. E., & Mayhew, P. J. (2005). A comparative study of body size and clutch size across the parasitoid Hymenoptera. Oikos, 109, 305–316.
Trimble, R. M., Blommers, L. H. M., & Helsen, H. H. M. (1990). Diapause termination and thermal requirements for postdiapause development in Aphelinus mali at constant and fluctuating temperatures. Entomologia Experimentalis et Applicata, 56, 61–69.
Tripathi, R. N., & Singh, R. (1991). Aspects of lifetable studies and functional response of Lysiphlebia mirzai. Entomologia Experimentalis et Applicata, 59, 279–287.
Tullberg, B. S., & Hunter, A. F. (1996). Evolution of larval gregariousness in relation to repellant defences and warning coloration in tree-feeding Macrolepidoptera: A phylogenetic analysis based on independent contrasts. Biological Journal of the Linnean Society, 57, 253–276.
Turlings, T. C., & Benrey, B. (1998). Effects of plant metabolites on the behavior and development of parasitic wasps. Ecoscience, 5, 321–333.
Turnbow, R. H., Jr., Franklin, R. T., & Nagel, W. P. (1978). Prey consumption and longevity of adult Thanasimus dubius. Environmental Entomology, 7, 695–697.
Turnbull, A. L. (1962). Quantitative studies of the food of Linyphia triangularis Clerk (Araneae: Linyphiidae). Canadian Entomologist, 94, 1233–1249.
Tylianakis, J. M., Didham, R. K., & Wratten, S. D. (2004). Improved fitness of aphid parasitoids receiving resource subsidies. Ecology, 85, 658–666.
Ueno, T. (1997). Effects of superparasitism, larval competition, and host feeding on offspring fitness in the parasitoid Pimpla nipponica (Hymenoptera: Ichneumonidae). Annals of the Entomological Society of America, 90, 682–688.
Unwin, D. M., & Corbet, S. A. (1991). Insects, plants and microclimate, naturalists’ handbooks no 15. Richmond Press.
Urbaneja, A., Llácer, E., Garrido, A., & Jacas, J.-A. (2001a). Effect of variable photoperiod on development and survival of Cirrospilus sp. nr lyncus (Hymenoptera: Eulophidae), an ectoparasitoid of Phyllocnistis citrella (Lepidoptera: Gracillariidae). Florida Entomologist, 84, 305–307.
Urbaneja, A., Llácer, E., Garrido, A., & Jacas, J. A. (2001b). Effect of temperature on the life history of Cirrospilus sp. near lyncus (Hymenoptera: Eulophidae), a parasitoid of Phyllocnistis citrella (Lepidoptera: Gracillariidae). Biological Control, 21, 293–299.
Valicente, F. H., & O’Neill, R. J. (1995). Effects of host plants and feeding regimes on selected life-history characteristics of Podisus maculiventris (Say) (Heteroptera, Pentatomidae). Biological Control, 5, 449–461.
Van Driesche, R. C. (1988). Field levels of encapsulation and superparasitism for Cotesia glomerata (L.) (Hymenoptera: Braconidae) in Pieris rapae (L.) (Lepidoptera: Pieridae). Journal of the Kansas Entomological Society, 61, 328–331.
Van Driesche, R. G., Bellotti, A., Herrera, C. J., & Castillo, J. A. (1986). Encapsulation rates of two encyrtid parasitoids by two Phenacoccus spp. of cassava mealybugs in Colombia. Entomologia Experimentalis et Applicata, 42, 79–82.
Varley, G. C., Gradwell, G. R., & Hassell, M. P. (1973). Insect population ecology: An analytical approach. Blackwell.
van Veen, J. C. (1981). The biology of Poecilostictus cothurnatus (Hymenoptera, Ichneumonidae) an endoparasite of Bupalus pinarius (Lepidoptera, Geometridae) Annales Entomologici Fennici, 47, 77–93.
Venkatesan, T., Murthy, K. S., Rabindra, R. J., & Baskaran, T. V. (2009). Influence of parasitoid-host density on the behaviour ecology of Goniozus nephantidis (Muesebeck) (Hymenoptera: Bethylidae), a parasitoid of Opisina arenosella Walker. Journal of Biological Control, 23, 255–264.
Venzon, M., Janssen, A., & Sabelis, M. W. (2002). Prey preference and reproductive success of the generalist predator Orius laevigatus. Oikos, 97, 116–124.
van Vianen, A., & van Lenteren, J. C. (1986). The parasite-host relationship between Encarsia formosa Cahan (Hym., Aphelinidae) and Trialeurodes vaporariorum (Westwood) (Hom., Aleyrodidae), XIV. Genetic and environmental factors influencing body-size and number of ovarioles of Encarsia formosa. Journal of Applied Entomology, 101, 321–331.
Vilhelmsen, L. (2003). Flexible ovipositor sheaths in parasitoid Hymenoptera (Insecta). Arthropod Structure & Development, 32, 277–287.
Vilhelmsen, L., Isidoro, N., Romani, R., Basibuyuk, H. H., & Quicke, D. L. J. (2001). Host location and oviposition in a basal group of parasitic wasps: The subgenual organ, ovipositor apparatus and associated structures in the Orussidae (Hymenoptera, Insecta). Zoomorphology, 121, 63–84.
Vinson, S. B., & Iwantsch, G. F. (1980a). Host regulation by insect parasitoids. Quarterly Review of Biology, 55, 143–164.
Vinson, S. B., & Iwantsch, G. F. (1980b). Host suitability for insect parasitoids. Annual Review of Entomology, 25, 397–419.
Vinson, S. B., & Sroka, P. (1978). Effects of superparasitism by a solitary endoparasitoid on the host, parasitoid and field samplings Southwestern Entomologist, 3, 299–303.
Visser, M. E. (1994). The importance of being large: The relationship between size and fitness in females of the parasitoid Aphaereta minuta (Hymenoptera: Braconidae). Journal of Animal Ecology, 63, 963–978.
Visser, M. E., van Alphen, J. J. M., & Nell, H. W. (1990). Adaptive superparasitism and time allocation in solitary parasitoids: The influence of the number of parasitoids depleting the patch. Behaviour, 114, 21–36.
Visser, M. E., Luyckx, B., Nell, H. W., & Boskamp, G. J. F. (1992). Adaptive superparasitism in solitary parasitoids: Marking of parasitised hosts in relation to the pay-off from superparasitism. Ecological Entomology, 17, 76–82.
Waage, J. K. (1979). Dual function of the damselfly penis: Sperm removal and transfer. Science, 203, 916–918.
Waage, J. K. (1984). Sperm competition and the evolution of odonate mating systems. In R. L. Smith (Ed.), Sperm competition and the evolution of animal mating systems (pp. 257–290). Academic Press.
Waage, J. K., & Ng, S.-M. (1984). The reproductive strategy of a parasitic wasp. I. Optimal progeny and sex allocation in Trichogramma evanescens. Journal of Animal Ecology, 53, 401–416.
Wäckers, F. (2001). A comparison of nectar- and honeydew sugars with respect to their utilization by the hymnopteran parasitoid Cotesia glomerata. Journal of Insect Physiology, 47, 1077–1084.
Wagner, T. L., Wu, H.-I., Sharpe, P. J. H., & Coulson, R. N. (1984). Modeling distributions of insect development time: A literature review and application of the Weibull function. Annals of the Entomological Society of America, 77, 475–487.
Wajnberg, E., Boulétreau, M., Prevost, G., & Fouillet, P. (1990). Developmental relationships between Drosophila larvae and their endoparasitoid Leptopilina (Hymenoptera: Cynipidae) as affected by crowding. Archives of Insect Biochemistry and Physiology, 13, 239–245.
Wajnberg, E., Curty, C., & Jervis, M. (2012). Intra-population genetic variation in the temporal pattern of egg maturation in a parasitoid wasp. PLoS ONE, 7, e45915.
Waldbauer, C. P. (1968). The consumption and utilization of food by insects. Advances in Insect Physiology, 5, 229–288.
Walker, G. P., MacDonald, F. H., Wallace, A. R., & Cameron, P. J. (2016). Interspecific competition among Cotesia kazak, Microplitis croceipes, and Meteorus pulchricornis (Hymenoptera: Braconidae), larval parasitoids of Helicoverpa armigera (Lepidoptera: Noctuidae) in New Zealand. Biological Control, 93, 65–71.
Wallin, H., Chiverton, P. A., Ekbom, B. S., & Borg, A. (1992). Diet, fecundity and egg size in some polyphagous predatory carabid beetles. Entomologia Experimentalis et Applicata, 65, 129–140.
Walsh, B. S., Parratt, S. R., Hoffmann, A. A., Atkinson, D., Snook, R. R., Bretman, A., & Price, T. A. (2019). The impact of climate change on fertility. Trends in Ecology and Evolution, 34, 249–259.
Wang, T., & Keller, M. A. (2020). Larger is better in the parasitoid Eretmocerus warrae (Hymenoptera: Aphelinidae). Insects, 11, 39.
Wang, T., & Laing, J. E. (1989). Diapause termination and morphogenesis of Holcothorax testaceipes Ratzeburg (Hymenoptera, Encyrtidae), an introduced parasitoid of the spotted tentiform leafminer, Phyllonorycter blancardella (F.). (Lepidoptera, Gracillariidae). Canadian Entomologist, 121, 65–74.
War, A. R., Paulraj, M. G., Ahmad, T., Buhroo, A. A., Hussain, B., Ignacimuthu, S., & Sharma, H. C. (2012). Mechanisms of plant defense against insect herbivores. Plant Signaling & Behavior, 7, 1306–1320.
Watanabe, M. (2002). Cold tolerance and myo-inositol accumulation in overwintering adults of a ladybeetle, Harmonia axyridis (Coleoptera: Coccinellidae). European Journal of Entomology, 99, 5–9.
Watt, T. J., Duan, J. J., Tallamy, D. W., Hough-Goldstein, J., Ilvento, T. W., Yue, X., & Ren, H. (2016). Reproductive and developmental biology of the emerald ash borer parasitoid Spathius galinae (Hymenoptera: Braconidae) as affected by temperature. Biological Control, 96, 1–7.
Webb, B. A. (1998). Polydnavirus biology, genome structure, and evolution. In L. K. Miller & L. A. Ball (Eds.), The insect viruses (pp. 105–139). Plenum Press.
Wei, K., Tang, Y. L., Wang, X. Y., Cao, L. M., & Yang, Z. Q. (2014). The developmental strategies and related profitability of an idiobiont ectoparasitoid Sclerodermus pupariae vary with host size. Ecological Entomology, 39, 101–108.
Weisser, L. A., & Stamp, N. (1998). Combined effects of allelochemicals, prey availability, and supplemental food on growth of a generalist predator. Entomologia Experimentalis et Applicata, 87, 181–189.
Weisser, W. W., Völkl, W., & Hassell, M. P. (1997). The importance of adverse weather conditions for behaviour and population ecology of an aphid parasitoid. Journal of Animal Ecology, 66, 386–400.
Welch, R. C. (1993). Ovariole development in Staphylinidae (Coleoptera). Invertebrate Reproduction and Development, 23, 225–234.
Went, D. F., & Krause, G. (1973). Normal development of mechanically activated, unlaid eggs of an endoparasitic hymenopteran. Nature, 244, 454–455.
Weseloh, R. M. (1972). Sense organs of the hyperparasite Cheiloneurus noxius (Hymenoptera: Encyrtidae) important in host selection processes. Annals of the Entomological Society of America, 65, 41–46.
Weseloh, R. M. (1986). Effect of photoperiod on progeny production and longevity of gypsy moth (Lepidoptera: Lymantriidae) egg parasite Ooencyrtus kuvanae (Hymenoptera: Encyrtidae). Environmental Entomology, 15, 1149–1153.
West, S. A., Flanagan, K. E., & Godfray, H. C. J. (1996). The relationship between parasitoid size and fitness in the field, a study of Achrysocharoides zwoelferi (Hymenoptera: Eulophidae). Journal of Animal Ecology, 65, 631–639.
Whalon, M. E., & Smilowitz, Z. (1979). The interaction of temperature and biotype on development of the green peach aphid, Myzus persicae (Sulz.). American Potato Journal, 56, 591–596.
Wickman, P.-O., & Karlsson, B. (1989). Abdomen size, body size and the reproductive effort of insects. Oikos, 56, 209–214.
Wiebe, A. P., & Obrycki, J. J. (2002). Prey suitability of Galerucella pusilla eggs for two generalist predators, Coleomegilla maculata and Chrysoperla carnea. Biological Control, 23, 143–148.
Wigglesworth, V. B. (1972). The principles of insect physiology. Methuen.
Wilbert, H., & Lauenstein, G. (1974). Die eignung von Megoura viciae (Buckt.) (Aphid) für larven und erwachsene weibehen von Aphelinus asychus Walker (Aphelinidae). Oecologia, 16, 311–322.
de Wilde, J., & de Loof, A. (1973). Reproduction. In M. Rockstein (Ed.) The physiology of the insecta (Vol. I, 2nd ed., pp. 11–95). Academic Press.
Williams, D. D., & Feltmate, B. W. (1992). Aquatic insects. CAB International.
Williams, H. J., Elzen, G. W., & Vinson, S. B. (1988). Parasitoid-host plant interactions emphasizing cotton (Gossypium). In P. Barbosa & D. Letourneau (Eds.), Novel aspects of insect-plant allelochemicals and host specificity (pp. 171–200). John Wiley.
Wink, M., Grimm, C., Koschmieder, C., Sporer, F., & Bergeot, O. (2000). Sequestration of phorbolesters by the aposematically coloured bug Pachycoris klugii (Heteroptera: Scutelleridae) feeding on Jatropha curcas (Euphorbiaceae). Chemoecology, 10, 179–184.
Wolf, R., & Wolf, D. (1988). Activation by calcium ionophore injected into unfertilized ovarian eggs explanted from Pimpla turionellae (Hymenoptera). Zoologische Jahrbucher, Abteilung für Allgemeine Zoologie und Physiologie der Tiere, 92, 501–512.
Wratten, S. D. (1973). The effectiveness of the coccinellid beetle, Adalia bipunctata (L.), as a predator of the lime aphid, Eucallipterus tiliae L. Journal of Animal Ecology, 42, 785–802.
Wratten, S. D., Lavandero, B. I., Tylianakis, J., Vattala, D., Cilgi, T., & Sedcole, R. (2003). Effects of flowers on parasitoid longevity and fecundity. New Zealand Plant Protection, 56, 239–245.
Wylie, H. C. (1983). Delayed development of Microctonus vittatae (Hymenoptera: Braconidae) in superparasitised adults of Phyllotreta cruciferae (Coleoptera: Chrysomelidae). Canadian Entomologist, 115, 441–442.
Wysoki, M., de Long, M., & Rene, S. (1988). Trichogramma platneri Nagarkatti (Hymenoptera: Trichogrammatidae), its biology and ability to search for eggs of two lepidopterous avocado pests, Boarmia (Ascotis) selenaria (Schiffermuller) (Geometridae) and Cryptoblabes gnidiella (Milliere) (Phycitidae) in Israel in Trichogramma and other egg parasites (Eds. J. Voegelé, J. K. Waage and J. C. van Lenteren). INRA, Paris (IInd International Symposium Guanghzou, China, Nov. 10–15, 1986). Les Colloques de L’INRA, 43, 295–301.
Yasuda, H. (1995). Effect of prey density on behaviour and development of the predatory mosquito, Toxorhynchites towadensis. Entomologia Experimentalis et Applicata, 76, 97–103.
Ye, X. Q., Shi, M., Huang, J. H., & Chen, X. X. (2018). Parasitoid polydnaviruses and immune interaction with secondary hosts. Developmental and Comparative Immunology, 83, 124–129.
Yeargan, K. V., & Barney, W. E. (1996). Photoperiodic induction of reproductive diapause in the predators Nabis americoferus and (Heteroptera: Nabidae). Annals of the Entomological Society of America, 89, 70–74.
Yu, D. S., Luck, R. F., & Murdoch, W. W. (1990). Competition, resource partitioning and coexistence of an endoparasitoid Encarsia perniciosi and an ectoparasitoid Aphytis melinus of the California red scale. Ecological Entomology, 15, 469–480.
Zacaro, A. A., & Porter, S. D. (2003). Female reproductive system of the decapitating fly Pseudacteon wasmanni Schmitz (Diptera: Phoridae). Arthropod Structure and Development, 31, 329–337.
Zaslavsky, V. A., & Vagina, N. P. (1996). Joint and separate effects of photoperiodic and alimentary induction of diapause in Coccinella septempunctata (Coleoptera, Coccinellidae). Zoologichesky Zhurnal, 75, 1474–1482.
Zaviezo, T., Soares, A. O., & Grez, A. A. (2019). Interspecific exploitative competition between Harmonia axyridis and other coccinellids is stronger than intraspecific competition. Biological Control, 131, 62–68.
Zheng, Y., Hagen, K. S., Daane, K. M., & Mittler, T. E. (1993a). Influence of larval dietary supply on the food consumption, food utilisation efficiency, growth and development of the lacewing Chrysoperla carnea. Entomologia Experimentalis et Applicata, 67, 1–7.
Zheng, Y., Hagen, K. S., Daane, K. M., & Mittler, T. E. (1993b). Influence of larval food consumption on the fecundity of the lacewing Chrysoperla carnea. Entomologia Experimentalis et Applicata, 67, 9–14.
Zimmerman, M. P., Chan, D. M., Kester, K. M., Rael, R. C., & Robertson, S. L. (2021). The effects of allelochemical transfer on the dynamics of hosts, parasitoids, and competing hyperparasitoids. Natural Resource Modeling, 34, e12311.
Zwölfer, H. (1971). The structure and effect of parasite complexes attacking phytophagous host insects. In P. J. den Boer & G. R. Gradwell (Eds.), Dynamics of populations, proceedings of the advanced study institute on ‘Dynamics of numbers in populations’, Oosterbeck, 1970 (pp. 405–418). Centre for Agricultural Publishing and Documentation.
Zwölfer, H. (1979). Strategies and counterstrategies in insect population systems competing for space and food in flower heads and plant galls. Fortschritte für Zoologie, 25, 331–353.
Acknowledgements
The previous version of this chapter was written by Mark Jervis, Mike Copland and Jeffrey Harvey. For help with, and comments on, that version we thank Jacques van Alphen, Michael Benson, Francis Gilbert, Neil Kidd, Manfred Mackauer, Mike Majerus, John Morgan and Kevin Munn. The current version was revised by J.A. Harvey and K.S. Shameer. We thank Ian Hardy and Eric Wajnberg for comments and suggestions.
Author information
Authors and Affiliations
Corresponding author
Editor information
Editors and Affiliations
Rights and permissions
Copyright information
© 2023 Springer Nature Switzerland AG
About this chapter

Cite this chapter
Jervis, M.A., Copland, M.J.W., Shameer, K.S., Harvey, J.A. (2023). The Life-Cycle. In: Hardy, I.C., Wajnberg, E. (eds) Jervis's Insects as Natural Enemies: Practical Perspectives. Springer, Cham. https://doi.org/10.1007/978-3-031-23880-2_2
Download citation
DOI: https://doi.org/10.1007/978-3-031-23880-2_2
Published:
Publisher Name: Springer, Cham
Print ISBN: 978-3-031-23879-6
Online ISBN: 978-3-031-23880-2
eBook Packages: Biomedical and Life SciencesBiomedical and Life Sciences (R0)