
Abstract
The role of robust design optimization (RDO) has been eminent, ascertaining optimal configuration of engineering systems in the presence of uncertainties. However, computational aspect of RDO can often get tediously intensive in dealing with large scale systems. To address this issue, hybrid polynomial correlated function expansion (H-PCFE) based RDO framework has been developed for solving computationally expensive problems. H-PCFE performs as a bi-level approximation tool, handling the global model behavior and local functional variation. Analytical formula for the mean and standard deviation of the responses have been proposed, which reduces significant level of computations as no further simulations are required for evaluating the statistical moments within the optimization routine. Implementation of the proposed approaches have been demonstrated with two benchmark examples and two practical engineering problems. The performance of H-PCFE and its analytical version have been assessed by comparison with direct Monte Carlo simulation (MCS). Comparison with popular state-of-the-art techniques has also been presented. Excellent results in terms of accuracy and computational effort obtained makes the proposed methodology potential for further large scale industrial applications.
1 Introduction
History has witnessed the inevitable role of optimization in engineering science and technology. Edge cutting performances of manufactured industrial products have been the consequences of employing advanced level design optimization tools. In dealing with large and complex systems, efficient algorithms of engineering design optimization have been prerequisites at every stage for reducing cost, time and increase functionality in substance. However, conventional design optimization (Fang et al. 2015) may not always meet the required objectives, especially in presence of uncertainties. They can easily lead to significant fluctuations from the desired performance and consequently add to the life cycle costs including inspection planning, repair and maintenance programs. The presence of uncertainties are unavoidable in manufacturing and operational activity in industries. Therefore, incorporation of effect of uncertainty on product analysis and design is of paramount importance to the engineering community.
The mitigation of the effect of uncertainty on optimization can be effectively performed with the help of robust design optimization (RDO). RDO has been developed in order to improve the product quality and reliability in industrial engineering. Hence, the role of RDO lies in redefining the optimization in terms of robustness. RDO has been successfully applied in various fields such as telecommunications and electronics (Taguchi 1986, 1987; Phadke 1989), aerospace (Hicks and Henne 1978; Sobieszczanski-Sobieski and Haftka 1997; Alexandrov and Lewis 2002), ship design (Sen and Yang 1998; Parsons and Scott 2004; Hart and Vlahopoulos 2009; Diez and Peri 2010), automobile (Hwang et al. 2001; Sun et al. 2011; Fang et al. 2013), structural mechanics (Doltsinis and Kang 2004; Lagaros et al. 2007; Lee et al. 2009), structural dynamic analysis and vibration control (Zang et al. 2005; Roy et al. 2014; Cheng et al. 2014; Roy and Chakraborty 2015), fatigue analysis (McDonald and Heller 2004; Lee and Jung 2006; Li et al. 2011) in the past.
RDO provides a mathematical framework for optimization motivated to minimize the propagation of input uncertainty to output responses (Chen et al. 1996; Ramakrishnan and Rao 1996; Du and Chen 2000; Huang and Du 2007; Beyer and Sendhoff 2007). The objective and/or constraint functions in RDO involve mean and standard deviation of stochastic responses. The solution of RDO would require uncertainty quantification of stochastic responses. Moreover, gradient based optimization algorithms make the problem computationally demanding. Therefore, RDO problems are computationally intensive, if not prohibitive, and require significantly improved and efficient design paradigms (Lucas 1994; Schuëller and Jensen 2008).
For addressing the issues of computational inefficiency, various meta-modelling schemes have evolved. These techniques decrease the simulation time significantly by approximating the underlying computational model in a sample space (Bucher and Bourgund 1990). The widely used techniques available in the literature are least squares approximation (Kim and Na 1997), moving least square (Kang et al. 2010; Goswami et al. 2016), polynomial chaos expansion (PCE) (Jacquelin et al. 2015), high dimensional model representation (Rao and Chowdhury 2009; Chowdhury and Rao 2009), Kriging (Kaymaz 2005) and radial basis function (RBF) (Deng 2006). A review of various techniques of this kind can be found in (Sacks et al. 1989; Giunta et al. 1998; Jin et al. 2001; Sudret 2012; Chatterjee et al. 2017). One may also be interested in recent meta-modelling techniques (Zhao et al. 2010; Dai et al. 2015; Volpi et al. 2015; Liu et al. 2015; Shu and Gong 2016; Chatterjee and Chowdhury 2017).
In this paper, a novel RDO framework based on hybrid polynomial correlated function expansion (H-PCFE) has been developed to improve the performance and cost effectiveness of existing RDO methodology in case of computationally expensive problems, especially those involving finite element (FE) analysis, computational fluid dynamics (CFD) etc. As previously mentioned, the objective and/or, constraint functions often involve mean and standard deviation of responses. To compute the statistical moments, large number of simulations are required. Therefore, analytical formulae for approximating the first two statistical moments have been proposed by utilizing H-PCFE. This reduces a significant level of computations for each function evaluation in optimization iteration. The proposed approaches have been applied to two benchmark examples and two FE truss models. The robust optimal solution results obtained using H-PCFE have been validated with that of direct Monte Carlo simulation (MCS). Comparison has also been performed with that of few other standard surrogate models.
The rest of the paper has been organized in the following sequence. In Section 2, various formulations of RDO have been discussed, which cover its entire framework. The proposed approach to be incorporated in RDO formulation has been presented in Section 3. The analytical expressions for approximating the statistical moments have been illustrated in Section 4. The proposed approaches have been applied to few examples in Section 5. Finally, conclusion has been drawn by discussing the results obtained from the study.
2 Robust design optimization (RDO)
Unlike deterministic design optimization which do not account for uncertainties, an RDO problem develops a solution which is least sensitive to variations of the nominal design. Thus, the goal of RDO is that of minimizing the effects of uncertainties involved in system design without suppressing their causes (Zang et al. 2005).
Several past works (Chen et al. 1996; Zang et al. 2005; Park et al. 2006; Beyer and Sendhoff 2007; Schuëller and Jensen 2008) have assigned different type of interpretations to RDO depending on the application and hence attracted various forms of problem formulation. The various indices of robustness assessment have been summarized as follows:
-
(i)
Minimization of the standard deviation (SD) of objective function pertaining to usual constraints as illustrated by (1). This design leads to robustness in a strict sense with minimum sensitivity with respect to the variation of the probabilistic parameters (Taguchi 1986).
Where, σ(f(x, d)) denotes the standard deviation of objective function, x denotes the random variables and dL and dU represents lower and upper bounds of the design variable d. Often in practice, design variables in RDO are nothing but mean of the random variables.
-
(ii)
Multi objective optimization by minimizing the objectives as illustrated by (2) (Doltsinis and Kang 2004; Zang et al. 2005).
Where, μ(f(x, d)) denotes the mean of objective function.
Two possible alternatives for solving (2) exists in literature. The first alternative couples the two objectives by assigning relevant weightages to each of the respective functions (Chen et al. 1996) as,
Where the weighing factor α represents the relative importance of two objectives. μ∗ and σ∗ are the outcomes of ideal design. The primary advantage of this approach resides in its simplicity. However, with this method and other related improvements (Chen et al. 1991, 2000; Messac 1996), it is not possible to cover the design domain over the Pareto front. The second alternative uses multi-objective optimization algorithms to directly address the problem as stated in (2) (Marano et al. 2010; Fang et al. 2015). Popular multi-objective optimization algorithms include, multi-objective genetic algorithm (Fonseca and Fleming 1995), strength Pareto evolutionary algorithm (Zitzler 1999; Zitzler et al. 2001) non-dominated sorting genetic algorithm (Srinivas and Deb 1994; Deb et al. 2002), multi-objective particle swarm optimization (Sierra and Coello 2005), multi-objective evolutionary algorithm based on decomposition (Zhang and Li 2007), etc.
-
(iii)
Minimization of percentile difference, which is defined by
where, \( P\left(f\le {f}^{\alpha_i}\right)={\alpha}_i\kern0.36em \forall i=1,2 \) (Du et al. 2004; Huang and Du 2007). It has been observed that minimizing \( \varDelta {f}_{\alpha_1}^{\alpha_2} \) leads to restricting the variation of the probability distribution of f(x). Although more accurate, this index is only applicable for unimodal distributions, unlike the above representations.
Moreover, in context to feasibility robustness of the constraints, one is referred to (Du and Chen 2000). Since the development of an analytical moment approximation based framework is the primary motive of this study, therefore the RDO form as illustrated in (3) has been adopted. However, it is to be noted that the proposed approach preserves the generality of an RDO framework so that representations other than (3) may be utilized.
The associated computational costs in RDO often prove to be prohibitive, especially in large scale problems involving FE and CFD modelling (Myers et al. 1992; Eggert and Mayne 1993; Gupta and Li 2000). To address the issue of computational efficiency, a novel meta-model assisted RDO framework based on hybrid polynomial correlated function expansion (H-PCFE) has been proposed. H-PCFE has been incorporated within the RDO framework to compute the optimal solution in an efficient manner. A flowchart depicting the flow synthesizing the computationally efficient framework of RDO has been shown in Fig. 1. The detailed formulation has been presented in the following section (Section 3) in order to explain the theoretical framework and implementation of H-PCFE.

Flowchart illustrating the H-PCFE assisted RDO framework
3 Hybrid polynomial correlated function expansion (H-PCFE)
H-PCFE (Chakraborty and Chowdhury 2016a; Chatterjee et al. 2016; Majumder et al. 2017) is a novel metamodelling technique formulated by coupling polynomial correlated function expansion (PCFE) (Chakraborty and Chowdhury 2016b, 2016c, 2017a, 2017b) with Kriging (Biswas et al. 2016, 2017; Mukhopadhyay et al. 2017). H-PCFE, as compared to other metamodels, has two major advantages. Firstly, H-PCFE performs a bi-level approximation: first on a global scale by using PCFE (Chakraborty and Chowdhury 2016b, 2017a, 2017b) and second, on a local scale by using Kriging (Biswas et al. 2016, 2017; Mukhopadhyay et al. 2017). Secondly, H-PCFE, by default has an error metric. This, in turn, provides the opportunity to locally refine the model generated by H-PCFE (Chakraborty and Chowdhury 2017c, 2017d).
To introduce the functional form of H-PCFE, let us suppose x = (x1, x2, …, xN) are the input variables, where x ∈ D ⊂ ℝN. The output M(H − PCFE) can be represented in terms of extended bases as
where, \( \mathbf{i}=\left({i}_1,{i}_2,\dots, {i}_N\right)\in {\mathrm{\mathbb{N}}}_0^N \) and N ≥ 0 is an integer, g0is a constant term representing the zeroth order component function or the mean response of response function M(H − PCFE). M and s represent order of component function and order of basis, respectively. Z(x, ω) denotes a zero mean, unit variance Gaussian process and σ2 denotes the process variance. The set of hyperparameters θ defines the autocorrelation R(x, x′; θ) between two points x and x′. Some of the popular autocorrelation functions can be found in (Echard et al. 2011).
-
Definition 1: Two subspace A and H in Hilbert space are spanned by basis {a1, a2, …, al} and {h1, h2, …, hm} respectively. If (i) H ⊃ A and (ii) H = A ⊕ A⊥ where, A⊥ is the orthogonal complement subspace of A in H, H is termed as extended basis and A as non-extended basis.
-
Definition 2: The expression obtained by substituting M = S in ( 5 ) is termed as Sth order H-PCFE. A Sth order H-PCFE consists of all the component functions up to Sth order, i.e., while first-order H-PCFE consists zeroth and first order component functions, a second-order H-PCFE consists zeroth, first and second order component functions. Therefore, adding all the Sth order component functions to an existing (S − 1)th order H-PCFE would yield the Sth order H-PCFE expression.
The solution of (5) with respect to α may be obtained as
where, d is the difference of response and g0. For the derivation of (6), one is referred to (Chatterjee et al. 2016). In general, the correlation parameters θ are a priori unknown. The optimal parameters have been obtained by maximum likelihood estimate (Marrel et al. 2008; Dubourg 2011). The objective function to be minimized is obtained as
Alternatively, (6) can be represented as
where, B = ψTR−1ψ,C = ψTR−1d,α = α∗. Since H-PCFE employs extended bases as already illustrated by (5), some of the equations in (8) have been found to be identical. These equations are redundant and hence can be removed. Removing the redundant from (8), one obtains
where, B′ and C′ correspond to B and C, respectively, after removing the redundant equations. The resulting underdetermined set of equations are depicted in (9), for which infinite number of solutions exist. The motive is to determine the best solution out of the available solutions.
-
Definition 3: Out of all the possible solutions of ( 9 ), the solution that minimizes the least squared error and satisfies the hierarchical orthogonality criterion of the component functions, is termed as the best solution.
In this context, homotopy algorithm has been employed for obtaining the best solutions (Li and Rabitz 2010; Chakraborty and Chowdhury 2015; Chatterjee et al. 2016) as,
where, U and V are obtained by singular value decomposition of PWHA matrix
and
(B′)† in (10) and (12) is the generalized inverse of B', satisfying all four Penrose conditions (Rao and Mitra 1971). WHA in (11) is the weight matrix utilized for formulating the objective function in the homotopy algorithm.
Once the unknown coefficients associated with the bases in (9) are determined, the prediction mean and prediction variance are given as:
and
where
at the prediction point xp and
-
Remark 2: One important aspect associated with H-PCFE is selection of suitable correlation matrix R. Based on observation of previous researchers (Kaymaz 2005; Dubourg 2011; Mukhopadhyay et al. 2016), Gaussian correlation function has been used due to its superior performance.
For smooth understanding of the readers, the computational paradigm of H-PCFE has been presented in a sequential manner in algorithm 1.

It should be clear that in order to compute the response statistics, simulations have to be performed on the approximation model generated by H-PCFE (by utilizing Algorithm 1). This may require significant time, especially in case of problems involving large number of random variables, as response statistics is to be computed at each functional evaluation of optimization iteration. Therefore, analytical formulae for mean and standard deviation of responses by utilizing H-PCFE has been developed, which requires no further simulations, reducing a significant level of computations. This has been explained in the next section (Section 4).
4 Analytical formulae for the statistical moments: H-PCFE based approach
For deriving analytical formulae for the statistical moments, (13) is rewritten as:
Where,
corresponds to PCFE and
corresponds to Kriging. Now, taking expectation of both sides,
where E(•) denotes the expectation operator. Similarly, taking variance of both sides,
where, var(•) denotes the variance operator and cov(•) denotes the covariance operator. However, for practical implementation, the covariance term was found to be insignificant as compared to the variance terms. Hence, for simplification, the same has not been considered. Moreover, if analytical expressions for the first two moments corresponding to PCFE and Kriging can be developed, the same can be substituted into (20) and (21) for computing the first two moments of H-PCFE. In this regard, it is to be noted that analytical expression for the first two moments of PCFE has already been presented in (Chakraborty and Chowdhury 2016b, 2017b):
where α represents the unknown coefficients computed using HA. Hence, all that remains is to compute analytical expression for the first two statistical moments of Kriging and the covariance term. To this end, (19) is again rewritten as:
where n is the number of samples, γi is the ith element of γ vector obtained as (Chatterjee et al. 2016):
It is to be noted that γi is independent of the prediction point x and only depends on the training points (Dubourg 2011). Now, noting that Gaussian correlation function has been utilized, (24) can be further modified as:
where \( k={\sigma}^2{\left(2\pi \right)}^{d/2}\prod \limits_j{\theta}_j \) and \( \mathrm{\mathbb{N}}\left({x}_j|{x}_i^j,{\theta}_j^2\right) \) denotes that variable xj is normally distributed with mean \( {x}_i^j \) and variance \( {\theta}_j^2 \). Taking expectation of both sides of (26),
where \( {\varpi}_{x_j} \) is the PDF of variable xj. Now assuming that the variables are uniformly distributed, (27) can be rewritten as
where \( {x}_j^{ll} \) and \( {x}_j^{ul} \) denote lower limit and upper limit of variable xj and Φ(•) denotes cumulative distribution function of standard normal variable. (28) represents the analytical formula for first moment using Kriging. Combining (22) and (28), the overall mean is given as:
Next, applying variance on both sides of (26)
Now considering the product of correlation functions in (30) and simplifying,
Similar to previous case, assuming the variables to be uniformly distributed, (32) reduces to
(33) is the formula for computing variance by using Kriging. Using (23) and (33), analytical expression for the variance is given as:
Thus, with the help of (29) and (34), the mean and variance of responses can be obtained analytically by utilizing H-PCFE. In this context, it is important to note that the above formulae hold only when the variables are uniformly distributed. Direct application of this formulae to non-uniform variables is not possible.
To address the issue highlighted above, the input variable is projected on to ξ, such that
where Φ(•) denotes the CDF of the variable x. With this transformation, ξ is uniformly distributed, \( \xi \sim \mathcal{U}\left(0,1\right) \). Thereafter, a H-PCFE model between ξ and the output response y is trained and the mean and standard deviation of responses are obtained by using the formulae discussed above (since ξ is uniformly distributed, direct application of the formulae are possible). Transformations for popular PDFs have been illustrated in Appendix B.
-
Remark 3: As a further generalization, if the underlying problem is having correlated and non-uniform variables, one must first project the variables into a space having uncorrelated and uniform variables before using the analytical formulae shown in (29) and (34). The details on how to project a correlated and non-uniform variable to space having uncorrelated and uniform variables can be found in (Chakraborty and Chowdhury 2016b).
The above analytical framework has been utilized in RDO so as to avoid simulations in each optimization call to approximate the response statistics. The computationally efficient RDO framework has been depicted by the flowchart in Fig. 2. The point of improvement in the RDO framework in Fig. 2 as compared to the one previously proposed in Fig. 1 can be easily identified as no MCS will be required for approximating the response statistical quantities, minimizing a significant level of computations for each functional call in the optimization routine.

Flowchart of the improved RDO framework based on analytical approximation of statistical moments by H-PCFE
Next, the two proposed RDO frameworks have been applied to solve few problems in order to investigate their performance both in terms of accuracy and computational efficiency.
5 Numerical examples
In this section, the proposed approaches have been applied to four RDO problems in order to illustrate its approximation potential within limited computational effort. Out of the various available uniform and non-uniform sampling techniques, Latin-hypercube sampling (McKay et al. 1979) has been utilized in this paper. Further, sequential quadratic programming algorithm has been utilized as the optimization routine for solving the following problems. In doing so, MATLAB® toolbox fmincon has been employed. The results obtained by the proposed approaches have been validated with that of direct MCS and compared with that of few standard surrogate models.
In order to ensure that the number of training points have converged, convergence study has been carried out by gradually increasing the number of training points. To compute the accuracy of the surrogate models, leave one out cross validation (LOOCV) has been used. For all the four examples carried out corresponding to the response functions, convergence of the surrogate models based on LOOCV error have been presented in Section A.1 of Appendix A. For computing the optimum number of samples in MCS, convergence study has been carried out where the change in mean and SD of response due to increase in sample points have been investigated. When the change in mean and SD of response is within the predefined tolerance, MCS has been considered to have converged. Additionally, the confidence intervals (95%) have also been presented. The convergence study for determining the optimum number of MCS for all the four examples have been illustrated in Section A.2 of Appendix A.
H-PCFE based RDO which requires simulations in order to approximate the statistical response quantities as illustrated in Fig. 2 has been mentioned as ‘H-PCFE’ from now onwards. H-PCFE based RDO which utilizes (29) and (34) (refer Section 4) to approximate the statistical response quantities explicitly has been labelled as ‘Analytical H-PCFE’ from henceforth. It is quite obvious that statistical response terms involved in objective and constraint functions have been analytically determined by the above equations in case of analytical H-PCFE.
5.1 Example 1: Conceptual design of a bulk carrier
The proposed RDO formulation has been applied to conceptual design of a bulk carrier as illustrated in Fig. 3 (Sen and Yang 1998; Parsons and Scott 2004). The basic cost function of the optimization problem has been considered to be the unit transportation cost. The design variables have been described in Table 1. The formulation involves some design constraints and have been constructed based on geometry, stability and model validity. Uncertainties from multiple sources have been accounted for the proposed RDO formulation.

A typical cross-sectional view of a bulk carrier
The mathematical model of the cost function has been presented below,
With the help of (45), Vk has units of m/s and g = 9.8065 m/s2 in (44).
The unit transportation cost (UTC), which is the objective function of the optimized conceptual design of a bulk carrier and can be evaluated using (62). The constraints pertaining to the optimization problem have been defined in (63) – (70).
Where, KB, BMT and KG have been defined in (71) – (73), respectively.
The description of random variables have been provided in Table 2. Two case studies have been performed for various configurations of objective function for RDO as presented in Table 3.
The optimized design variables and objective function values obtained have been presented in Tables 4 and 5 corresponding to the case studies provided in Table 3. The total number of sample points employed for training the surrogate models and MCS are 128 and 105, respectively. Remarkable similar results have been observed on comparing the performance of H-PCFE and its analytical version with that of MCS. It is worth noting that the accuracy achieved in case of analytical H-PCFE is quite high, considering the fact that no simulations are required within each optimization cycle. It is also clear from the results that the proposed approaches have outperformed standard models, such as, PCE, RBF and artificial neural network (ANN) in terms of approximation accuracy.
5.2 Example 2: Welded beam design
The second example considered is that of a welded beam design as shown in Fig. 4 (Deb 2001). The objective is to minimize the cost of the beam subject to constraints on shear stress, bending stress, buckling load, and end deflection. There are four continuous design variables, namely, beam thickness t(=x1), beam width b(=x2), weld length l(=x3), and weld thickness h(=x4).

Welded beam design problem considered in example 2
The problem description can be stated as follows:
Where,
For the RDO formulation of the problem, each of the random variables have been assumed to be normally distributed with 5% coefficient of variation. The RDO problem may be stated as,
where, \( {\boldsymbol{\mu}}_{\mathbf{x}}^{\ast } \) denotes the mean of the design variables at optimum f(x).
The number of training points utilized for the surrogate models and MCS have been presented in Table 6. The corresponding robust optimal solutions obtained have been reported in Table 7.
The optimized design variables and objective function values obtained have been presented in Table 7. The total number of training points employed for all the surrogate models and MCS are 128 and 105, respectively. Remarkable similar results have been observed on comparing the performance of H-PCFE with that of MCS. Analytical H-PCFE has also yielded good results, considering the fact that it involves significantly reduced level of computations within each optimization iteration. It is clear from the above results that the proposed approaches have convincingly outperformed standard models, such as, Kriging, RBF and multi adaptive regression splines (MARS) in terms of approximation accuracy. It is worth noting that H-PCFE, an enhanced version of Kriging, yields significantly accurate results than that of a primitive version of the latter (Universal Kriging in this case).
After illustrating the superior approximation accuracy of H-PCFE in comparison to few available standard surrogate models, in case of the above two non-linear analytical examples, it has been employed to solve two practical engineering problems considering parametric randomness. They deal with weight minimization of a 10-element plane truss and a 25-element space truss subjected to displacement and stress constraints. Since these stochastic problems involve FE modelling, a single actual response evaluation may take considerable amount of time. Hence, the analytical version of H-PCFE (Section 4) has been employed to solve these problems.
5.3 Example 3: 10-bar plane truss
The 10-bar plane truss structure as illustrated in Fig. 5 has been previously attempted in (Luh and Chueh 2004; Chatterjee and Chowdhury 2016). The structure has been modelled in FE package ANSYS Mechanical 15.0 (2013). The objective is to minimize the structural weight (W) by considering displacement and stress constraints.
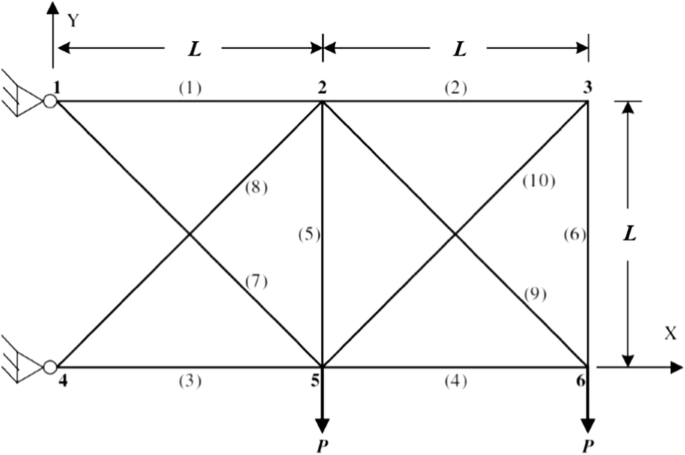
10-bar plane truss considered in example 3
In Fig. 5, L is taken to be 914.4 cm. The cross-sectional areas A and the elastic modulus E of all the ten members have been considered to be random. Consequently, total number of random variables are twenty. The elastic modulus of all the ten elements of the truss have been considered to be uniformly distributed ranging from 65,502.5 MPa to 72,397.5 MPa. The member cross-sectional areas are considered to be normally distributed with 5% coefficient of variation. Mean of the cross-sectional areas are considered to be the design variables. The material density and Poisson’s ratio are taken as ρ = 2768 kg/m3 and μ = 0.3. The maximum allowable nodal displacement dmax and member stress σmax are considered to be 3.81 cm and 172.375 MPa, respectively. There are eleven constraints which are, (i) maximum nodal displacement d should not exceed dmax, and (ii) maximum stress in each member σm should not exceed σmax.The problem can be stated as:
Where, x = [E, A], \( {\boldsymbol{\mu}}_{\mathbf{A}}^{\ast } \) denotes the mean of the design variables at optimum f(x), std. denotes standard deviation and α is the weighing factor illustrated in (3). It should be clear from (87) that the statistical response terms involved in constraint functions have been explicitly determined by utilizing analytical H-PCFE with the help of (29) and (34).
The number of sample points required for training H-PCFE is 1000. MCS has been performed for 10,000 simulations for every function call within the optimization cycle. The results as illustrated in Table 8, demonstrates excellent similar response statistics as obtained by analytical H-PCFE with that of MCS. MCS based RDO require 20 iterations to converge. Thus, the total number of function evaluations required by MCS to yield the optimal solutions are 2,00,000 (= 20 × 10,000). On the contrary, analytical H-PCFE requires 20 iterations for convergence and thus, the total number of function evaluations involved are 20,000 (= 20 × 1000). Specifically, the computational effort required by analytical H-PCFE is 10% (= 20,000/2,00,000 × 100) of that required by MCS to yield highly accurate results.
5.4 Example 4: 25-bar space truss
In this section, the performance of the proposed approach in RDO formulation of a twenty five bar space truss (Patelli et al. 2014) has been illustrated. The truss along with the position of the loads has been depicted in Fig. 6. The structure has been modelled in FE package ANSYS Mechanical 15.0 (2013). The objective is to minimize the structural weight (W) by considering stress constraints. In Fig. 6(a), L has been assumed as 63.5 cm. The elastic modulus of all the twenty five elements of the space truss have been considered to be 6.895 × 10⁴ MPa. The cross-sectional areas of the twenty five truss elementsAi, i = 1 − 25, which are assumed to be normally distributed with 5% variation. Mean of the cross-sectional areas are considered to be the design variables. The values of loads P1, P2, P3, P4, P5 and P6 as shown in Fig. 6(b) are assumed to be 44,500, 44,500, 44,500, 44,500, 2225, and 2670 (in N). The material density and Poisson’s ratio are taken as ρ = 2768 kg/m3 and μ = 0.3. The maximum allowable member stress σmax is considered to be 103.425 MPa. There are twenty five constraints such that the maximum stress in each member σm should not exceed σmax. The problem statement can be stated as:
Where, \( {\boldsymbol{\mu}}_{\mathbf{x}}^{\ast } \) denotes the mean of the design variables at optimum f(x), std. denotes standard deviation. It should be clear from (88) that the statistical response terms involved in constraint functions have been explicitly determined by utilizing analytical H-PCFE with the help of (29) and (34).

25-bar space truss (a) node and element numbers (b) loading details
The number of training points required for approximating σm by utilizing analytical H-PCFE is 1000. The results obtained have been presented in Table 9 below which illustrates analytical H-PCFE has achieved accurate solutions in terms of close proximity to MCS based RDO. MCS based RDO requires 46 iterations to converge. MCS has been performed for 10,000 simulations for every function call within the optimization cycle. Thus, the total number of function evaluations required by MCS to yield the optimal solutions are 4,60,000 (= 46 × 10,000). On the contrary, analytical H-PCFE requires 45 iterations for convergence and thus, the total number of function evaluations involved are 45,000 (= 45 × 1000). Specifically, the computational effort required by analytical H-PCFE is 9.8% (= 45,000/4,60,000 × 100) of that required by MCS to yield strikingly similar results.
∗W denotes weight of the truss (in N) and std. denotes standard deviation.
As the scale and dimensionality of the stochastic problem increases, it is quite obvious to expect that analytical H-PCFE will yield solutions at a faster rate as compared to H-PCFE. Thus, the study proposes an accurate and efficient analytical surrogate assisted RDO framework, likely to be potential for further large scale and complex applications.
6 Conclusions
A novel approximation technique has been incorporated within the traditional RDO formulation for addressing the prohibitive computational issues. It serves as a bi-level approximation, first on a global scale using a set of polynomials and then on a local scale by accounting for local functional variations. The polynomials addresses the accuracy and the local interpolation improves efficiency, especially in regions of high local undulations. Moreover, in order to reduce significant level of computations, analytical expressions for statistical moments of response quantities have been proposed by using H-PCFE. This analytical framework has been incorporated within RDO routine, in which further computational efficiency has been achieved as no simulations are required to approximate the statistical quantities within each optimization iteration.
Comparison of the results obtained by using H-PCFE and MCS in two benchmark examples and two practical problems carried out demonstrate good agreement. Also, the proposed approaches have outperformed popular surrogate models in terms of accuracy in yielding the actual optima. It is worth mentioning that analytical H-PCFE has achieved decent level of accuracy by utilizing significantly less computational effort in comparison to H-PCFE and other surrogate models. Thus, it is recommended to be utilized for large-scale computational expensive problems.
The highlights of the proposed approaches have been summarized as follows:
-
Since homotopy algorithm is utilized for determining the unknown coefficients, L2 error norm is minimized as well as the orthogonality of the component functions is ensured. As a result, H-PCFE is convergent in mean-square and optimal in Fourier sense.
-
H-PCFE is flexible enough to be applied with any other available sampling schemes.
-
In terms of accuracy, excellent performance by H-PCFE has been observed. The proposed bi-level approximation renders robustness and capability to approximate the global and local functional behaviour effectively.
-
The analytical formulae of the first two statistical moments derived for H-PCFE allows the response statistics to be obtained without the need for further simulation, thus, saving significant level of computations.
References
Alexandrov N, Lewis R (2002) Analytical and computational aspects of collaborative optimization for multidisciplinary design. AIAA 40(2):301–309
ANSYS Mechanical User’s Guide (2013) Release 15.0, ANSYS, Inc., PA
Beyer H-G, Sendhoff B (2007) Robust optimization – a comprehensive survey. Comput Methods Appl Mech Eng 196:3190–3218
Biswas S, Chakraborty S, Chowdhury R, Ghosh I (2016) Hydro-electric flow optimization of a dam: A Kriging based approach. In: Structural Engineering Convntion. Springer, Chennai
Biswas S, Chakraborty S, Chandra S, Ghosh I (2017) Kriging-based approach for estimation of vehicular speed and passenger Car units on an urban arterial. J Transp Eng Part A Syst 143:4016013
Bucher CG, Bourgund U (1990) A fast and efficient response surface approach for structural reliability problems. Struct Saf 7:57–66. https://doi.org/10.1016/0167-4730(90)90012-E
Chakraborty S, Chowdhury R (2015) Multivariate function approximations using the D-MORPH algorithm. Appl Math Model 39:7155–7180
Chakraborty S, Chowdhury R (2016a) Moment independent sensitivity analysis: H-PCFE–based approach. J Comput Civ Eng 31:06016001:1–06016001:11. https://doi.org/10.1061/(ASCE)CP.1943-5487.0000608
Chakraborty S, Chowdhury R (2016b) Sequential experimental design based generalised ANOVA. J Comput Phys 317:15–32
Chakraborty S, Chowdhury R (2016c) Modelling uncertainty in incompressible flow simulation using Galerkin based generalised ANOVA. Comput Phys Commun 208:73–91
Chakraborty S, Chowdhury R (2017a) A hybrid approach for global sensitivity analysis. Reliab Eng Syst Saf 159:50–57. https://doi.org/10.1016/j.ress.2016.10.013
Chakraborty S, Chowdhury R (2017b) Towards “h-p adaptive” generalized ANOVA. Comput Methods Appl Mech Eng 320:558–581
Chakraborty S, Chowdhury R (2017c) Hybrid framework for the estimation of rare failure event probability. J Eng Mech. https://doi.org/10.1061/(ASCE)EM.1943-7889.0001223
Chakraborty S, Chowdhury R (2017d) An efficient algorithm for building locally refined hp – adaptive H-PCFE: application to uncertainty quantification. J Comput Phys 351:59–79
Chatterjee T, Chowdhury R (2016) Adaptive Bilevel Approximation Technique for Multiobjective Evolutionary Optimization. J Comput Civ Eng 04016071(1-16). doi: https://doi.org/10.1061/(ASCE)CP.1943-5487.0000643
Chatterjee T, Chowdhury R (2017) An efficient sparse Bayesian learning framework for stochastic response analysis. Struct Saf 68:1–14
Chatterjee T, Chakraborty S, Chowdhury R (2016) A bi-level approximation tool for the computation of FRFs in stochastic dynamic systems. Mech Syst Signal Process 70–71:484–505
Chatterjee T, Chakraborty S, Chowdhury R (2017) A critical review of surrogate assisted robust design optimization. Arch Comput Methods Eng. https://doi.org/10.1007/s11831-017-9240-5
Chen W, Wiecek M, Zhang J (1991) Quality utility — a compromise programming approach to robust design. J Mech Des ASME 121:179–187
Chen W, Allen J, Tsui K, Mistree F (1996) Procedure for robust design: minimizing variations caused by noise factors and control factors. J Mech Des Trans ASME 118:478–485
Chen W, Sahai A, Messac A, Sundararaj G (2000) Exploration of the effectiveness of physical programming in robust design. J Mech Des ASME 122:155–163
Cheng J, Liu Z, Wu Z et al (2014) Robust optimization of structural dynamic characteristics based on adaptive kriging model and CNSGA. Struct Multidiscip Optim 51:423–437
Chowdhury R, Rao BN (2009) Hybrid high dimensional model representation for reliability analysis. Comput Methods Appl Mech Eng 198:753–765. https://doi.org/10.1016/j.cma.2008.10.006
Dai H, Zhang H, Wang W (2015) A multiwavelet neural network-based response surface method for structural reliability analysis. Comput Civ Infrastruct Eng 30:151–162
Deb K (2001) Multi-objective optimization using evolutionary algorithms. Wiley, Chichester
Deb K, Agarwal A, Meyarivan T (2002) A fast and elitist multiobjective genetic algorithm: NSGA-II. IEEE Trans Evol Comput 6:182–197
Deng J (2006) Structural reliability analysis for implicit performance function using radial basis function network. Int J Solids Struct 43:3255–3291
Diez M, Peri D (2010) Robust optimization for ship conceptual design. Ocean Eng 37:966–977
Doltsinis I, Kang Z (2004) Robust design of structures using optimization methods. Comput Methods Appl Mech Eng 193:2221–2237. https://doi.org/10.1016/j.cma.2003.12.055
Du X, Chen W (2000) Towards a better understanding of modeling feasibility robustness in engineering design. J Mech Des Trans ASME 122:385–394
Du X, Sudjianto A, Chen W (2004) An integrated framework for optimization under uncertainty using inverse reliability strategy. J Mech Des 126:562–570
Dubourg V (2011) Adaptive surrogate models for reliability analysis and reliability-based design optimization. Universite Blaise Pascal, Clermont-Ferrand, France
Echard B, Gayton N, Lemaire M (2011) AK-MCS: an active learning reliability method combining kriging and Monte Carlo simulation. Struct Saf 33:145–154. https://doi.org/10.1016/j.strusafe.2011.01.002
Eggert R, Mayne R (1993) Probabilistic optimal-design using successive surrogate probability density functions. J Mech Des Trans ASME 115:385–391
Fang J, Gao Y, Sun G, Li Q (2013) Multiobjective reliability-based optimization for design of a vehicle door. Finite Elem Anal Des 67:13–21
Fang J, Gao Y, Sun G et al (2015) Multiobjective robust design optimization of fatigue life for a truck cab. Reliab Eng Syst Saf 135:1–8
Fonseca C, Fleming P (1995) Multiobjective genetic algorithms made easy: selection, sharing, and mating restriction. In: Proceedings of the 1st International Conference on Genetic Algorithms in Engineering Systems: Innovations and Applications. IET, pp 45–52
Giunta A, Watson L, Koehler J (1998) A comparison of approximation modeling techniques: polynomial versus interpolating models. In: Proceedings of the seventh AIAA/USAF/NASA/ISSMO symposium on multidisciplinary analysis and optimization, AIAA-98-4758. pp 1–13
Goswami S, Ghosh S, Chakraborty S (2016) Reliability analysis of structures by iterative improved response surface method. Struct Saf 60:56–66
Gupta K, Li J (2000) Robust design optimization with mathematical programming neural networks. Comput Struct 76:507–516
Hart CG, Vlahopoulos N (2009) An integrated multidisciplinary particle swarm optimization approach to conceptual ship design. Struct Multidiscip Optim 41:481–494
Hicks R., Henne PA (1978) Wing design by numerical optimization
Huang B, Du X (2007) Analytical robustness assessment for robust design. Struct Multidiscip Optim 34:123–137
Hwang K, Lee K, Park G (2001) Robust optimization of an automobile rearview mirror for vibration reduction. Struct Multidiscip Optim 21:300–308
Jacquelin E, Adhikari S, Sinou J, Friswell M (2015) Polynomial chaos expansion and steady-state response of a class of random dynamical systems. J Eng Mech 141:4014145
Jin R, Chen W, Simpson T (2001) Comparative studies of metamodeling techniques under multiple modeling criteria. Struct Multidiscip Optim 23:1–13. https://doi.org/10.2514/6.2000-4801
Kang S-C, Koh H-M, Choo JF (2010) An efficient response surface method using moving least squares approximation for structural reliability analysis. Probabilistic Eng Mech 25:365–371. https://doi.org/10.1016/j.probengmech.2010.04.002
Kaymaz I (2005) Application of kriging method to structural reliability problems. Struct Saf 27:133–151
Kim S-H, Na S-W (1997) Response surface method using vector projected sampling points. Struct Saf 19:3–19
Lagaros ND, Plevris V, Papadrakakis M (2007) Reliability based robust design optimization of steel structures. Int J Simul Multidiscip Des Optim 1:19–29
Lee T, Jung J (2006) Metamodel-based shape optimization of connecting rod considering fatigue life. Key Eng Mater 211:306–308
Lee SH, Chen W, Kwak BM (2009) Robust design with arbitrary distributions using gauss-type quadrature formula. Struct Multidiscip Optim 39:227–243
Li G, Rabitz H (2010) D-MORPH regression: application to modeling with unknown parameters more than observation data. J Math Chem 48:1010–1035
Li F, Meng G, Sha L, Zhou L (2011) Robust optimization design for fatigue life. Finite Elem Anal Des 47:1186–1190
Liu J, Vitelli V, Zio E, Seraoui R (2015) A novel dynamic-weighted probabilistic support vector regression-based ensemble for prognostics of time series fata. IEEE Trans Reliab 64:1203–1213
Lucas J (1994) How to achieve a robust process using response surface methodology. J Qual Technol 26:248–260
Luh G, Chueh C (2004) Multi-objective optimal design of truss structure with immune algorithm. Comput Struct 82:829–844
Majumder D, Chakraborty S, Chowdhury R (2017) Probabilistic analysis of tunnels: a hybrid polynomial correlated function expansion based approach. Tunn Undergr Sp Technol 70:89–104
Marano GC, Greco R, Sgobba S (2010) A comparison between different robust optimum design approaches: application to tuned mass dampers. Probabilistic Eng Mech 25:108–118. https://doi.org/10.1016/j.probengmech.2009.08.004
Marrel A, Iooss B, Van Dorpe F, Volkova E (2008) An efficient methodology for modelling complex computer codes with Gaussian processes. Comput Stat Data Anal 52:4731–4744
McDonald M, Heller M (2004) Robust shape optimization of notches for fatigue-life extension. Struct Multidiscip Optim 28:55–68
McKay MD, Beckman RJ, Conover WJ (1979) A comparison of three methods for selecting values of input variables in the analysis of output from a computer code. Technometrics 21:239–245
Messac A (1996) Physical programming: effective optimization for computational design. AIAA J 34:149–158
Mukhopadhyay T, Chakraborty S, Dey S et al (2016) A critical assessment of kriging model variants for high-Fidelity uncertainty quantification in dynamics of composite shells. Arch Comput Methods Eng. https://doi.org/10.1007/s11831-016-9178-z
Mukhopadhyay T, Chakraborty S, Dey S et al (2017) A critical assessment of kriging model variants for high-Fidelity uncertainty quantification in dynamics of composite shells. Arch Comput Methods Eng 24:495–518. https://doi.org/10.1007/s11831-016-9178-z
Myers R, Khuri A, Vining G (1992) Response surface alternative to the Taguchi robust parameter design approach. Am Stat 46:131–139
Park G, Lee T, Kwon H, Hwang K (2006) Robust design: an overview. AIAA J 44:181–191
Parsons, M. G., & Scott, R. L. (2004). Formulation of multicriterion design optimization problems for solution with scalar numerical optimization methods. Journal of Ship Research, 48(1), 61–76
Patelli E, Broggi M, de Angelis M, Beer M (2014) OpenCossan: an efficient open tool for dealing with epistemic and aleatory uncertainties. Vulnerability, Uncertainty, and Risk, American Society of Civil Engineers, Reston, pp 2564–2573
Phadke M (1989) Quality engineering using robust design. Englewood Cliffs, Prentice Hall
Ramakrishnan B, Rao S (1996) A general loss function based optimization procedure for robust design. Eng Optim 25:255–276
Rao BN, Chowdhury R (2009) Enhanced high dimensional model representation for reliability analysis. Int J Numer Methods Eng 77:719–750
Rao CR, Mitra SK (1971) Generalized inverse of a matrix and its applications. In: Proceedings of the Sixth Berkeley Symposium on Mathematical Statistics and Probability
Roy BK, Chakraborty S (2015) Robust optimum design of base isolation system in seismic vibration control of structures under random system parameters. Struct Saf 55:49–59
Roy BK, Chakraborty S, Misra S (2014) Robust optimum design of base isolation system in seismic vibration control of structures under uncertain bounded system parameters. J Vib Control 20:786–800
Sacks J, Welch W, Mitchell T, Wynn H (1989) Design and analysis of computer experiments. Stat Sci 4:409–423
Schuëller GI, Jensen HA (2008) Computational methods in optimization considering uncertainties – an overview. Comput Methods Appl Mech Eng 198:2–13
Sen P, Yang J (1998) Multiple criteria decision support in engineering design. Springer, London
Shu S, Gong W (2016) An artificial neural network-based response surface method for reliability analyses of c-φ slopes with spatially variable soil. China. Ocean Eng 30:113–122
Sierra MR, Coello CAC (2005) Improving PSO-Based Multi-objective Optimization Using Crowding, Mutation and ∈−Dominance. In: Evolutionary Multi-Criterion Optimization Volume 3410 of the series Lecture Notes in Computer Science. Springer Berlin Heidelberg, pp 505–519
Sobieszczanski-Sobieski, J., & Haftka, R. T. (1997). Multidisciplinary aerospace design optimization: survey of recent developments. Structural optimization, 14(1), 1–23
Srinivas N, Deb K (1994) Multiobjective optimization using nondominated sorting in genetic algorithms. Evol Comput 2:221–248
Sudret B (2012) Meta-models for structural reliability and uncertainty quantification. In: Proceedings of 5th Asian-Pacific Symposium on Stuctural Reliabilty and its Applications (APSSRA, 2012), Singapore. pp 53–76
Sun G, Li G, Zhou S et al (2011) Crashworthiness design of vehicle by using multiobjective robust optimization. Struct Multidiscip Optim 44:99–110
Taguchi G (1986) Quality engineering through design optimization. Krauss International Publications, White Plains
Taguchi G (1987) System of experimental design: Engineering methods to optimize quality and minimize costs, Vol. 1. UNIPUB/Kraus International Publications
Volpi S, Diez M, Gaul NJ et al (2015) Development and validation of a dynamic metamodel based on stochastic radial basis functions and uncertainty quantification. Struct Multidiscip Optim 51:347–368
Zang C, Friswell MI, Mottershead JE (2005) A review of robust optimal design and its application in dynamics. Comput Struct 83:315–326
Zhang Q, Li H (2007) MOEA/D: a multiobjective evolutionary algorithm based on decomposition. IEEE Trans Evol Comput 11:712–731
Zhao L, Choi K, Lee I (2010) A Metamodeling Method Using Dynamic Kriging and Sequential Sampling. In: 13th AIAA/ISSMO Multidisciplinary Analysis Optimization Conference. Fort Worth, Texas
Zitzler E (1999) Evolutionary Algorithms for Multiobjective Optimization: Methods and Applications. Computer Engineering and Networks Laboratory, Swiss Federal Institute of Technology (ETH) Zurich
Zitzler E, Laumanns M, Thiele L (2001) SPEA2: Improving the strength pareto evolutionary algorithm. Tech. Rep. 103, Computer Engineering and Networks Laboratory (TIK), Department of Electrical Engineering, Swiss Federal Institute of Technology (ETH) Zurich
Acknowledgements
Tanmoy Chatterjee and Rajib Chowdhury acknowledge the support of CSIR via Grant No. 22(0712)/16/EMR-II.
Author information
Authors and Affiliations
Corresponding author
Additional information
Responsible Editor: Shapour Azarm
Appendices
Additional results of the numerical examples based on convergence study
1.1 Convergence of the surrogate models based on LOOCV error with increase in number of training points
For all the four examples carried out, convergence of the surrogate models based on LOOCV error have been presented below in Figs. 7, 8, 9, and 10. For determining the LOOCV error in this study, the following expression has been utilized, \( \mathrm{LOOCV}\kern0.17em \mathrm{error}=\left|\widehat{y}-y\right|/y \), where, y and \( \widehat{y} \) are the actual and approximate response functions, respectively.

Convergence of the LOOCV error in approximating the objective function (UTC) in example 1 with increase in training points by utilizing the surrogate models

Convergence of the LOOCV error in approximating the (a) objective function f (b) constraint g1(c) constraint g2(d) constraint g4(e) constraint g5in example 2 with increase in training points by utilizing the surrogate models

Convergence of the LOOCV error in approximating the maximum nodal displacement d and maximum stress in each member σ1 − 10in example 3 with increase in training points by utilizing H-PCFE

Convergence of the LOOCV error in approximating the maximum member stress in example 4 with increase in training points by utilizing H-PCFE
1.1.1 Example 1: Conceptual design of a bulk carrier
1.1.2 Example 2: Welded beam design
1.1.3 Example 3: 10-bar plane truss
1.1.4 Example 4: 25-bar space truss
1.2 Convergence of the response statistics with increase in number of MCS
The convergence study for determining the optimum number of MCS for all the four examples have been presented below in Figs. 11, 12, 13, and 14.

Convergence of (a) mean of UTC (b) SD of UTC and their 95% confidence interval (CI) with increasing number of MCS


Convergence of (a) mean of f (b) SD of f (c) mean of g1 (d) SD of g1 (e) mean of g2 (f) SD of g2 (g) mean of g4 (h) SD of g4 (i) mean of g5 (j) SD of g5 and their 95% confidence interval (CI) with increasing number of MCS


Convergence of (a) mean of d (b) SD of d (c) mean of σ1 (d) SD of σ1 (e) mean of σ2 (f) SD of σ2 (g) mean of σ3 (h) SD of σ3 (i) mean of σ4 (j) SD of σ4 (k) mean of σ5 (l) SD of σ5 (m) mean of σ6 (n) SD of σ6 (o) mean of σ7 (p) SD of σ7 (q) mean of σ8 (r) SD of σ8(s) mean of σ9 (t) SD of σ9 (u) mean of σ10 (v) SD of σ10 and their 95% confidence interval (CI) with increasing number of MCS

Convergence of (a) mean of maximum stress (b) SD of maximum stress and their 95% confidence interval (CI) with increasing number of MCS
1.2.1 Example 1: Conceptual design of a bulk carrier
1.2.2 Example 2: Welded beam design
1.2.3 Example 3: 10-bar plane truss
1.2.4 Example 4: 25-bar space truss
Transformation to non-uniform variablesEquation Section (Next)
1.1 Uniform to Gaussian variable
Where x is uniformly distributed in [0, 1] and z is a normal variable with mean μ and standard deviation σ.
1.2 Uniform to lognormal distribution
Where x is uniformly distributed in [0, 1] and z is a lognormal variable with parameters μ and σ
1.3 Uniform to Gumbell distribution
Where x is uniformly distributed in [0, 1] and z follows Gumbell distribution with parameters a and b.
1.4 Uniform to Rayleigh distribution
Where x is uniformly distributed in [0, 1] and z follows Rayleigh distribution with parameters a and b.
Rights and permissions
About this article

Cite this article
Chatterjee, T., Chakraborty, S. & Chowdhury, R. Analytical moment based approximation for robust design optimization. Struct Multidisc Optim 58, 2135–2162 (2018). https://doi.org/10.1007/s00158-018-2029-9
Received:
Revised:
Accepted:
Published:
Issue Date:
DOI: https://doi.org/10.1007/s00158-018-2029-9