
Abstract
Infectious or non-infectious peritonitis leads to systemic inflammation due to violation of the peritoneum which is often fatal. Fisetin, a flavonol compound, exhibits a broad spectrum of biological activities including antioxidant, anti-inflammatory, anticancer, and neuroprotective effects was used in a murine model of thioglycollate-induced aseptic peritonitis to investigate in, and on RAW macrophage cells. In this study, peritonitis was induced in C57BL/6J mice using thioglycollate, and anti-inflammatory effects of fisetin, was assessed prophylactically. In in vitro study, cells treated with inflammatory agents such as LPS and PMA lose their viability and proliferative capacity. Fisetin has been shown to prevent the loss of viability when given prophylactically. In in vivo model, total cell recruitment was found to increase with TG, showing that it has induced inflammation and interestingly cell recruitment was successfully inhibited by fisetin. The differential count of peripheral blood, treated only with TG, shows an increase in the polymorphonuclear (PMN) cell count, as compared to control. On treatment with fisetin, PMN number decreases. Concentration of nitric oxide (NO) in intestine has increased by 1.90-fold after 3 h (p < 0.05) and 1.24-fold after 24 h (p < 0.05), after treatment with TG as compared to control. NO concentration has decreased by 1.28-fold after 3 h (p < 0.05) and 2.15-fold after 24 h (p < 0.05) with fisetin treatment, compared to only TG. Concentration of ascorbic acid in peritoneal fluid has increased by 1.06-fold after 3 h, 1.02-fold after 9 h, and 1.05-fold after 24 h, on treatment with only TG, as compared to control. The ASA concentration increases significantly (p < 0.05) after treatment with fisetin, compared to only TG, after 3 h (1.38-fold), 9 h (1.44-fold), and 24 h (2.19-fold). In conclusion, we found that fisetin had a positive prophylactic effect against peritonitis in mice.
Prophylactic use of fisetin in thioglycollate-induced peritonitis in mice.
The original research work included in this chapter has been communicated to BMC Immunology (under revision 8-6-2015).
Access provided by Autonomous University of Puebla. Download chapter PDF
Keywords
These keywords were added by machine and not by the authors. This process is experimental and the keywords may be updated as the learning algorithm improves.
1 Summary of the Original Research
Infectious or non-infectious peritonitis leads to systemic inflammation due to violation of the peritoneum which is often fatal. Fisetin, a flavonol compound, exhibits a broad spectrum of biological activities including antioxidant, anti-inflammatory, anticancer, and neuroprotective effects was used in a murine model of thioglycollate-induced aseptic peritonitis to investigate in, and on RAW macrophage cells. In this study, peritonitis was induced in C57BL/6J mice using thioglycollate, and anti-inflammatory effects of fisetin, was assessed prophylactically. In in vitro study, cells treated with inflammatory agents such as LPS and PMA lose their viability and proliferative capacity. Fisetin has been shown to prevent the loss of viability when given prophylactically. In in vivo model, total cell recruitment was found to increase with TG, showing that it has induced inflammation and interestingly cell recruitment was successfully inhibited by fisetin. The differential count of peripheral blood, treated only with TG, shows an increase in the polymorphonuclear (PMN) cell count, as compared to control. On treatment with fisetin, PMN number decreases. Concentration of nitric oxide (NO) in intestine has increased by 1.90-fold after 3 h (p < 0.05) and 1.24-fold after 24 h (p < 0.05), after treatment with TG as compared to control. NO concentration has decreased by 1.28-fold after 3 h (p < 0.05) and 2.15-fold after 24 h (p < 0.05) with fisetin treatment, compared to only TG. Concentration of ascorbic acid in peritoneal fluid has increased by 1.06-fold after 3 h, 1.02-fold after 9 h, and 1.05-fold after 24 h, on treatment with only TG, as compared to control. The ASA concentration increases significantly (p < 0.05) after treatment with fisetin, compared to only TG, after 3 h (1.38-fold), 9 h (1.44-fold), and 24 h (2.19-fold). In conclusion, we found that fisetin had a positive prophylactic effect against peritonitis in mice.
2 Introduction
Peritonitis is the inflammation of the peritoneum, which is the thin tissue that lines the inner wall of the abdomen, and covers most of the abdominal organs. Infected peritonitis is caused by perforation of part of the GI tract, by disruption of the peritoneum or by systemic infections. Non-infected peritonitis may be caused by leakage of sterile body fluids into the peritoneum, or by sterile abdominal surgery, which may inadvertently leave behind foreign bodies. Primary or spontaneous bacterial peritonitis (SBP) typically occurs when a bacterial infection spreads to the peritoneum across the gut wall or mesenteric lymphatics. Peritonitis is a common postoperative complication that can develop into lethal sepsis in case of delayed diagnosis or inappropriate treatment [1, 2]. The pathophysiology of peritonitis is complicated and is involved in various processes, of which the most important one is the inflammatory reaction [3]. Inflammation leads to increased production of reactive species such as reactive oxygen species (ROS), nitric oxide synthase (NOS), and their product peroxynitrite by activated macrophages. This increase in oxidative stress leads to decrease in effectiveness of oxidant defenses, that is, reduction in antioxidants. Local intra-abdominal focus of inflammation caused by the microorganisms can promote the synthesis and secretion of massive inflammatory cytokines, which would destroy the endothelial junctions and provide access for bacteria into the systemic circulation leading to lethal bacteremia [4–6]. During the pathological process of the peritonitis, NF-κB plays an activating role in the inflammatory reaction [6]. Acute peritonitis is one of the most headachy postoperative complications, which is an important cause of death in surgical practice and intensive care units (ICUs) [7]. Acute peritonitis differs from other infections because of the broad variety of causes, severity of the infection, polymicrobial pathogenesis, and complex pathological process [8].
Perforation of part of the gastrointestinal tract is the most common cause of peritonitis. Disruption of the peritoneum, even in the absence of perforation of a hollow viscous, may also cause infection simply by letting microorganisms into the peritoneal cavity. Examples include trauma, surgical wound, continuous ambulatory peritoneal dialysis, and intraperitoneal chemotherapy. Again, in most of the cases, mixed bacteria are isolated; the most common agents include cutaneous species such as Staphylococcus aureus, and coagulase-negative staphylococci, but many others are possible, including fungi such as Candida [9]. Women can experience localized peritonitis from an infected fallopian tube or a ruptured ovarian cyst. Patients may present with an acute onset of symptoms, limited and mild disease, or systemic and severe disease with septic shock. It has been proven that delayed diagnosis of peritonitis was an important factor for its high mortality [10].
Peritoneal infections are classified as primary (i.e., from hematogenous dissemination, usually in the setting of an immunocompromised state), secondary (i.e., related to a pathologic process in a visceral organ, such as perforation or trauma), or tertiary (i.e., persistent or recurrent infection after adequate initial therapy). Primary peritonitis is most often SBP seen mostly in patients with chronic liver disease. Secondary peritonitis is by far the most common form of peritonitis encountered in clinical practice. Tertiary peritonitis (TP) often develops in the absence of the original visceral organ pathology [9, 11–17]. Infections of the peritoneum are further divided into generalized (peritonitis) and localized (intra-abdominal abscess). The diagnosis of peritonitis is usually clinical. Diagnostic peritoneal lavage may be helpful in patients who do not have conclusive signs on physical examination or who cannot provide an adequate history [11]. An optimal treatment strategy against peritonitis has not yet established. In many cases, the surgical and antimicrobial treatment fails in this disease.
The animal model is one of the most important methods in the scientific research. Thioglycollate broth is a multipurpose, enriched differential medium used primarily to determine the oxygen requirements of microorganisms. Sodium thioglycolate in the medium consumes oxygen and permits the growth of obligate anaerobes. The thioglycollate-induced peritonitis in mice is used as a model to study for potential anti-inflammatory action of investigated test compounds [18].
Flavonoids, the most common group of polyphenolic compounds in the human diet, are abundant in fruits and vegetables. Fisetin is a bioactive polyphenolic flavonoid, commonly found in many fruits and vegetables such as strawberries, apples, persimmons, onions, and cucumbers. It has been shown to posses both direct intrinsic antioxidant as well as indirect antioxidant effects [19, 20]. Fisetin exerts multiple beneficial pharmacological activities such as anti-inflammatory, anticancer and in rheumatoid arthritis [21–25]. Recently, there has been an increasing interest in fisetin because of its antiproliferative and apoptotic activities [26, 27]. It was also considered to possess neuroprotective effects against the aging process, cerebral damage, and neurodegenerative disorders [28]. In addition, several studies show that fisetin protects against several types of cancer, including prostate, cervical, colorectal, breast, bladder, and lung cancer [29, 30]. The aim of this study was to investigate the prophylactic effect of fisetin in thioglycollate-induced peritonitis in mice.
3 Materials and Methods
Reagents: LPS (cell wall lipopolysaccharide from Escherichia coli 0111:B4) was bought from Sigma Aldrich, USA. PMA (phorbol 12-myristate 13-acetate) was obtained from Calbiochem, USA. MTT was obtained from Spectrochem Pvt. Ltd., Mumbai, India. Sodium thioglycollate, fetal bovine serum (FBS), and RBC lysis buffer were bought from Himedia, India. Dimethyl sulfoxide (DMSO), EDTA, methanol, l-ascorbic acid (L-ASA), dinitrophenyl hydrazine (DNPH), thiourea, sulfanilamide, and NED were bought from Sisco Research Laboratory (SRL), India. Dulbecco’s modified Eagle medium (DMEM) from Gibco was used. potassium dichromate, ortho-phosphoric acid, and NaNO2 were purchased from Merck, India. Sulfuric acid was bought from Finar Chemicals Limited, India, and 6 % H2O2 was bought from B.D. Pharmaceutical Works Pvt. Ltd., India. 1X phosphate-buffered saline (PBS) was prepared using 137 mM NaCl (Merck, India), 2.7 mM KCl (Himedia, India), 10 mM Na2HPO4 (Qualigens, India), and 2 mM KH2PO4 (Himedia, India).
96-well plates were obtained from Nest Biotech Co. Ltd., China. Dispovan syringes were used to obtain blood and peritoneal fluid.
Cells were incubated in a CO2 incubator (Thermo Fisher), and cells were observed using Floid Cell Imaging Station (Life Technologies, India).
Smears for cell counting were prepared using cytospin (Centurion Scientific C2 series) after centrifuging the sample in a cold centrifuge (Vision VS-15000CFN). Smears were observed under a light microscope (Debro DX-200). Absorbance readings were taken in a multiplate reader (Thermo Fisher Multiskan EX). Plates were incubated in a CO2 incubator (Thermo Fisher).
All cell culture work was done inside the biosafety cabinet (Vision Scientific, Korea).
In vitro cell proliferation studies: RAW macrophages were cultured, treated with inflammatory agents (LPS and PMA) and the effect of fisetin on cell viability was assessed using MTT test. Viable, proliferating cells produce NAD(P)H-dependent oxidoreductases, which can reduce the tetrazolium dye MTT [3-(4,5-dimethyl thiazol-2-yl)-2,5-diphenyl tetrazolium bromide], to its insoluble formazan (purple). These insoluble crystals are dissolved in DMSO, and absorbance is measured at 570 nm. 5 × 10⁴ RAW 264.7 cells were seeded into the wells of a 96-well plate and after 24 h, were treated with various concentrations of fisetin (10, 20, 30, 40, and 50 µM), followed by 1 µg/ml LPS (bacterial cell wall lipopolysaccharide) for one group and 50 ng/ml PMA (phorbol 12-myristate 13-acetate) for another, and incubated for 24 h. Then, the cells were incubated with 5 mg/ml MTT working solution for 3 h at 37 °C followed by treatment with 100 μl DMSO to dissolve the formazan crystals. Absorbance was measured in a microplate reader (Shimazdu) at 570 nm. Cell viability for cells without treatment (control) was taken to be 100 %, and the cell viability of the experimental groups calculated accordingly.
In vitro assay for cellular uptake of fisetin: RAW 264.7 cells have been treated with different concentrations of fisetin (10, 25 and 50 µM), followed by 1 µg/ml LPS, and observed under the microscope (Floid Cell Imaging Station). The change in uptake of fisetin by the cells was noted.
Animals: C57BL/6 J mice were used. All experiments were performed according to rules laid down by the institutional and departmental animal ethics committee and the animals housed under specific pathogen-free conditions at the animal housing vivarium of the Department of Zoology, University of Calcutta.
Treatment: 5–6-week-old male C57 mice were divided into seven groups: Control (n = 3), TG3 (n = 3), TG3F (n = 2), TG9 (n = 3), TG9F (n = 2), TG24 (n = 3) and TG24F (n = 2). Three groups (TG3, TG9, and TG24) were treated with 3 % thioglycollate (Himedia, India) intraperitoneally (i.p). Three groups (TG3F, TG9F, and TG24F) were treated with 3 MPK fisetin (i.p) for four consecutive days. After 1 h of 4th day’s treatment, they were intraperitoneally treated with 3 % thioglycollate. One group remained as placebo-treated control.
The mice were killed 3, 9, and 24 h after the final treatments, and the following tissues were collected: peripheral blood (PB), serum, peritoneal fluid (PF), bone marrow (BM), spleen (Spl), Peyer’s patch (PP), intestine (Ins), liver, and kidney.
The following estimations and assays were done with the collected tissues: total cell count (TC), differential cell count (DC), nitric oxide (NO) estimation, catalase estimation, and ascorbic acid estimation.
Total and Differential Cell Count (TC/DC): Differential white blood cell count is an examination and enumeration of the distribution of leukocytes in a stained blood smear. Increases in any of the normal leukocyte types or the presence of immature leukocytes or erythrocytes in peripheral blood are important diagnostically in a wide variety of inflammatory disorders.
The normal range of the leukocytes is as follows:
-
Neutrophils: 50–70 %,
-
Lymphocytes: 20–40 %,
-
Eosinophils: 0–6 %,
-
Monocytes: 2-6 %, and
-
Basophils: 0–1 %.
The smear is stained with hematoxylin, and counterstained with eosin.
Total cell counts of PB, PF, BM, and Spl samples were taken, using hemocytometry. Differential counts of PB and PF were taken. Quickly, 100 μl of each sample was added to appropriate wells of the cytospin, and the slides and filters were placed in the correct slots of the cytospin. The slides were centrifuged at 2000 rpm for 3 min. The slides were removed and air-dried. They were then fixed with methanol and air-dried before staining. The fixed slides were placed in 100 % ethanol in a Coplin jar for 5 min, followed by 10 min in 90 % ethanol. They were then stained with hematoxylin for 5 min, rinsed in 70 % ethanol, counterstained with eosin for 2 min, and again rinsed in 70 % ethanol. Then, they were placed in 100 % ethanol for 1 min and then observed under the microscope.
The total cell count (TC) and the differential cell count (DC) were plotted against each sample using GraphPad Prism 6.
NO Estimation: Activation of immune system is associated with increase in macrophage NO production. Transient nature of NO makes it unsuitable for detection, but it is oxidized to nitrite (NO2 −) and nitrate (NO3 −) by nitrate reductase. The concentrations of these anions are used as quantitative measure of NO production using the Griess reaction. In this reaction, acidified NO2 − produces a nitrosating agent, which reacts with sulfanilic acid to produce diazonium ion. This ion couples with NED (N-1-naphthyl ethylene diamine dihydrochloride) to form a colored product that is measured spectrophotometrically at 540 nm.
The reaction was standardized using different concentrations of NaNO2, using the method in Promega User Guide (Product G2930). 50 μl of cells from each sample (PF, BM, Serum, Ins, and PP & Spl) from all the groups (control, TG3, TG3F, TG9, TG9F, TG24, and TG24F) were plated in the wells of a 96-well plate. The cells were incubated for 24 h, in a CO2 incubator at 5 % CO2, 37 °C. Sulfanilamide solution was prepared by dissolving 1 % sulfanilamide in 5 % ortho-phosphoric acid. 0.1 % NED solution was prepared in distilled water. 50 μl of sulfanilamide solution was added to each well and incubated at room temperature for 5 min, in dark. 50 μl of NED solution was then added and incubated at room temperature for 5 min, in dark. Absorbance was measured in a plate reader at 540 nm. Using the standard curve prepared, the absorbance values of the samples were plotted to get the concentrations of NO produced (in μM). The concentrations of NO were plotted against each sample.
Catalase Estimation: Catalase is an antioxidant enzyme, present in the peroxisomes of all aerobic organisms, that protects against harmful ROS, produced during metabolism. Catalase concentration was measured in this study. 0.5 ml of culture medium supernatant (lung sample) was added to the reaction mixture containing 1 ml of 0.01 M phosphate buffer (pH 7.0), 0.5 ml of 0.2 M H2O2, and 0.4 ml of H2O. The reaction was stopped by adding 2 ml of acid reagent (dichromate/acetic acid), made by mixing 5 % potassium dichromate with glacial acetic acid, in the ratio of 1:3 by volume. The tubes were heated for 10 min, and absorbance was measured at 610 nm using a spectrophotometer (Shimadzu). The concentration of catalase produced was determined from a standard curve.
Ascorbic Acid Estimation: l-ascorbic acid (vitamin C) is an antioxidant, free-radical scavenger, which is present in normal conditions to protect against ROS. Inflammation leads to a decrease in the concentration of ascorbic acid, which can be measured colorimetrically. The reaction mixture for quantification of ASA comprised 0.1 ml of the sample, 2.9 ml distilled water, 1 ml of 2 % DNPH, and 1–2 drops of thiourea. After incubation for 3 h at 37 °C, the osazone crystals formed were dissolved with 7 ml of 80 % sulfuric acid. Absorbance was read after 30 min at 540 nm using a spectrophotometer. The concentration of ASA was determined from a standard curve.
Statistics: All data are presented as mean ± SEM, and only p values of less than 0.05 have been considered as significant. Graphs are plotted using GraphPad Prism 6.
4 Results
4.1 In Vitro Cell Proliferation Assay
-
(a)
With 1 µg/ml LPS treatment—We found that administration of LPS has led to a 1.82-fold decrease (p < 0.05) in cell viability, as compared to untreated control. Administration of fisetin has led to an increase (p < 0.05), compared to LPS-treated cells, with the maximum increase with 20 µM fisetin (1.56-fold). This shows that fisetin is capable of restoring the cell’s proliferative capacity, which had been reduced with LPS treatment.
The absorbance of control, at 570 nm, is assumed to be for 100 % viability. The viabilities of the other samples are calculated with respect to control and plotted (Fig. 4.1 and Table 4.1).
Fig. 4.1 
Effect of different concentrations of fisetin on LPS-treated RAW 264.7 macrophages (
 —p < 0.05 vs. control.
  —p < 0.05 vs. LPS-treated). The absorbance of control, at 570 nm, is assumed to be for 100 % viability. The viabilities of the other samples are calculated with respect to control and plotted. Since the viability plotted in the graph is calculated from the average absorbance, it is a single value, and hence, error bars could not be plotted
Table 4.1 Cell proliferation assay using MTT, on LPS- and fisetin-treated RAW 264.7 macrophages -
(b)
With 50 ng/ml PMA treatment—Here, we demonstrated that administration of PMA has led to a 2.39-fold decrease (p < 0.05) in cell viability, as compared to untreated control. Administration of fisetin has led to an increase (p < 0.05), compared to LPS-treated cells, with the maximum increase with 10 µM fisetin (2.23-fold). This shows that fisetin is capable of restoring the cell’s proliferative capacity, which had been reduced with PMA treatment. The absorbance of control, at 570 nm, is assumed to be for 100 % viability. The viabilities of the other samples are calculated with respect to control and plotted (Fig. 4.2 and Table 4.2).
Fig. 4.2 
Effect of different concentrations of fisetin on PMA-treated RAW 264.7 macrophages (
 —p < 0.05 vs. control.
  —p < 0.05 vs. LPS-treated). The absorbance of control, at 570 nm, is assumed to be for 100 % viability. The viabilities of the other samples are calculated with respect to control and plotted. Since the viability plotted in the graph is calculated from the average absorbance, it is a single value, and hence, error bars could not be plotted
Table 4.2 Cell proliferation assay using MTT, on PMA- and fisetin-treated RAW 264.7 macrophages

 —p < 0.05 vs. control.
  —p < 0.05 vs. LPS-treated). The absorbance of control, at 570 nm, is assumed to be for 100 % viability. The viabilities of the other samples are calculated with respect to control and plotted. Since the viability plotted in the graph is calculated from the average absorbance, it is a single value, and hence, error bars could not be plotted
4.2 In Vitro Cellular Uptake of Fisetin
The uptake of various concentrations of fisetin is assessed by fluorescent microscopy. We found that maximum uptake occurs with 50 µM fisetin, and the uptake reduces with lower concentrations of fisetin (Fig. 4.3).

Effect of fisetin on LPS-treated RAW 264.7 cells, as seen under phase contrast and blue light of Floid Cell Imaging Station (a, c, e, g, i—phase contrast images. b, d, f, h, j—fluorescent images)
4.3 Total Cell Count (TC)
-
(a)
Peritoneal Fluid—The total cell count of peritoneal fluid has increased on treatment with only TG, as compared to control. There is a 1.61-fold increase (p < 0.05) after 3 h, a 2.03-fold increase (p < 0.05) after 9 h, and a 3.35-fold increase (p < 0.05) after 24 h of treatment with TG, as compared to control. The cell count has decreased after treatment with fisetin, compared to only TG, after 3 h (1.08-fold), 9 h (1.19-fold), and after 24 h (1.96-fold, p < 0.05). The increase in TC with administration of fisetin indicates cell recruitment has occurred in response to the inflammation caused by TG. Large numbers of activated cells are recruited to the PF. Fisetin is successful in inhibiting cell recruitment, as shown by the decrease in TC (Fig. 4.4 and Table 4.3).
Fig. 4.4 
Effect of fisetin on the total cell count of peritoneal fluid (
 —p < 0.05 vs. control.
  —p < 0.05 vs. TG)
Table 4.3 Total cell count of peritoneal fluid, taken by hemocytometry -
(b)
Bone Marrow—The total cell count of bone marrow, the site of hematopoiesis, has increased on treatment with only TG, as compared to control, 3 h (1.09-fold), 9 h (1.48-fold) and 24 h (1.72-fold) after treatment. This shows that inflammatory cells are being synthesized in response to the inflammation caused by TG. The cell count has decreased after treatment with fisetin, compared to only TG, after 3 h (1.15-fold), 9 h (1.68-fold), and 24 h (1.80-fold). The decrease in TC with fisetin is indicative of the reduction in inflammation, since synthesis of the cells is reduced (Fig. 4.5 and Table 4.4).
Fig. 4.5 
Effect of fisetin on the total cell count of bone marrow
Table 4.4 Total cell count of bone marrow, taken by hemocytometry -
(c)
Peripheral Blood—The total cell count of peripheral blood has increased on treatment with only TG, as compared to control, 3 h (1.46-fold), 9 h (1.99-fold), and 24 h (1.71-fold) after treatment. This increase indicates systemic inflammation caused by TG, which leads to greater number of cells in the blood for supply to tissues. The cell count has decreased after treatment with fisetin, compared to only TG, after 3 h (1.20-fold), 9 h (1.66-fold), and 24 h (1.54-fold). Fisetin effectively inhibits cell recruitment (Fig. 4.6 and Table 4.5).
Fig. 4.6 
Effect of fisetin on the total cell count of peritoneal fluid
Table 4.5 Total cell count of peripheral blood, taken by hemocytometry -
(d)
Spleen—The total cell count of spleen has increased on treatment with only TG, as compared to control. There is a 1.18-fold increase (p < 0.05) after 3 h, a 1.23-fold increase (p < 0.05) after 9 h, and a 2.01-fold increase (p < 0.05) after 24 h of treatment. The cell count has decreased in all the samples after treatment with fisetin, compared to only TG. There is a 1.27-fold decrease (p < 0.05) after 3 h, a 1.41-fold decrease (p < 0.05) after 9 h, and a 1.62-fold decrease (p < 0.05) after 24 h. This indicates that cell recruitment, which had increased as a response to the inflammation caused by TG, is successfully inhibited by fisetin (Fig. 4.7 and Table 4.6).
Fig. 4.7 
Effect of fisetin on the total cell count of spleen (
 —p < 0.05 vs. control.
  —p < 0.05 vs. TG)
Table 4.6 Total cell count of spleen, taken by hemocytometry

 —p < 0.05 vs. control.
  —p < 0.05 vs. TG)


 —p < 0.05 vs. control.
  —p < 0.05 vs. TG)
4.4 Differential Cell Count (DC)
-
(a)
Peritoneal Fluid—The differential count of peritoneal fluid, treated only with TG, shows an increase in the PMN cell count, as compared to control, 3 h (2.01-fold), 9 h (3.07-fold), and 24 h (2.23-fold) after treatment. On treatment with fisetin, the PMN cell count decreases, compared to only TG, after 3 h (1.34-fold), 9 h (2.26-fold), and 24 h (1.64-fold). The differential count of peritoneal fluid, treated only with TG, shows an increase in the mononuclear (MN) cell count, as compared to control, 3 h (1.38-fold), 9 h (2.02-fold), and 24 h (3.14-fold) after treatment. On treatment with fisetin, the MN cell count decreases, compared to only TG, after 3 h (1.07-fold), 9 h (1.60-fold), and 24 h (2.14-fold) (Fig. 4.8 and Table 4.7).
Fig. 4.8 
Effect of fisetin on the differential count of cells in peritoneal fluid
Table 4.7 Differential cell count of peritoneal fluid, seen after HE staining, under light microscope -
(b)
Peripheral Blood—The differential count of peripheral blood, treated only with TG, shows an increase in the PMN cell count, as compared to control, 3 h (1.81-fold), 9 h (2.90-fold), and 24 h (3.26-fold) after treatment. On treatment with fisetin, the PMN cell count decreases, compared to only TG, after 3 h (1.43-fold), 9 h (1.45-fold), and 24 h (2.37-fold). The differential count of PB, treated only with TG, shows an increase in the MN cell count, as compared to control, 3 h (1.50-fold), 9 h (1.63-fold), and 24 h (1.96-fold) after treatment. On treatment with fisetin, the MN cell count decreases, compared to only TG, after 3 h (1.22-fold), 9 h (1.46-fold), and 24 h (1.72-fold) (Fig. 4.9 and Table 4.8).
Fig. 4.9 
Effect of fisetin on the differential count of cells in peripheral blood
Table 4.8 Differential cell count of peripheral blood, seen after HE staining, under light microscope


4.5 NO Estimation
-
(a)
Peritoneal Fluid—The concentration of nitric oxide (NO) in peritoneal fluid has increased by 1.49-fold after 3 h (p < 0.05), 1.52-fold after 9 h (p < 0.05), and 1.51-fold after 24 h (p < 0.05), after treatment with TG as compared to control. The NO concentration has decreased 1.29-fold after 3 h, 1.18-fold after 9 h and 1.23-fold after 24 h (p < 0.05) with fisetin, as compared to TG. The increase in NO concentration in peritoneal fluid on administration of TG indicates inflammation, which is reduced by the administration of fisetin. The level of inflammation does not undergo much variation over time (Fig. 4.10 and Table 4.9).
Fig. 4.10 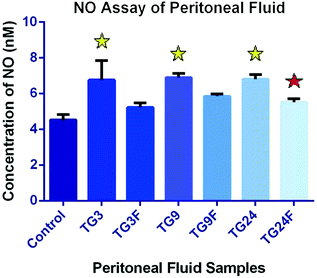
Effect of fisetin on the production of nitric oxide in the peritoneal fluid (
 —p < 0.05 vs. control.
  —p < 0.05 vs. TG)
Table 4.9 Concentration of NO produced in peritoneal fluid -
(b)
Bone Marrow—The concentration of nitric oxide (NO) in bone marrow has decreased 1.12-fold after 3 h and 1.09-fold after 9 h, but has increased 1.48-fold after 24 h (p < 0.05), after treatment with TG as compared to control. With fisetin treatment, the NO concentration has decreased 1.18-fold after 3 h, 1.01-fold after 9 h and 1.69-fold after 24 h (p < 0.05), compared to only TG. The increase in NO concentration in bone marrow on administration of TG after 24 h indicates inflammation, which is reduced by the administration of fisetin. There is not much change after 3 and 9 h (Fig. 4.11 and Table 4.10).
Fig. 4.11 
Effect of fisetin on the production of nitric oxide in the bone marrow (
 —p < 0.05 vs. control.
  —p < 0.05 vs. TG)
Table 4.10 Concentration of NO produced in bone marrow -
(c)
Serum—The concentration of nitric oxide (NO) in serum has decreased by 1.13-fold after 3 h (p < 0.05) and 1.12-fold after 9 h, but has increased by 1.11-fold after 24 h (p < 0.05), after treatment with TG as compared to control. The NO concentration has decreased 1.23-fold after 3 h (p < 0.05) and 1.26-fold after 9 h (p < 0.05), but has remained almost same after 24 h, with fisetin treatment. The increase in NO concentration in serum on administration of TG after 24 h indicates inflammation, which is reduced slightly by the administration of fisetin. The NO concentration decreases after 3 h and 9 h, which is further reduced by fisetin (Fig. 4.12 and Table 4.11).
Fig. 4.12 
Effect of fisetin on the production of nitric oxide in the serum (
 —p < 0.05 vs. control.
  —p < 0.05 vs. TG)
Table 4.11 Concentration of NO produced in serum -
(d)
Peyer’s Patch—The concentration of nitric oxide (NO) in Peyer’s patch has increased by 3.81-fold after 3 h (p < 0.05), 1.40-fold after 9 h (p < 0.05), and 2.38-fold after 24 h (p < 0.05), after treatment with TG as compared to control. The NO concentration has decreased 1.52-fold after 3 h (p < 0.05) and 1.91-fold after 24 h (p < 0.05) with fisetin, compared to only TG, but has increased 1.55-fold after 9 h. The increase in NO concentration in Peyer’s patch on administration of TG indicates inflammation, which is reduced by the administration of fisetin after 3 and 24 h (Fig. 4.13 and Table 4.12).
Fig. 4.13 
Effect of fisetin on the production of nitric oxide in the Peyer’s patch (
 —p < 0.05 vs. control.
  —p < 0.05 vs. TG)
Table 4.12 Concentration of NO produced in Peyer’s patch -
(e)
Intestine—The concentration of nitric oxide (NO) in the intestine has increased 2.69-fold after 3 h (p < 0.05), 1.17-fold after 9 h (p < 0.05) and 1.98-fold after 24 h (p < 0.05), after treatment with TG as compared to control. The NO concentration has decreased by 1.96-fold after 3 h (p < 0.05), 1.63-fold after 9 h (p < 0.05), and 3.44-fold after 24 h (p < 0.05), with fisetin as compared to TG. The increase in NO concentration in intestine on administration of TG indicates inflammation, which is reduced by the administration of fisetin (Fig. 4.14 and Table 4.13).
Fig. 4.14 
Effect of fisetin on the production of nitric oxide in the intestine (
 —p < 0.05 vs. control.
  —p < 0.05 vs. TG)
Table 4.13 Concentration of NO produced in intestine -
(f)
Spleen—The concentration of nitric oxide (NO) in the intestine has increased by 1.90-fold after 3 h (p < 0.05) and 1.24-fold after 24 h (p < 0.05), after treatment with TG as compared to control, but has decreased slightly (1.01-fold) after 9 h. The NO concentration has decreased by 1.28-fold after 3 h (p < 0.05) and 2.15-fold after 24 h (p < 0.05) with fisetin treatment, compared to only TG, but has increased 1.20-fold after 9 h. The increase in NO concentration in spleen on administration of TG indicates inflammation, which is reduced by the administration of fisetin (Fig. 4.15 and Table 4.14).
Fig. 4.15 
Effect of fisetin on the production of nitric oxide in the spleen (
 —p < 0.05 vs. control.
  —p < 0.05 vs. TG)
Table 4.14 Concentration of NO produced in spleen

 —p < 0.05 vs. control.
  —p < 0.05 vs. TG)
 —p < 0.05 vs. control.
  —p < 0.05 vs. TG)
 —p < 0.05 vs. control.
  —p < 0.05 vs. TG)
 —p < 0.05 vs. control.
  —p < 0.05 vs. TG)
 —p < 0.05 vs. control.
  —p < 0.05 vs. TG)
 —p < 0.05 vs. control.
  —p < 0.05 vs. TG)
4.6 Catalase Estimation
-
(a)
Peritoneal Fluid—The concentration of catalase in peritoneal fluid has decreased on treatment with only TG, as compared to control, 3 h (1.25-fold), 9 h (1.81-fold), and 24 h (1.62-fold) after treatment. The catalase concentration has increased after treatment with fisetin, compared to only TG, after 9 h (1.23-fold) and 24 h (1.07-fold), but has decreased after 3 h (1.12-fold) (Fig. 4.16 and Table 4.15).
Fig. 4.16 
Effect of fisetin on the production of catalase in the peritoneal fluid
Table 4.15 Concentration of catalase produced in peritoneal fluid -
(b)
Bone Marrow—The concentration of catalase in bone marrow has decreased after 9 h (1.16-fold) and 24 h (1.15-fold), on treatment with only TG, as compared to control, but has increased 3 h (1.04-fold) after treatment. The catalase concentration has increased after treatment with fisetin, compared to only TG, after 3 h (1.12-fold), 9 h (1.36-fold), and 24 h (1.27-fold) (Fig. 4.17 and Table 4.16).
Fig. 4.17 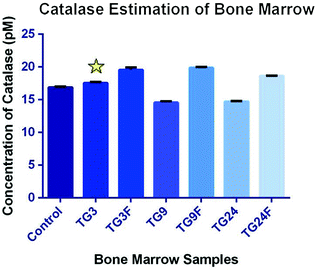
Effect of fisetin on the production of catalase in the bone marrow (
 —p < 0.05 vs. control.
  —p < 0.05 vs. TG)
Table 4.16 Concentration of catalase produced in bone marrow -
(c)
Serum—The concentration of catalase in serum has decreased on treatment with only TG, as compared to control, 3 h (1.41-fold), 9 h (1.95-fold), and 24 h (1.34-fold) after treatment. The catalase concentration has increased after treatment with fisetin, compared to only TG, after 3 h (1.11-fold), 9 h (1.55-fold), and 24 h (1.09-fold) (Fig. 4.18 and Table 4.17).
Fig. 4.18 
Effect of fisetin on the production of catalase in the bone marrow
Table 4.17 Concentration of catalase produced in serum -
(d)
Peyer’s Patch—The concentration of catalase in Peyer’s patch has decreased on treatment with only TG, as compared to control, 3 h (1.05-fold) after treatment, but has increased significantly (p < 0.05) after 9 h (1.08-fold) and 24 h (1.69-fold). The catalase concentration has increased after treatment with fisetin, compared to only TG, after 3 h (1.02-fold), but has remained almost unchanged after 9 h, and has decreased by 1.29-fold after 24 h (p < 0.05) (Fig. 4.19 and Table 4.18).
Fig. 4.19 
Effect of fisetin on the production of catalase in the Peyer’s patch (
 —p < 0.05 vs. control.
  —p < 0.05 vs. TG)
Table 4.18 Concentration of catalase produced in Peyer’s patch -
(e)
Intestine—The concentration of catalase in intestine has decreased on treatment with only TG, as compared to control, 1.17-fold after 3 h, 1.91-fold after 9 h, and 1.96-fold after 24 h after treatment. The catalase concentration has increased after treatment with fisetin, compared to only TG, after 3 h (1.09-fold), 9 h (1.09-fold), and 24 h (1.16-fold) (Fig. 4.20 and Table 4.19).
Fig. 4.20 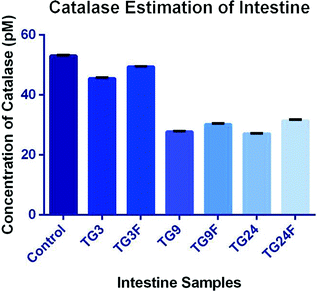
Effect of fisetin on the production of catalase in the intestine
Table 4.19 Concentration of catalase produced in intestine -
(f)
Spleen—The concentration of catalase in spleen has decreased on treatment by 1.07-fold after 3 h, 1.81-fold after 9 h, and 1.03-fold after 24 h, with only TG, as compared to control. The catalase concentration has increased after treatment with fisetin, compared to only TG, after 3 h (1.07-fold), 9 h (2.71-fold), and 24 h (1.46-fold) (Fig. 4.21 and Table 4.20).
Fig. 4.21 
Effect of fisetin on the production of catalase in the intestine
Table 4.20 Concentration of catalase produced in spleen


 —p < 0.05 vs. control.
  —p < 0.05 vs. TG)

 —p < 0.05 vs. control.
  —p < 0.05 vs. TG)

4.7 Ascorbic Acid Estimation
-
(a)
Peritoneal fluid—The concentration of ascorbic acid in peritoneal fluid has increased by 1.06-fold after 3 h, 1.02-fold after 9 h, and 1.05-fold after 24 h, on treatment with only TG, as compared to control. The ASA concentration has increased significantly (p < 0.05) after treatment with fisetin, compared to only TG, after 3 h (1.38-fold), 9 h (1.44-fold), and 24 h (2.19-fold) (Fig. 4.22 and Table 4.21).
Fig. 4.22 
Effect of fisetin on the production of ascorbic acid in the peritoneal fluid (
 —p < 0.05 vs. control.
  —p < 0.05 vs. TG)
Table 4.21 Concentration of ASA produced in peritoneal fluid -
(b)
Bone marrow—The concentration of ascorbic acid in bone marrow has decreased by 1.11-fold after 3 h (p < 0.05) and 1.02-fold after 9 h, on treatment with only TG, as compared to control. It has increased slightly after 24 h (1.03-fold). The ASA concentration has increased significantly (p < 0.05) after treatment with fisetin, compared to only TG, after 3 h (1.14-fold), 9 h (1.50-fold), and 24 h (1.47-fold) (Fig. 4.23 and Table 4.22).
Fig. 4.23 
Effect of fisetin on the production of ascorbic acid in the bone marrow (
 —p < 0.05 vs. control.
  —p < 0.05 vs. TG)
Table 4.22 Concentration of ASA produced in bone marrow -
(c)
Serum—After treatment with only TG, as compared to control, the concentration of ascorbic acid in serum has decreased by 1.01-fold, 3 h after treatment, but has increased after 9 h (1.07-fold) and 24 h (1.03-fold). The ASA concentration has increased significantly (p < 0.05) after treatment with fisetin, compared to only TG, after 3 h (1.15-fold), 9 h (1.69-fold), and 24 h (1.47-fold) (Fig. 4.24 and Table 4.23).
Fig. 4.24 
Effect of fisetin on the production of ascorbic acid in the serum (
 —p < 0.05 vs. control.
  —p < 0.05 vs. TG)
Table 4.23 Concentration of ASA produced in serum -
(d)
Peyer’s patch—The concentration of ascorbic acid in Peyer’s patch has decreased significantly (p < 0.05) on treatment with only TG, as compared to control, 3 h (1.07-fold), 9 h (2.16-fold), and 24 h (1.79-fold) after treatment. The ASA concentration has increased 1.05-fold after 9 h and 1.52-fold after 24 h (p < 0.05) after treatment with fisetin, compared to only TG, but has decreased 1.12-fold after 3 h (Fig. 4.25 and Table 4.24).
Fig. 4.25 
Effect of fisetin on the production of ascorbic acid in the Peyer’s patch (
 —p < 0.05 vs. control.
  —p < 0.05 vs. TG)
Table 4.24 Concentration of ASA produced in Peyer’s patch -
(e)
Intestine—The concentration of ascorbic acid in intestine has decreased significantly (p < 0.05) on treatment with only TG, as compared to control, 3 h (1.36-fold), 9 h (3.21-fold), and 24 h (1.91-fold) after treatment. The ASA concentration has increased significantly (p < 0.05) after treatment with fisetin, compared to only TG, after 3 h (1.30-fold) and 9 h (1.27-fold), but has decreased after 24 h (1.11-fold) (Fig. 4.26 and Table 4.25).
Fig. 4.26 
Effect of fisetin on the production of ascorbic acid in the intestine (
 —p < 0.05 vs. control.
  —p < 0.05 vs. TG)
Table 4.25 Concentration of ASA produced in intestine -
(f)
Spleen—The concentration of ascorbic acid in spleen has decreased significantly (p < 0.05) on treatment with only TG, as compared to control, 3 h (1.44-fold), 9 h (1.17-fold), and 24 h (1.13-fold) after treatment. The ASA concentration has increased significantly (p < 0.05) after treatment with fisetin, compared to only TG, after 3 h (1.90-fold), 9 h (2.92-fold), and 24 h (1.76-fold) (Fig. 4.27 and Table 4.26).
Fig. 4.27 
Effect of fisetin on the production of ascorbic acid in the spleen (
 —p < 0.05 vs. control.
  —p < 0.05 vs. TG)
Table 4.26 Concentration of ASA produced in spleen

 —p < 0.05 vs. control.
  —p < 0.05 vs. TG)
 —p < 0.05 vs. control.
  —p < 0.05 vs. TG)
 —p < 0.05 vs. control.
  —p < 0.05 vs. TG)
 —p < 0.05 vs. control.
  —p < 0.05 vs. TG)
 —p < 0.05 vs. control.
  —p < 0.05 vs. TG)
 —p < 0.05 vs. control.
  —p < 0.05 vs. TG)
5 Discussion
In this present study, we have induced peritonitis in C57BL/6 J mice using thioglycollate and then assessed the anti-inflammatory effects of plant flavonoid, fisetin, when administered prophylactically, by in vitro and in vivo assays. We have also induced inflammation on RAW macrophages and seen the effect of fisetin on them. We have used fisetin which is traditionally used to treat different inflammation-related diseases. We found that fisetin had a positive prophylactic effect on the peritonitis. This is the first evidence showed that fisetin may have prophylactic effect against the thioglycollate-induced peritonitis in mice.
Intraperitoneal infection known as peritonitis is a major killer in the practice of clinical surgery and it is also one of the most frequent diagnoses in a surgical ICU leading to severe sepsis [31]. Intra-abdominal sepsis, although it affects all age groups, takes a greater toll on the elderly population than it does on younger populations. In approximately 80 % of the patients with a secondary peritonitis, the initial surgical intervention may sanitize the abdominal cavity from the infectious lesion. The remaining patients develop a persisting peritonitis with a considerable number of subsequent surgical interventions, infectious complications, a high rate of severe sepsis, and septic shock as well as a mortality double as high ranging between 30 and 63 % [32–34]. Hospital-acquired infections especially the TP have the highest mortality. High mortality is the consequence of the large number of difficult clinical courses and high rates of severe sepsis and septic shock. Several authors defined TP as a diffuse, therapy-resistant peritonitis with fungi or low-grade pathogenic bacteria in the absence of a well-defined infective focus after apparently adequate therapy [35–38]. Primary peritonitis is also known as SBP and has a low incidence on surgical ICUs as it is managed purely without any surgical intervention and mostly by physician. Secondary peritonitis is the most common entity in critical surgical patients and is defined as an infection of the peritoneal cavity resulting from hollow viscous perforation, ischemic necrosis, or other injuries of the gastrointestinal tract [39]. There is significant difference between the microbial flora in tertiary and secondary peritonitis and TP comprises of mostly opportunistic and nosocomial facultative pathogenic bacteria and fungi (e.g., enterococci, Enterobacter, and Candida). The development of multidrug resistance has also been observed in microbes causing TP due to use of broad spectrum antibiotic therapy [15]. Due to the character of disease, medical treatment for secondary and TP differs considerably.
Peritonitis remains as a serious complication influencing patients’ mortality [40]. In the process of peritonitis, bacteria are the main source of local and systemic infections. Bacterial pathogens and their products trigger the inflammatory response by transcriptional activation of inflammatory genes, leading to the release of large number of inflammatory mediators, including cytokines, chemokines, adhesion molecules, reactive oxygen, which can easily cause sepsis when they are uncontrolled and excessive [41]. Previous investigators found that acute peritonitis was associated with the activation of the transcription factor NF-κB in various organs and tissues, which can regulate the synthesis of TNF-α, IL-6 and many other molecules involved in the inflammatory reaction [42–45]. The spectrum of peritonitis in India continues to differ from Western countries.
Flavonoids are polyphenol compounds, widely distributed in plant foods, which may exert beneficial effects in various diseases. Many of the biological actions of flavonoids have been attributed to their antioxidant properties [46]. The highest levels of fisetin, a flavonoid compound (160 µg/g) are found in strawberries with 5–10-fold lower levels in apples and persimmons and smaller amounts in kiwi fruit, peaches, grapes, tomatoes, onions, and cucumbers [47, 48]. Emerging data from in vitro and in vivo studies indicate that fisetin possesses antiproliferative properties against several cancers [49, 50].
In our study, cells treated with inflammatory agents such as LPS and PMA lose their viability and their proliferative capacity. Fisetin has been shown to prevent the loss of viability when given prophylactically. Cellular uptake studies have shown that cells take up the fisetin, so it can act from within the cell. We also found that total cell recruitment increases with the administration of TG, showing that it has induced inflammation, and the body is synthesizing more immune cells to counter the infection. Cell recruitment was successfully inhibited by fisetin. Nitric acid is produced by macrophages as a defense against oxidative stress. Catalase is produced by cells to break down harmful ROS. Ascorbic acid, an antioxidant, is normally present in the body to protect against ROS. In case of inflammation, both NO and catalase content are expected to increase, but ascorbic acid content is expected to decrease. Our assays have shown this to be the case, except with catalase. The NO content of the tissues has increased with TG challenge and has decreased with fisetin. The ASA concentration has decreased with TG and has increased significantly with fisetin treatment. Plant-derived natural products contributed significantly to drug discovery in the past and still provide an effective source for new drug development. Although fisetin is not particularly abundant in many fruits and vegetables, the incorporation of significant quantities of fisetin-rich foods into the diet of diseased patients might provide an alternative approach.
In conclusion, peritonitis continues to be an important problem in the healthcare system. Fisetin, has recently received some attention for its beneficial effects against several diseases. Our research study showed that the use of fisetin could effectively reduce the severity of acute peritonitis in our rodent model. Further studies need to be done to verify the effect of flavonoid compound, explore the mechanisms, and promote the clinical use. An accurate biomarker for the early identification of peritonitis would be of great diagnostic value. An early finding of the correct diagnosis of peritonitis and the subsequent effective initiation of an appropriate treatment may help to lower the complication rate and to improve the prognosis.
Abbreviations
- ASA:
-
Ascorbic acid
- BM:
-
Bone marrow
- CFU-c:
-
Colony-forming units in culture
- DC:
-
Differential cell count
- F:
-
Fisetin
- Ins:
-
Intestine
- LPS:
-
Lipopolysachharide
- MN Cells:
-
Mononuclear cells
- MTS:
-
[3-(4, 5-dimethyl thiazol-2-yl)-5-(3-carboxy methoxy phenyl)-2-(4-sulfophenyl)-2H-tetrazolium, inner salt]
- MTT:
-
3-(4, 5-dimethyl thiazol-2-yl)-2, 5-diphenyl tetrazolium bromide
- MPK:
-
Milligram per kilogram of body weight
- NO:
-
Nitric oxide
- PB:
-
Peripheral blood
- PF:
-
Peritoneal fluid
- PMA:
-
Phorbol 12-myristate 13-acetate
- PMN Cells:
-
Polymorphonuclear cells
- PMS:
-
Phenazine methosulfate
- PP:
-
Peyer’s patch
- Spl:
-
Spleen
- TC:
-
Total cell count
- TG:
-
Thioglycollate
- TG3F, TG9F, TG24F:
-
Treatment with fisetin for 4 days, followed by treatment with 3 % TG 1 h after last fisetin treatment; Kill 3, 9, and 24 h after TG treatment, respectively
- TG3, TG9, TG72, TG24:
-
Treatment with only TG; kill after 3, 9, 24 h, respectively
-
 :
: -
Denotes significance in samples compared to control
-
 :
: -
Denotes significance in samples compared to samples treated with only TG
 :
: :
:References
Angus DC, Wax RS. Epidemiology of sepsis: an update. Crit Care Med. 2001;29:S109–16.
Hardaway RM. A review of septic shock. Am Surg. 2000;66:22–9.
Remick DG. Pathophysiology of sepsis. Am J Pathol. 2007;170:1435–44.
Anel RL, Kumar A. Experimental and emerging therapies for sepsis and septic shock. Expert Opin Investig Drugs. 2001;10:1471–85.
Dellinger RP. Inflammation and coagulation: implications for the septic patient. Clin Infect Dis. 2003;36:1259–65.
Zhang J, Wu Q, Song S, Wan Y, Zhang R, Tai M, Liu C. Effect of hydrogen-rich water on acute peritonitis of rat models. Int Immunopharmacol. 2014;21(1):94–101.
Billing AG, Frohlich D, Konecny G, Schildberg FW, Machleidt W, Fritz H, et al. Local serum application—restoration of sufficient host-defense in human peritonitis. Eur J Clin Invest. 1994;24:28–35.
Ghiselli R, Giacomefti A, Cirioni O, Mocchegiani F, Orlando F, Silvestri C, et al. Efficacy of the bovine antimicrobial peptide indolicidin combined with pipeyacillin/tazobactam in experimental rat models of polymicrobial peritonitis. Crit Care Med. 2008;36:240–5.
Lippi G, Danese E, Cervellin G, Montagnana M. Laboratory diagnostics of spontaneous bacterial peritonitis. Clin Chim Acta. 2014;20(430):164–70.
Yang SK, Xiao L, Zhang H, Xu XX, Song PA, Liu FY, Sun L. Significance of serum procalcitonin as biomarker for detection of bacterial peritonitis: a systematic review andmeta-analysis. BMC Infect Dis. 2014;22(14):452.
Cai ZH, Fan CL, Zheng JF, Zhang X, Zhao WM, Li B, Li L, Dong PL, Ding HG. Measurement of serum procalcitonin levels for the early diagnosis of spontaneous bacterialperitonitis in patients with decompensated liver cirrhosis. BMC Infect Dis. 2015;15(1):55.
Lutz P, Nischalke HD, Strassburg CP, Spengler U. Spontaneous bacterial peritonitis: the clinical challenge of a leaky gut and a cirrhotic liver. World J Hepatol. 2015;7(3):304–14.
Doklestić SK, Bajec DD, Djukić RV, Bumbaširević V, Detanac AD, Detanac SD, Bracanović M, Karamarković RA. Secondary peritonitis—evaluation of 204 cases and literature review. J Med Life. 2014;7(2):132–8.
Alessiani M, Gianola M, Rossi S, Perfetti V, Serra P, Zelaschi D, Magnani E, Cobianchi L. Peritonitis secondary to spontaneous perforation of a primary gastrointestinal stromal tumour of the smallintestine: a case report and a literature review. Int J Surg Case Rep. 2015;6C:58–62.
Mishra SP, Tiwary SK, Mishra M, Gupta SK. An introduction of tertiary peritonitis. J Emerg Trauma Shock. 2014;7(2):121–3.
Panhofer P, Izay B, Riedl M, Ferenc V, Ploder M, Jakesz R, Götzinger P. Age, microbiology and prognostic scores help to differentiate between secondary and tertiary peritonitis. Langenbecks Arch Surg. 2009;394(2):265–71.
Weiss G, Meyer F, Lippert H. Infectiological diagnostic problems in tertiary peritonitis. Langenbecks Arch Surg. 2006;391(5):473–82.
Fakhrudin N, Waltenberger B, Cabaravdic M, Atanasov AG, Malainer C, Schachner D, Heiss EH, Liu R, Noha SM, Grzywacz AM, Mihaly-Bison J, Awad EM, Schuster D, Breuss JM, Rollinger JM, Bochkov V, Stuppner H, Dirsch VM. Identification of plumericin as a potent new inhibitor of the NF-κB pathway with anti-inflammatory activity in vitro and in vivo. Br J Pharmacol. 2014;171(7):1676–86.
Gelderblom M, Leypoldt F, Lewerenz J, Birkenmayer G, Orozco D, et al. The flavonoid fisetin attenuates post ischemic immune cell infiltration, activation and infarct size after transient cerebral middle artery occlusion in mice. J Cereb Blood Flow Metab. 2012;32:835–43.
Sahu BD, Kalvala AK, Koneru M, Mahesh Kumar J, Kuncha M, Rachamalla SS, Sistla R. Ameliorative effect of fisetin on cisplatin-induced nephrotoxicity in rats via modulation of NF-κB activation and antioxidant defence. PLoS ONE. 2014;9(9):e105070.
Khan N, Asim M, Afaq F, Abu Zaid M, Mukhtar H. A novel dietary flavonoid fisetin inhibits androgen receptor signaling and tumor growth in athymic nude mice. Cancer Res. 2008;68:8555–63.
Murtaza I, Adhami VM, Hafeez BB, Saleem M, Mukhtar H. Fisetin, a natural flavonoid, targets chemoresistant human pancreatic cancer AsPC-1 cells through DR3-mediated inhibition of NF-kappa B. Int J Cancer. 2009;125:2465–73.
Syed DN, Afaq F, Maddodi N, Johnson JJ, Sarfaraz S, Ahmad A, Setaluri V, Mukhtar H. Inhibition of human melanoma cell growth by the dietary flavonoid fisetin is associated with disruption of Wnt/beta-catenin signaling and decreased Mitf levels. J Invest Dermatol. 2011;131:1291–9.
Chen YC, Shen SC, Lee WR, Lin HY, Ko CH, Shih CM, Yang LL. Wogonin and fisetin induction of apoptosis through activation of caspase 3 cascade and alternative expression of p21 protein in hepatocellular carcinoma cells SK-HEP-1. Arch Toxicol. 2002;76:351–9.
Leotoing L, Wauquier F, Guicheux J, Miot-Noirault E, Wittrant Y, et al. The polyphenol fisetin protects bone by repressing NF-kB and MKP-1-dependent signaling pathways in osteoclasts. PLoS ONE. 2013;8:e68388.
Khan N, Afaq F, Syed DN, Mukhtar H. Fisetin, a novel dietary flavonoid, causes apoptosis and cell cycle arrest in human prostate cancer LNCaP cells. Carcinogenesis. 2008;29:1049–56.
Sung B, Pandey MK, Aggarwal BB. Fisetin, an inhibitor of cyclin-dependent kinase 6, down-regulates nuclear factor kappa B-regulated cell proliferation, anti apoptotic and metastatic gene products through the suppression of TAK-1and receptor-interacting protein-regulated IkappaB alpha kinase activation. Mol Pharmacol. 2007;71:1703–14.
Chen PY, Ho YR, Wu MJ, Huang SP, Chen PK, Tai MH, Ho CT, Yen JH. Cytoprotective effects of fisetin against hypoxia-induced cell death in PC12 cells. Food Funct. 2015;6(1):287–96.
Ravichandran N, Suresh G, Ramesh B, Manikandan R, Choi YW, Vijaiyan Siva G. Fisetin modulates mitochondrial enzymes and apoptotic signals in benzo(a)pyrene-induced lung cancer. Mol Cell Biochem. 2014;390:225–34.
Yang PM, Tseng HH, Peng CW, Chen WS, Chiu SJ. Dietary flavonoid fisetin targets caspase-3-deficient human breast cancer MCF-7 cells by induction of caspase-7-associated apoptosis and inhibition of autophagy. Int J Oncol. 2012;40:469–78.
Weiss G, Steffanie W, Lippert H. Peritonitis: main reason of severe sepsis in surgical intensive care. Zentralbl Chir. 2007;132:130–7.
Buijk SE, Bruining HA. Future directions in the management of tertiary peritonitis. Intensive Care Med. 2002;28:1024–9.
Marshall JC, Innes M. Intensive care unit management of intra abdominal infection. Crit Care Med. 2003;31:2228–37.
Nathens AB, Rotstein O, Marshall JC. Tertiary peritonitis: clinical features of a complex nosocomial infection. World J Surg. 1998;22:158–63.
Malangoni MA. Evaluation and management of tertiary peritonitis. Am Surg. 2000;66(2):157–61.
Chromik AM, Meiser A, Hölling J, Sülberg D, Daigeler A, Meurer K, Vogelsang H, Seelig MH, Uhl W. Identification of patients at risk for development of tertiary peritonitis on a surgical intensive care unit. J Gastrointest Surg. 2009;13(7):1358–67.
Evans HL, Raymond DP, Pelletier SJ, Crabtree TD, Pruett TL, Sawyer RG. Tertiary peritonitis (recurrent diffuse or localized disease) is not an independent predictor of mortality in surgical patients with intraabdominal infection. Surg Infect. 2001;2:255–63.
Panhofer P, Riedl M, Izay B, Ferenc V, Ploder M, Jakesz R, Götzinger P. Clinical outcome and microbial flora in patients with secondary and tertiary peritonitis. Eur Surg. 2007;39:259–64.
Calandra T, Cohen J. The international sepsis forum consensus conference on definitions of infection in the intensive care unit. Crit Care Med. 2005;33:1538–48.
Davenport A. Peritonitis remains the major clinical complication of peritoneal dialysis: the London, UK, peritonitis audit 2002–2003. Perit Dial Int. 2009;29:297–302.
Cohen J. The immunopathogenesis of sepsis. Nature. 2002;420:885–91.
Tian J, Lin X, Guan R, Xu JG. The effects of hydroxyethyl starch on lung capillary permeability in endotoxic rats and possible mechanisms. Anesth Analg. 2004;98:768–74.
Feng X, Liu J, Yu M, Zhu S, Xu J. Protective roles of hydroxyethyl starch 130/0.4 in intestinal inflammatory response and survival in rats challenged with polymicrobial sepsis. Clin Chim Acta. 2007;376:60–7.
Perkins ND. The Rel/NF-kappa B family: friend and foe. Trends Biochem Sci. 2000;25:434–40.
Sha WC. Regulation of immune responses by NF-kappa B/Rel transcription factors. J Exp Med. 1998;187:143–6.
Fiorani M, Accorsi A. Dietary flavonoids as intracellular substrates for an erythrocyte trans-plasma membrane oxidoreductase activity. Br J Nutr. 2005;94(3):338–45.
Arai Y, Watanabe S, Kimira M, Shimoi K, Mochizuki R, et al. Dietary intakes of flavonols, flavones and isoflavones by Japanese women and the inverse correlation between quercetin intake and plasma LDL cholesterol concentration. J Nutr. 2000;130:2243–50.
Maher P, Dargusch R, Ehren JL, Okada S, Sharma K, Schubert D. Fisetin lowers methylglyoxal dependent protein glycation and limits the complications of diabetes. PLoS ONE. 2011;6(6):e21226.
Syed DN, Suh Y, Afaq F, Mukhtar H. Dietary agents for chemoprevention of prostate cancer. Cancer Lett. 2008;265:167–76.
Khan N, Syed DN, Ahmad N, Mukhtar H. Fisetin: a dietary antioxidant for health promotion. Antioxid Redox Signal. 2013;19(2):151–62.
Author information
Authors and Affiliations
Corresponding author
Rights and permissions
Copyright information
© 2016 Springer Science+Business Media Singapore
About this chapter
Cite this chapter
Ray Banerjee, E. (2016). Aseptic Peritonitis Model for Drug Discovery (for Prophylaxis). In: Perspectives in Translational Research in Life Sciences and Biomedicine. Springer, Singapore. https://doi.org/10.1007/978-981-10-0989-1_4
Download citation
DOI: https://doi.org/10.1007/978-981-10-0989-1_4
Published:
Publisher Name: Springer, Singapore
Print ISBN: 978-981-10-0988-4
Online ISBN: 978-981-10-0989-1
eBook Packages: Biomedical and Life SciencesBiomedical and Life Sciences (R0)