
Abstract
Interventional radiology is today considered the first-line treatment for osteoid osteoma both in the form of needle-guided technique of ablation (Radiofrequency) and of needleless technique (magnetic resonance-guided focused ultrasound surgery). The follow-up study of the procedures is mainly clinical, since the disappearance of pain is consistent with the success of the procedure. However, due to the minimally invasive and innovative nature of the approach, interpretation of the follow-up imaging could be ambiguous and misleading. Aim of our review was to define the main findings on the imaging that can best describe the regular evolution of these types of treatment. In particular, four findings were considered: (1) bone marrow oedema; (2) reactive phenomena (perilesional inflammatory reaction for extra-articular lesions or synovial reaction for intra-articular lesions); (3) bone remodelling (disappearance of the nidus and bone healing); (4) ring sign (considered as the granulation tissue around the nidus treated). These findings were evaluated using MRI and CT with a follow-up study that lasted up to 24 months.
Introduction
Osteoid osteoma (OO) is a benign bone tumour that account for about 10–12% of all benign bone lesions and 2–3% of all primary bone tumours [1]. Typically it occurs in the first two decades of life (75% of cases between 5 and 25 years old) and it affects mainly men (male female ratio 3:1). Most frequently OO grows in the proximal femur and tibia [2]. Osteoid osteomas are usually extra-articularly; intra-articular lesions are less common (10–12%) [3, 4].
Imaging is usually typical: a radiolucent central nidus, which may display a variable amount of mineralization, surrounded by cortical thickening and/or reactive sclerosis [5, 6].
Clinically it is painful: the pain, caused by prostaglandins released by the nidus [7], increases intensity during the night and relieved by non-steroidal anti-inflammatory drugs (NSAIDs) particularly salicylates [1]. A conservative medical therapy with non-steroidal anti-inflammatory drugs represents only a symptomatic treatment and can cause long-term side effects. Surgery is currently no longer used [8,9,10]. Mini invasive treatments (in particular, percutaneous computed tomography (CT)-guided Radio Frequency Ablation (RFA) [11]), and Magnetic Resonance-guided focused Ultrasound ablation (MRgFUS) [12, 13] have become the gold standard techniques for management of this lesion. Multiple studies [14, 15] have investigated and confirmed effectiveness, safety and low invasiveness of these treatments; anyway, the results are based mainly on clinical data [16, 17]. On the other hand, only few studies describe the evolution of the imaging features of the treated lesions along the follow-up [18, 19], generally using contrast-enhanced MRI sequences and usually with an observational aim. The aim of our study is instead to looking for some characteristic diagnostic findings that characterize the imaging at the diagnosis and that change along the follow-up (up to 24 months) after Radiofrequency Ablation (RFA) or Magnetic Resonance-guided Focused Ultrasound (MRgFUS) treatment. The knowledge of these features and their evolution over time in fact could be of particular interest in order to confirm the minimally invasive nature of the procedures and in order to detect the best time of follow-up in case of suspicion of a treatment failure.
Materials and methods
We have retrospectively analysed, through a second reading, the imaging outcome of the follow-up of successfully minimally invasive treatments (RFA and MRgFUS) of osteoid osteoma.
Of all the patients treated and followed in our hospital, we selected only case that followed these inclusion criteria:
- 1.
Patient suffering for a symptomatic OO, successfully treated with complete clinical resolution without need for re-treatment;
- 2.
Availability of a complete clinical history of the patient (before and after treatment) both from the clinical than imaging data.
Exclusion criteria were:
- 1.
Unsuccessful treatments;
- 2.
Treatment, for whom there was not a complete report of any clinical and imaging data before and after.
For each treatment we review any clinical and imaging data acquired before and after treatment.
About clinical data a 0–10 visual analogue scale (VAS) was used to assess pain symptomatology.
Instrumental evaluations were based on MRI and CT scans. The preprocedural imaging was not-standardized because patients have come from different diagnostic centres with their imaging; however, each patient had an MRI and CT examination of the pathological bone segment. The post-procedural imaging was performed in our hospital: for MRI examinations: 1.5T Signa, GE Healthcare, Milwaukee, USA; 3T Signa, GE Healthcare, Milwaukee) were performed with standard sequences (FSE T1, FSE T2, Short Tau Inversion Recovery (STIR) and Proton Density, DP) on the most representative planes for each localization. CT scans (Aquilion One, Toshiba, Tokyo, Japan) were performed on the area of interest to limit radiation exposure, considering the young ages of patients.
Baseline imaging was considered the scans acquired before the procedure (using both MRI and CT scans). The follow-up were performed from 4 to 6 months after treatment (Follow-up 1, FU1), from 9 to 12 months (Follow-up 2 FU2) and from 18 to 24 months (Follow-up 3, FU3) after treatment. The FU1 consisted in MRI examination only; FU2 and FU3 consisted in MRI and CT scans.
Prior of the examination’s second lecture, two senior authors (CM and AB) with more than 25 years of experience in musculoskeletal radiology, selected the four most representative imaging findings that, according to their experience but also to the literature [15, 18], usually characterize the pre- and post-procedural imaging of an osteoid osteoma correctly and successfully treated. Because slight differences between the imaging features of the intra- and extra-articular lesions (IA and EA, respectively) were identified, lesions were split into two groups (IA and EA).
Of the four imaging findings setted, the first two parameters are the two more evident signs that correlate with the presence of the lesion, whereas the last two correlate with the good clinical outcome:
- I
Bone marrow oedema (Fig. 1);
Fig. 1 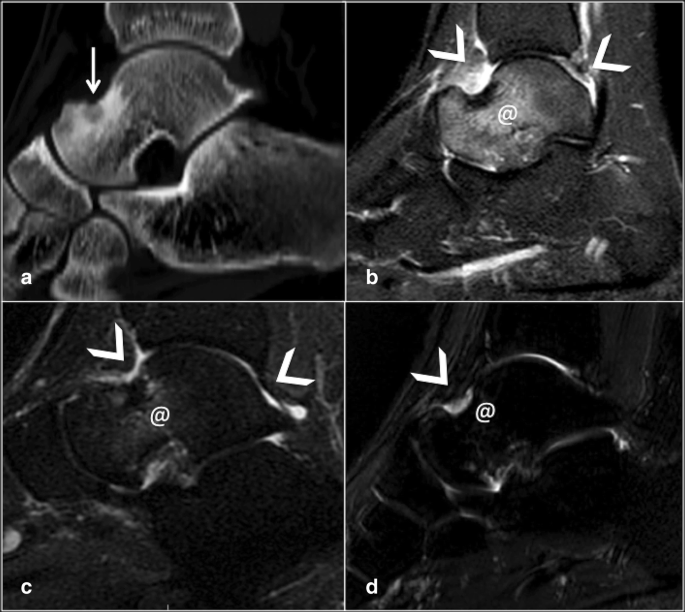
Reactive phenomena in intra-articular lesion: CT (a) and MRI T2W image with fat saturation (b): osteoid osteoma of the talus (white arrow) with synovial reaction (arrowheads) and bone oedema (@); significant reduction of the bone oedema and synovitis (arrowheads and @, respectively) 6 months after treatment (c); they have a complete resolution at the 12 months follow-up (d)
- II
Reactive phenomena: perilesional flogistics reaction (for EA lesions, Fig. 2) or synovial reaction (for IA lesions, Fig. 1);
Fig. 2 
Reactive phenomena in extra-articular lesion: CT (a) and MRI T2W image with fat saturation (b): osteoid osteoma of the lateral profile of the Tibia (white arrows) with perilesional reaction (arrowheads) and bone oedema (@); c 6 months follow-up: they still remain a slight bone oedema and reactive phenomena (arrowhead and @, respectively)
- III
Bone remodelling (intended as disappearance of the nidus and the bone healing, Fig. 3);
Fig. 3 
Bone remodelling: CT osteoid osteoma of the anterior profile of the proximal femur (white arrows) (a); there are an initial sclerosis of the nidus at 12 months follow-up and a complete re structuring and sclerosis of the bone at 24 months follow-up, respectively, (b) and (c)
- IV
Ring sign (considered as the granulation tissue demarcation between the area with necrotic tissue and the area with vital tissue; it is identified as a central hypointense area surrounded by a peripheral hyperintense rim that indicates the presence of a reactive interface between the ablated region and the healthy tissue [20]) (Fig. 4).
Fig. 4 
Ring sign: CT (a) and MRI T2W image with fat saturation (b): osteoid osteoma of the anterior profile of the femoral neck (white arrows); 6 months follow-up (b) shows granulation tissue, identified as a central hypointense area surrounded by a peripheral hyperintense rim (arrowheads). 12 months follow-up (c) with complete resolution of this inflammatory reaction


For each of these signs, the radiologists (CM, AB, LZ and FR) in consensus gave a score compared the previous imaging with the follow-up:
For the first two parameters:
as pre-treatment (=)
reduction of 30% (±)
reduction of 60–70% (−)
complete resolution (✓)
For the last two parameters:
as pre-treatment (=)
low evidence 30% (±)
clear evidence 60–70% (+)
□bone healing (✓)
Statistical analysis was also performed to assess the significance of the results.
Results
Demographic data
Based on inclusion/exclusion criteria, we evaluated 34 patients affected by osteoid osteoma (23 male and 11 female; mean ages 23 years) treated with radiofrequency ablation (RFA) or MRgFUS (respectively, 13 and 21 cases).
The intra-articular lesions (IA) were 13; 21 were extra-articular (EA) lesions.
Clinical data
All patients had histories of diurnal and nocturnal pain that was managed with NSAIDs.
The pre-treatment mean value of VAS was 7.8 (ranging from 8.5 to 7.0). At FU1, the VAS score was 0 for all patients, and this value was confirmed in all the following checks (FU2 and FU3).
Imaging data
All the results are summarized in Table 1.
At FU1 we noticed a remarkable reduction of all inflammatory phenomena; the bone marrow oedema had been significantly reduced, both in the IA and EA lesions: in fact 9 patients (69%) with an IA osteoma had a reduction of 60–70% of the oedema, while 4 patients (31%) had a complete resolution of this sign; 18 patients (86%) with an EA lesions had a reduction of 60–70% of the oedema, while 3 patients (14%) had a complete resolution of the oedema. We also found that the synovitis disappeared in 7 patients (53%) and was notably reduced in 6 patients (46%), while perilesional flogistics reaction was considerably reduced in 16 patients (76%) and disappeared in 5 patients (24%). At the FU2, we recorded a complete resolution of the bone marrow oedema and of the reactive phenomena in 95% of cases; only 2 patients (15%) with an IA osteoid osteoma still had signs of synovial inflammatory reaction.
The bone remodelling, better assessable with CT, started to be clearly evident only at 12 months: 4 patients (31%) of the IA group and 5 patients (24%) of the EA group showed a clear evidence of bone restructuring towards a bone healing. Nine and 16 patients (69% and 76%), respectively, showed, however, a clear evidence of bone remodelling.
The FU3 confirmed the resolution of all reactive phenomena and the restructuring of the bone was completed in 85–90% of cases both in IA and EA lesions. Only the 15% of patients still showed an incomplete restructuring of the bone after two years of follow-up.
The ring sign was the more difficult sign to assess because sometimes it was very slightly visible. However, it was present in all the cases of FU1. At the FU3 no evidence of ring sign was recorded.
Statistical analysis
We used the paired sample T test for evaluation of bone marrow oedema and flogistic reaction; we observed a statistically significant reduction of the oedema (p = 0.003) (mean pre-treatment value 3.07 and post-treatment value 0.77, standard deviation of 0.680 pre-treatment and 0.990 post-treatment).
Statistically significant reduction of flogistic reaction was also noted (p < 0.001) (mean pre-treatment value 1.61 pre- and post-treatment value 0.47, standard deviation of 1.077 pre-treatment and 0.844 post-treatment).
The Chi-square test showed the appearance of a statistically significant sclerosis after 1 year from treatment (p = 0.001; odd ratio 7.78).
The Kaplan–Meier curves of the two treatment strategies (MRgFUS and RFA) were evaluated, and the logarithmic rank showed that there is no difference between the type of treatments performed.
Discussion
Osteoid osteoma is a benign tumour that is nowadays treated with minimally invasive techniques (mainly RFA and MRgFUS). A curative aim is required in order to kill the painful symptoms that compromise the daily activities of young patients.
Since we did not want to demonstrate the efficacy of the procedures, we have included only patients successfully treated in our unit, regardless of the type of treatment performed, both RFA and MRgFUS: in fact both the treatments are heat-based procedure of thermal ablation and as previously demonstrated the choice of the most appropriate procedure to treat each lesion is based on the accessibility of the nidus [10]. All the studies carried out so far have focused mainly on the evaluation of the effectiveness of the procedures, considering first of all the clinical outcome [21, 22]. Clinical results in fact are the first data that correlate with the outcome of the treatment, since as shown in the literature [15] already the disappearance of pain some days after treatment can be indicative of therapeutic success.
To our knowledge, however, imaging features of the post-procedural evolution of these procedures have not yet been systematically codified [15, 23]. Our study was intended to investigate and summarize some particular imaging findings that characterize the imaging at the diagnosis and that change along the follow-up after treatment. Moreover, we have looked for signs that are clearly visible on a “basic” imaging (non-contrast-enhanced T1w and T2w MRI sequences, also with fat saturation and CT) because as in the daily practice, patients suffering for OO reach the reference hospital for treatment coming from different diagnostic centres with an imaging, already performed, that usually is enough for diagnosis and for planning treatment.
So, in order to avoid repeating imaging (as also contrast administration), in our study we have identified and reported four easy-to-find signs that prove the success of the procedure and we have schematically summarized: (I) disappearance of bone marrow oedema around the lesion, (II) the reduction of perilesional flogistic/synovial reaction, (III) the restructuring of the bone and (IV) the “ring sign”.
The first two, in particular, suggest the absence of biological activity within the treated lesion: in fact bone oedema and perilesional flogistic/synovial reaction stand for the presence of flogistic environment that typically comes with an active osteoid osteoma. The successful ablation of the nidus destroys the flogistic stimulus and with him, the first two signs. According to our experience, at 6 months, even if there is globally a remarkable reduction of these flogistic signs with their disappearance up to the 53% of cases (disappearance of the synovitis in the IA lesions), it is still possible to find these sign on the follow-up MRI (however reduced compared with the preoperative scans, p < 0.001). On the other hand, because in no one patient these features were found as pre-treatment, the persistence of a comparable entity of bone oedema/flogistic reaction is strongly suggestive for an uncomplete treatment. One year after treatment, only in case of IA lesions is still possible to find flogistic reaction, however slight, also in patient successfully treated.
The restructuring the bone defines the effectiveness of the procedures as also their mini-invasiveness that does not alter the structure of the bone allowing bone healing. Our experience, however, showed that it is needed to wait 12 months after treatment to observe a clear evidence of in a statistically significant percentage of patients (from 43% of IA lesions to 82% EA lesions). Bone remodelling is almost complete after 2 years (85–86% of cases) (p = 0.001).
Finally, the ring sign: it depicts the ablated area. The central necrotic area of the ring is the result of the ablation, and the surrounding zone is the result of a sub-lethal thermal injury.
Therefore, identifying the ring sign around the lesion at the first follow-up means that there was a thermal insult within the pathological tissue. This sign should disappear to the subsequent controls when the treated tissues return intact. So, in our experience, the ring sign is present 6 months after treatment and 1 year after the procedures there is only a low evidence.
About the type of instrumental method to be used, we assessed that MRI is useful from the beginning because of its ability to identify all the reactive phenomena (bone marrow oedema, synovitis and perilesional reaction), while the use of CT scan can be postponed to 1 year’s control avoiding exposing young patients to excessive radiations. CT scan is useful to identify the bone remodelling up to the bone healing of the skeletal segment that we can found in the long-term follow-up.
This study has some limitations. First the arbitrary choice of the four findings to investigate: we chose the reactive phenomena (I and II) because they are usually present in an active and painful lesion. The other two signs were chosen because they indicate the healing of the bone segment (III) and the effectiveness of the ablation (IV). However, the evaluation of the follow-up using these signs has a practical advantage in the clinical practice: only not contrast-enhanced sequences were used (T2w with fat saturation sequences and T1w sequences are enough to evaluate the outcome of a treatment). CT is also used, but the exposure is limited to the area of interest. Another limit is represented by the date of follow-up that is not fixed but is intended as a period (from 4 to 6, from 9 to 12 and from 18 to 24 months): this limitation is, however, difficult to overcome because patients successfully treated and so without pain, have usually a poor compliance to undergone to diagnostic examinations for follow-up. Finally it lacks a differentiation between patient treated with RFA and those treated with MRgFUS: this choice was made to avoid dispersing the data; as the sample of patients followed will increase, a dedicated study will be performed.
In conclusion, even if the follow-up of the minimally invasive treatment of osteoid osteoma is mainly clinical, the imaging follow-up can be useful in case of persistence of pain or clinical suspicion of recurrence. The best protocol to assess the effectiveness of the procedure should include an MRI within the first 12 months to assess the reduction and/or the disappearance of the flogistic reaction the always comes with the lesion; after 12 months a CT scan of the skeletal segment could be very useful to assess the bone remodelling and the bone healing with the disappearance of the lesion treated.
References
Karagöz E, Özel D, Özkan F, Özel BD, Özer Ö, Coşkun ZÜ (2016) Effectiveness of computed tomography guided percutaneous radiofrequency ablation therapy for osteoid osteoma: initial results and review of the literature. Pol J Radiol 81:295–300. https://doi.org/10.12659/PJR.896475
Von Engelhardt LV, El Tabbakh MR, Engers R, Lahner M, Jerosch J (2016) Hip arthroscopy for excision of osteoid osteoma and for the application of a collagen cartilage implant: case report in a professional athlete, and literature review. Technol Health Care 24(6):957–964. https://doi.org/10.3233/THC-161223
Mutlu H, Yaldiz H, Mutlu S, Cetinkaya E, Cepni K, Armagan A et al (2014) Atypical location of an osteoid osteoma with atypical anterior knee pain. Int J Surg Case Rep 5(11):873–876. https://doi.org/10.1016/j.ijscr.2014.10.015
Hamada T, Matsubara H, Kimura H, Aikawa T, Yoshida Y, Tsuchiya H (2016) Intra-articular osteoid osteoma of the calcaneus: a case report and review. Radiol Case Rep 11(3):212–216. https://doi.org/10.1016/j.radcr.2016.05.008
Gaeta M, Minutoli F, Pandolfo I, Vinci S, D’Andrea L, Blandino A (2004) Magnetic resonance imaging findings of osteoid osteoma of the proximal femur. Eur Radiol 14(9):1582–1589. https://doi.org/10.1007/s00330-004-2293-5
Chai JW, Hong SH, Choi J-Y, Koh YH, Lee JW, Choi J-A et al (2010) Radiologic diagnosis of osteoid osteoma: from simple to challenging findings. Radio Graph 30(3):737–749. https://doi.org/10.1148/rg.303095120
Song MH, Yoo WJ, Cho TJ, Chung CY, Park MS, Cheon JE et al (2015) Clinical and radiological features and skeletal sequelae in childhood intra-/juxta-articular versus extra-articular osteoid osteoma. BMC Musculoskelet Disord 16(1):1–6. https://doi.org/10.1186/s12891-015-0456-y
Rosenthal DI, Hornicek FJ, Torriani M, Gebhardt MC, Mankin HJ (2003) Radiology osteoid osteoma: percutaneous treatment with radiofrequency energy. Radiology 2:171–175. https://doi.org/10.1148/radiol.2291021053
Arrigoni F, Napoli A, Bazzocchi A, Zugaro L, Scipione R, Bruno F et al (2019) Magnetic-resonance-guided focused ultrasound treatment of non-spinal osteoid osteoma in children: multicentre experience. Pediatr Radiol 49:1209–1216. https://doi.org/10.1007/s00247-019-04426-0
Masciocchi C, Zugaro L, Arrigoni F, Gravina GL, Mariani S, La Marra A et al (2016) Radiofrequency ablation versus magnetic resonance guided focused ultrasound surgery for minimally invasive treatment of osteoid osteoma: a propensity score matching study. Eur Radiol 26:2472–2481. https://doi.org/10.1007/s00330-015-4111-7
Hoffmann RT, Jakobs TF, Kubisch CH, Trumm CG, Weber C, Duerr HR et al (2010) Radiofrequency ablation in the treatment of osteoid osteoma-5-year experience. Eur J Radiol 73(2):374–379. https://doi.org/10.1016/j.ejrad.2008.11.018
Temple MJ, Waspe AC, Amaral JG, Napoli A, LeBlang S, Ghanouni P et al (2016) Establishing a clinical service for the treatment of osteoid osteoma using magnetic resonance-guided focused ultrasound: overview and guidelines. J Ther Ultrasound 4(1):1–11. https://doi.org/10.1186/s40349-016-0059-6
Arrigoni F, Bruno F, Palumbo P, Zugaro L, Zoccali C, Barile A et al (2019) Magnetic resonance-guided focused ultrasound surgery treatment of non-spinal intra-articular osteoblastoma: feasibility, safety, and outcomes in a single-center retrospective analysis. Int J Hyperth 36(1):768–775. https://doi.org/10.1080/02656736.2019.1639833
Napoli A, Bazzocchi A, Scipione R, Anzidei M, Saba L, Cozzi AD et al (2017) Noninvasive therapy for osteoid osteoma: a prospective developmental study with MR imaging-guided high-intensity focused ultrasound. Radiology 285(1):186–196
Rehnitz C, Sprengel SD, Lehner B, Ludwig K, Omlor G, Merle C et al (2012) CT-guided radiofrequency ablaton of osteoid osteoma: correlation of clinical outcome and imaging features. Diagn Interv Radiol 2013(19):330–339. https://doi.org/10.5152/dir.2013.096
Albisinni U, Facchini G, Spinnato P, Gasbarrini A, Bazzocchi A (2017) Spinal osteoid osteoma: efficacy and safety of radiofrequency ablation. Skeletal Radiol 46:1087–1094. https://doi.org/10.1007/s00256-017-2662-1
Lassalle L, Campagna R, Corcos G, Babinet A, Larousserie F (2017) Therapeutic outcome of CT-guided radiofrequency ablation in patients with osteoid osteoma. Skeletal Radiol 46:949–956. https://doi.org/10.1007/s00256-017-2658-x
Esteban H, Martel J, Bueno A, Kassarjian A, Rodriguez G (2018) Percutaneous radiofrequency ablation in osteoid ostema: tips and tricks in special scenarios. Eur J Radiol 102(February):169–175. https://doi.org/10.1016/j.ejrad.2018.03.008
Erba G, Şendur HN, Kiliç HK, Cindil E, Öner AY, Tokgöz N (2019) Treatment-related alterations of imaging findings in osteoid osteoma after percutaneous radiofrequency ablation. Skeletal Radiol 48(11):1697–1703
Masciocchi C, Arrigoni F, La Marra A, Mariani S, Zugaro L, Barile A (2016) Treatment of focal benign lesions of the bone: MRgFUS and RFA. Br J Radiol 89(1066):20150356. https://doi.org/10.1259/bjr.20150356
Weber MA, Sprengel SD, Omlor GW, Lehner B, Wiedenhöfer B, Kauczor HU et al (2015) Clinical long-term outcome, technical success, and cost analysis of radiofrequency ablation for the treatment of osteoblastomas and spinal osteoid osteomas in comparison to open surgical resection. Skeletal Radiol 44(7):981–993. https://doi.org/10.1007/s00256-015-2139-z
Abboud S, Kosmas C, Novak R, Robbin M (2016) Long-term clinical outcomes of dual-cycle radiofrequency ablation technique for treatment of osteoid osteoma. Skeletal Radiol 45(5):599–606. https://doi.org/10.1007/s00256-015-2321-3
Wu H, Lu C, Chen M (2017) Evaluation of minimally invasive laser ablation in children with osteoid osteoma. Oncol Lett 13(1):155–158. https://doi.org/10.3892/ol.2016.5417
Acknowledgments
Authors wish to thank Angela Martella for translating the manuscript.
Funding
This work has not been supported by any funding.
Author information
Authors and Affiliations
Corresponding author
Ethics declarations
Conflict of interest
All authors declare that they have no conflict of interest.
Ethical standards
All the clinical procedures described in the study were performed in accordance with the Helsinki declaration and patients signed an informed consent.
Informed consent
This article is a retrospective study. It is based on results of standardized therapeutic treatments (non-experimental). All patients signed a informed consent.
Additional information
Publisher's Note
Springer Nature remains neutral with regard to jurisdictional claims in published maps and institutional affiliations.
Rights and permissions
About this article

Cite this article
Arrigoni, F., Bruno, F., Gianneramo, C. et al. Evolution of the imaging features of osteoid osteoma treated with RFA or MRgFUS during a long-term follow-up: a pictorial review with clinical correlations. Radiol med 125, 578–584 (2020). https://doi.org/10.1007/s11547-020-01134-w
Received:
Accepted:
Published:
Issue Date:
DOI: https://doi.org/10.1007/s11547-020-01134-w