
Abstract
Background: Pregnancy is associated with considerable changes in the physiological, anatomical and biochemical attributes in women. These may alter the exposure to xenobiotics between pregnant and non-pregnant women who receive similar doses, with implications for different susceptibility to environmental pollutants or therapeutic agents. Physiologically based pharmacokinetic (PBPK) models together with in vitro in vivo extrapolation (IVIVE) of absorption, distribution, metabolism and excretion (ADME) characteristics may capture the likely changes. However, such models require comprehensive information on the longitudinal variations of PBPK parameter values; a set of data that are as yet not available from a singular source.
Aim: The aim of this article was to collect, integrate and analyse the available time-variant parameters that are needed for the PBPK modelling of xenobiotic kinetics in a healthy pregnant population.
Methods: A structured literature search was carried out on anatomical, physiological and biochemical parameters likely to change in pregnancy and alter the kinetics of xenobiotics. Collated data were carefully assessed, integrated and analysed for trends with gestational age. Algorithms were generated to describe the changes in parameter values with gestational age. These included changes in maternal weight, the individual organ volumes and blood flows, glomerular filtration rates, and some drug-metabolising enzyme activities.
Results: Articles were identified using relevant keywords, quality appraised and data were extracted by two investigators. Some parameters showed no change with gestational age and for others robust data were not available. However, for many parameters significant changes were reported during the course of pregnancy, e.g. cardiac output, protein binding and expression/activity of metabolizing enzymes. The trend for time-variant parameters was not consistent (with respect to direction and mono-tonicity). Hence, various mathematical algorithms were needed to describe individual parameter values.
Conclusion: Despite the limitations identified in the availability of some values, the collected data presented in this paper provide a potentially useful singular resource for key parameters needed for PBPK modelling in pregnancy. This facilitates the risk assessment of environmental chemicals and therapeutic drug dose adjustments in the pregnant population.
Introduction
Pregnancy is associated with a myriad of physiological, anatomical and biochemical changes that return to baseline at various rates in the postpartum period. The causative mechanism of these changes is poorly understood and most of them are believed to be regulated under hormonal control. A number of these changes have a direct effect on the kinetics of xenobiotics. These include alterations on the level of cytochrome P450 (CYP) enzyme activity, volume of plasma, cardiac output and protein binding.[1–4] Many of these changes begin early in pregnancy, reach their peak during the second trimester, and then remain relatively constant until delivery.[5–8] The increase in total body volume is accompanied by retention of 900–1000 mEq of sodium and 6–8 L of water which is distributed among the fetus, amniotic fluid, and maternal extracellular and intracellular spaces.[9,10] The impact of these changes on kinetics depends on both the drug and the route of administration. These changes are not uniform for various parameters and their effects on each xenobiotic or drug may differ depending on absorption, distribution, metabolism and excretion (ADME) characteristics. Hence, extrapolation of dose-exposure relationship from pre-pregnant to pregnant women can lead to under- or over-estimation of exposure, with implications for risk assessment as well as therapeutic dose adjustment.
There is evidence that women continue to self-medicate during pregnancy with prescription, over-the-counter and herbal medications.[11,12] Those with chronic conditions, such as depression, asthma and hypertension, continue to take their regular prescription drugs, and some may develop acute illnesses or complications that require medication.[13–16] In such patients, care must be taken to select the safest drug from the necessary class of medication as continuous administration of these drugs at the pre-pregnant dose can adversely affect the fetus. Physiological alterations in pregnancy are considered likely to alter the ADME of drugs, and may have implications for medication dosage. The evidence base for these alterations and their implications for prescribed drugs is growing, with numerous published studies focusing on specific aspects of physiology during pregnancy or on certain groups of medication, as well as a number of review papers presenting composite results, evaluating and summarizing evidence.[2,4,17,18]
With regards to therapeutic agents, the US FDA guidance has established a basic framework for designing and conducting pharmacokinetic/pharmacodynamic studies in pregnant women.[19] It has advocated the development of pharmacokinetic models that account for likely changes in metabolism, blood flow and excretion with gestational age and considered optimized study design with respect to duration and statistical power.
Application of physiologically based pharmacokinetic (PBPK) models in drug development and toxicology has recently received much attention.[20–22] Such models map the complex mechanistic drug movements in the body to a physiologically realistic compartmental structure, and allow the known physiological and biochemical changes to be incorporated into a meaningful model to predict ADME. The usefulness of this approach can be further enhanced by the incorporation of individual variability arising from the differences in physiology, biochemistry, genetics and pathophysiological conditions.[22] Furthermore, incorporating the time vector of any physiological change that occurs during advancing pregnancy increases the applicability of the PBPK model.
There are a number of PBPK models that have investigated the effect of human pregnancy on drug kinetics.[23–29] However, to the best of our knowledge, these models do not consider all the essential elements, most probably due to their narrow focus on specific compounds or a specific stage of pregnancy. For example, none of the models included the longitudinal changes in metabolizing enzymes during gestation. Neither do they consider the inter-individual variability of PBPK parameters. Hence, these models cannot account for within-individual variability with gestational age or between-individual variability in pharmacokinetics. In addition, many parameters related to certain organs are obtained from selected reports rather than a systematic review of all available data.
Recently, there has been an increasing interest in this population and much more data are becoming available on the changes of relevant parameters throughout pregnancy. Therefore, it seems timely to integrate all available data with the aim of facilitating the applicability of PBPK models in pregnancy and improving their performance.
The objectives of this study were to collate essential time-variant anatomical, physiological and biological parameter values needed for PBPK models defining pregnancy. These data were analysed in order to formulate algorithms which describe the average changes in parameter values and their variability with gestational age.
Methods
Data Sources
A structured literature search was carried out using MEDLINE on all anatomical, physiological and biological parameters likely to change during pregnancy. The search strategy was aimed to identify observational cohort studies in which the required parameters were longitudinally examined during pregnancy. Data from the control arm of case-control studies and randomized controlled trials were also considered for inclusion. For each parameter, a separate search was conducted, using the key word ‘pregnant’ plus the parameter of interest, for example ‘blood flow’, ‘plasma volume’, ‘haematocrit’, ‘glomerular filtration’, etc. No language or date restriction was applied but article titles and abstracts were screened to maintain the focus of the search on human, singleton, low-risk, normal pregnancies. Because parameters may change during birth, studies of women during delivery were excluded. A manual search of reference lists from selected articles and contact with experts in the field complemented the data collection process. Two researchers quality appraised each study, extracted and entered the data into a Microsoft Excel® spreadsheet independently and this was subsequently double-checked by a third researcher prior to data modelling.
Inclusion Criteria
Data inclusion criteria were (i) singleton pregnancy; (ii) adult healthy women with no underlying conditions that are known to affect the parameters; and (iii) studies on dominantly Caucasian populations (in case of mixed population studies, the Caucasian population comprised at least 80% of the overall population).
Combining Data from Different Studies
When a tissue size was expressed by weight, the corresponding volume was calculated using tissue density. In the majority of cases only mean values (and variability) stratified for gestational age groups were available. The overall mean parameter value, Ẋ, at a particular gestational age, from different studies was combined using equation 1:

where nj is the number of subjects in the jth study and xj is the mean value from that study. The overall sum of squares was calculated according to equation 2:

where SDj is the standard deviation from the jth study and N is the number of subjects in all studies (N = equation 3:

In turn, geometric mean or median values (assuming log-normal distributions) were calculated using equations 4–6, as follows:
To describe σ (sigma, which is analogous to the SD but in a log-scale), the following equation can be used:[30]

where the coefficient of variation (CV) is calculated by dividing reported SD by reported mean value, which are in normal scale. A geometrical SD (GSD) can be defined as:

Once σ has been determined, the median can be calculated by determining the exponent of μ [mean of ln(x) values] after using the following equation:[31]

where the mean value for samples is taken directly from the report. It should be noted that the exponent of μ also represents geometric mean (i.e. median = eμ). The CV was used to add variability around the parameter mean and calculated as follows (equation 7):

where residual MS is the mean residual sum of squares and Ẋ is the weighted mean. In the absence of usable data from the literature, the CV values were assumed to be the same as those for a healthy pre-pregnant population.
Data Analysis
Before data analysis, when a parameter was reported in different units, these units were converted to a standard unit of measurement. Data analysis was performed using Microsoft Excel® 2007. In general, polynomial equations have been used to describe the longitudinal changes in parameters during pregnancy. Polynomial equations have been used to characterize age-related changes in body and organ weights from birth to adolescence in humans.[32] Moreover, only polynomials were considered to develop the PBPK model for calculation of organ weights based on sex and total body weight, and to describe human postnatal growth from birth through to adulthood for normal[27] and obese individuals of different ethnicities,[33] and to relate fat-free mass (FFM) to fat mass that considers demographic covariates.[34]
The choice of the polynomial degree to describe the physiological changes during pregnancy was dependant on the nature of the data to be interpolated. The data can be described better by fitting and taking into account the impact of covariates. Since the evaluated data are from population rather than from individual means and the covariates were not always available from all studies, the selection of polynomial equations is sufficient for the purpose of describing the trend. If a higher order of polynomial equation does not improve the fitting (R2) and/or if it departed from the original data in comparison with a lower degree, then the lower one was chosen. Other options were considered where these were not adequately fitting using polynomial equations. An example of this is for fetal volume during pregnancy where the Gompertz equation was used because negative values were generated using polynomials.
Results
The amount of information varied considerably depending on the type of parameters, so that while an abundance of information was available for gestational weight gain, information on compartmental blood flow, for instance, was very limited. Table I summarizes the results of the meta-analysis, along with regression equations and correlation coefficients.


Anatomical, physiological and biological parameter values and regression equations needed for physiology-based pharmacokinetic models defining pregnancy, based on meta-analysis of the published data
Maternal Age Distribution at Conception
Data on the maternal age distribution of pregnancy were taken from the Office for National Statistics (ONS), Conception Statistics for a total of 887 900 singleton pregnancy in England and Wales for the year 2008[187] and examined for frequencies at each age range. Age distribution, which should be used for Monte-Carlo sampling when population variability is considered in PBPK models, is given in figure 1.

Maternal age distribution.
Gestational Age Distribution at Birth
In this article, gestational age refers to the full-term gestational age, which ranges from 37 to 42 weeks of pregnancy counted from the first day of the last menstrual period, according to WHO classification.[188,189] In a group of singleton pregnancies (n = 12 816 Caucasian British women), the gestational age at delivery ranged between 23 and 43 weeks, with a median of 40 weeks.[190] This is similar to the result obtained for a Swedish population (n = 383 484 singleton, non-caesarean birth), giving a mean ± SD of 40.14 ± 1.86 weeks and a median ± SD of 40.29 ± 1.86 weeks.[191] Data on gestational age distribution for a total of 4 710 209 live-born singleton births were obtained from the UK National Health Service Maternity Statistics.[192] Figure 2 shows the data and distribution of full-length gestational age at delivery.

Gestational age distribution.
Gestational Weight Gain
The total amount of weight gained in normal-term pregnancies varies considerably among women. In its latest guidelines (2009), the Institute of Medicine gave a recommended pregnancy weight gain range for normal weight women as wide as from 10.0 to 16.7 kg for a singleton pregnancy.[193] Generally, obtaining an appropriate baseline is a major confounding factor in studies evaluating weight changes during pregnancy. Weight gain in multiple pregnancies,[193] adolescent pregnancies,[193] pre-eclampsia and hypertensive pregnant women[194] were found to be higher than that in normal singleton pregnancy and, thus, such populations were excluded from this review. Underweight and obese pregnant data were excluded from this review as their weight gain pattern during pregnancy is also different from weight gain in normal pregnant women.[195–197] During normal pregnancy, the gestational weight gain is generally higher in the second and third trimester and can vary depending on maternal ethnicity and age.[193] Because women tend to retain weight at the postpartum period,[35,48] it was not deemed appropriate to use postpartum values as a baseline for pre-pregnancy weight estimation. The gestational weight gain is therefore restricted to a normal weight, healthy adult Caucasian pregnant population with uncomplicated singleton pregnancies. The data are shown in table 1 of the Supplemental Digital Content (SDC), http://links.adisonline.com/CPZ/A3.
Meta-analysis of collected data indicated an increase in the mean total body weight (in kg) [mean ± SD (CV)] from 61.1 ± 7.5 (15%) in pre-pregnancy state to 65.0 ± 11 (17%), 71 ± 10 (14%) and 75.2 ± 8.4 (11%) by the end of the first, second and third trimesters, respectively. The collated data show an addition of about 14 ± 5.1 kg (36%) weight by the end of pregnancy. These changes can be described using equation 8.

where GA is the gestational age in weeks. A figure of mean weight gain with the SD at different gestational weeks is given in the SDC.
Total Body Fat
Estimates of body fat mass gained during human pregnancy are necessary to assess the distribution of lipophilic compounds. Most of the total body fat mass was deposited during the second trimester, with little change taking place in the first and third trimesters.[36] The mechanisms by which maternal fat mass is regulated during pregnancy is poorly understood; however, leptin has been suggested as an important regulator of body fat mass during pregnancy.[198]
Fat gain accounts for about 55.5 ± 20% of total weight gain.[199] It has been reported that postpartum mothers still retained an average of 2.2 kg fat mass over the mean pre-pregnancy value.[36] Thus, studies using postpartum values as control were excluded from the analysis. To avoid the impact of other methodological variables, further refinement of the data was done by only selecting studies that used multi-compartment models to determine fat mass and FFM during gestation as these models are reported to be the gold standard for determining body composition during pregnancy.[200] These data are given in SDC tables 2 and 3. Analysis of the available data shows that:
-
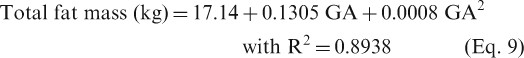
The total fat mass in kg [mean ± SD (CV)] increases from 17.14 ± 6.6 (39%) pre-pregnancy value to 19.09 ± 6.7 (35%), 19.80 ± 7.5 (38%) and 22.6 ± 7.0 (31%) at the gestational weeks 13, 25 and 37 of pregnancy, respectively.
-
The total FFM in kg [mean ± SD (CV)] shows no change from 44.5 ± 5.5 (12%) pre-pregnancy value to 44.8 ± 5.0 (11%), 48.59 ± 6.2 (13%) and 50.68 ± 6.8 (12%) at 12, 25 and 37 weeks of gestation. The following equations can be used to describe fat mass (equation 9) and FFM (equation 10) during pregnancy:


The values 17.14 and 44.5 represent the baseline values of total fat mass and FFM (in kg), respectively, for pre-pregnant women. The mean density of FFM was determined to be 1.099 g/cm3 at week 14 and 1.089 g/cm3 at week 37.[201] At term, the mean FFM density was determined to range from 1.0895 to 1.0850 g/cm3 for non-oedematous pregnant women and 1.0830 to 1.0785 g/cm3 if the women developed generalized oedema.[202] Such changes in density can affect the total FFM density of pregnant women, even if they have the same pre-pregnancy FFM; however, the accuracy of the method used is still uncertain.[200] Plots of fat and FFM gain at different gestational weeks are given in the SDC.
Total Body Water
Total body water increases gradually with gestational age but with great inter-individual variability. This increase in total body water is important in expanding the plasma volume to fill the increased vascular bed that occurs during normal pregnancy.[203] Studies that reported total body water during normal pregnancy are listed in tables 4 and 5 of the SDC. Data from pregnant women with generalized oedema were excluded from this evaluation.
Meta-analysis of the available data shows that the mean ± SD (CV) total body water (L) increases from 31.67 ± 4.6 (15%) before pregnancy to 35.22 ± 1.65 (5%), 40.14 ± 7.55 (19%) and 46.0 ± 5.5 (13%) at 12, 25 and 40 weeks of pregnancy, respectively.
Extracellular water (L) increases slightly from the pre-pregnancy value of 11.86 ± 2.0 (17%) to 12.48 ± 2.44 (20%), 13 ± 2.0 (14%), 14.59 ± 3.5 (24%) and 14.81 ± 3.2 (21%) at 12, 20, 35 and 38 weeks of pregnancy, respectively.
During pregnancy, intracellular water (L) increases from 19.81 ± 2.1 (11%) before pregnancy to 23.3 ± 5.2 (21%), 28.6 ± 4.7 (16%), 27.63 ± 6.4 (20%) and 29.13 ± 3.6 (11%) at 12, 22, 30 and 38 weeks of gestation, respectively. The following equations were derived to describe the change in total body water (equation 11), extracellular water (equation 12) and intracellular water (equation 13) during pregnancy:


Plots of water gain at different gestational weeks are given in the SDC.
Cardiovascular System
Several significant cardiovascular changes occur during the course of pregnancy, including an increase in cardiac output and plasma volume, and a reduction in vascular resistance in order to meet the increasing metabolic demands of the mother and fetus and to tolerate the acute blood loss that occurs with childbirth. These changes are believed to be under maternal hormonal control, including progesterone, aldosterone, estradiol and renin.[8,68,204] The interaction mechanisms of these changes are complex as these adaptations occur simultaneously, most of them begin during early pregnancy, and are critical at term. The unique feature associated with pregnancy is the increasing rise in cardiac output parallel to a continuous increase of blood volume and vasodilatation. The mean ± SD systemic vascular resistance (dyne · cm/sec5) decreases from a pre-pregnancy value of 1461 ± 283 to 1124 ± 235, 967 ± 222, and 1012 ± 248 during the first, second and third trimesters, respectively.[5,37,61,205] The stroke volume (in mL) increases from a pre-pregnancy value (mean ± SD) of 80 ± 11 to 92 ± 16, 92 ± 15, 97 ± 16 and 96 ± 16 at 8, 15, 24 and 38 weeks of pregnancy, respectively.[5,37] The heart rate increases by 10 to 20 beats/min starting at 5 weeks’ gestation and continuing until 32 weeks.[206,207] This change is mediated by estrogens via increasing myocardial α-receptors.[206,208,209]
Cardiac Output
Cardiac output refers to the volume of blood ejected from each ventricle of the heart per unit of time. Generally, all studies reported an increase in cardiac output during normal pregnancy with increasing gestational age. The most significant increase in cardiac output occurs during the first half of pregnancy, mainly as the result of an increase in stroke volume.[62] The increase of cardiac output in the second half of pregnancy was smaller and mostly attributable to an increased heart rate.[121] Whether the cardiac output increases steadily until term or there is a decrease in late pregnancy remains controversial. Some studies report a steady increase until term,[210–212] whereas others report a plateau or decrease in the third trimester.[62,63,213] This discrepancy can be explained by differences in study design and methodology, including maternal position during the examination.[64] Cardiac output is usually measured in a supine position; however, by positioning the mother in such a position in late pregnancy, the uterus seriously impedes venous return through the vena cava with a consequent fall in cardiac output.[214,215] Thus, many studies measured cardiac output by having the subjects lay on their left side.[37,206] Studies that did account for this phenomenon were included in this review. Information on cardiac output in pregnancy was gathered from a number of sources and only data measured by pulsed Doppler while subjects were lying on their left lateral decubitus position are included in this analysis (see table 6 in the SDC).
Data analysis shows that cardiac output (L/h) begins to rise gradually from early pregnancy [mean ± SD (CV)], with increases from the pre-pregnancy value of 301 ± 65 (22%) to 354 ± 76 (22%), 386 ± 75 (20%), 400 ± 79 (20%) and 391 ± 79 (20%) at 10, 20, 36 and 38 weeks of gestation, respectively. Cardiac output reaches the peak of 400 L/h between 30 and 38 gestational weeks with the highest value of about 424 ± 72 L/h at 32 weeks of pregnancy. These changes can be described by equation 14:

A plot of cardiac output changes at different gestational weeks is given in the SDC.
Of note, cardiac output increases by 50% during labour and by 60–80% during the 15th to 20th minutes after delivery and remains elevated for 48 hours after delivery. It returns gradually to pre-pregnancy values over 2–12 weeks.[216]
Plasma Volume
Expansion of the plasma volume begins as early as the fourth week of pregnancy, and increases 10–15% by 6–12 weeks of gestation with a continuous rises until parturition.[7,69–71] Collected studies are given in table 7 of the SDC. Data analysis shows that the average plasma volume (in L) [mean ± SD (CV)] increases from a pre-pregnancy value of 2.50 ± 0.40 (16%) to 2.67 ± 0.45 (17%), 3.55 ± 0.61 (17%), 3.74 ± 0.50 (13%), 3.67 ± 0.64 (17%) and 3.74 ± 0.54 (14%) at 12, 24, 30, 36 and 39 weeks of pregnancy, respectively. The total gain at term averages 1240 mL and results in a plasma volume range from 3200 to 4280 mL, which is 34–70% above that found in pre-pregnant women. Part of this variability can be teased out by accounting for many covariates such as parity[72] and multiple births.[73] A possible clinical consequence of this large variability is that it can result in different concentrations of biomarkers in plasma.[217]
For modelling purposes, equation 15 can be used to describe the longitudinal change in plasma volume during pregnancy:

A plot of plasma volume expansion at different gestational weeks is given in the SDC.
Red Blood Cell Volume
Plasma volume expansion is accompanied by a lesser increase in red blood cell (RBC) volume[218] to meet the needs of increased oxygen requirements for the mother and the fetus. The control of RBC production is complex and believed to be under the influence of erythropoietin hormone, which increases during pregnancy;[219–221] however, other factors such as progesterone (which counters the inhibition effect of estrogens on erythropoietin), folic acid and iron are of great significance.[222–225]
Collected data for RBC changes during pregnancy are listed in table 8 of the SDC. Data analysis shows that during pregnancy the volume of RBCs (in L) [mean ± SD (CV)] rises from a pre-pregnancy value of 1.49 ± 0.15 (10%) to 1.55 ± 0.15 (10%), 1.61 ± 0.11 (6%), 1.79 ± 0.11 (6%), 1.82 ± 0.10 (5%), 1.84 ± 0.26 (15%) and 1.90 ± 0.16 (9%) at 12, 20, 24, 33, 36 and 40 weeks of gestation, respectively. Equation 16 can be used to describe the change in RBCs during pregnancy:

A plot of RBC volumes at different gestational weeks is given in the SDC.
Haematocrit
The haematocrit value is the percentage of RBCs relative to plasma volume. In pre-pregnant women haematocrit ranges from 38% to 45%. Pregnant women show a moderate decrease in the haematocrit value during gestation, most probably due to the increasing volume of plasma (haemodilution of pregnancy) and the fact that the proportion of increased RBC volume is less than the increase in plasma volume during normal pregnancy. Collected values of haematocrit during pregnancy are given in table 9 of the SDC. Studies that mentioned iron supplements were excluded.
Meta-analysis of the collected data shows that the haematocrit value (%) [mean ± SD (CV)] falls from a pre-pregnancy value of 39.14 ± 2.51 (6.4%) to 38.10 ± 3.3 (8.7%), 37.30 ± 3 (8%), 36.2 ± 3.2 (9.1%), 36.08 ± 5.9 (16%), 35.4 ± 3.8 (11%), 34.98 ± 4.7 (13%) and 33.6 ± 3.0 (9%) at 10, 17, 23, 27, 30, 36 and 39 weeks of gestation, respectively. Equation 17 can be used to describe the change in haematocrit at any week during pregnancy:

A plot of haematocrit at different gestational weeks is given in the SDC.
Plasma Protein
Plasma protein levels decrease during pregnancy, which may alter the unbound plasma concentrations of drugs that are highly protein bound. Collected data for the total plasma protein concentration in plasma during pregnancy are listed in table 10 of the SDC. Data analysis showed that the total plasma protein concentration (g/L), mean ± SD (CV), decreases from 69.7 ± 4.4 (6%) pre-pregnancy to 68.8 ± 5.2 (8%), 65.1 ± 4.4 (7%), 63.3 ± 3.7 (6%), 63.7 ± 4.2 (7%) and 64.1 ± 3.1 g/L (5%) at 12, 23, 31, 34.8 and 38.4 weeks of gestation, respectively. Equation 18 can be used to describe the longitudinal decrease of plasma protein concentration during pregnancy:

A plot of total plasma protein at different gestational weeks is given in the SDC.
Albumin
Determination of the albumin level during pregnancy is of great importance. Most drugs are bound to different extents to this protein, affecting their disposition and effect. Reported changes in the maternal serum albumin concentration during pregnancy are given in table 11 of the SDC. Data analysis showed that the plasma albumin level (g/L), mean ± SD (CV), decreased during pregnancy from the pre-pregnancy value of 45.8 ± 3.5 (7.6%) to 43.3 ± 4.1 (9%), 41.4 ± 3.0 (7%), 38.5 ± 3.8 (10%), 37.56 ± 3.6 (10%) and 31.45 ± 5.3 (17%) at 10, 17, 30, 34 and 40 weeks of gestation, respectively. Equation 19 can be used to describe the albumin concentration during pregnancy:

A plot of plasma albumin at different gestational weeks is given in the SDC.
α1-Acid Glycoprotein
The plasma α1-acid glycoprotein (AAG) level (g/L), mean ± SD (CV), decreased during pregnancy from the pre-pregnancy value of 0.74 ± 0.17 (23%) to 0.73 ± 1.6 (22%), 0.58 ± 0.19 (33%), 0.60 ± 0.18 (30%), 0.61 ± 0.18 (30%) and 0.60 ± 0.16 (27%) at 10, 20, 30, 35 and 40 weeks of gestation, respectively. Equation 20 can be used to describe the change in AAG during pregnancy:

Collected data are given in table 12 of the SDC. A plot of the AAG level at different gestational weeks is given in the SDC.
Plasma Lipids
During pregnancy serum lipids increase gradually until term. In addition, phospholipids increased from a pre-pregnancy average of 229 ± 47 mg/dL in 24 women to 323 ± 42 mg/dL at 38 weeks of pregnancy.[98] Plasma total fatty acids are reported to increase during pregnancy; however, no clear trend was observed in erythrocyte fatty acids.[226]
Total plasma lipids (g/L) increased during pregnancy from 6.0 ± 1.0 (mean ± SD) at 9 gestational weeks to 8.7 ± 1.4, 9.5 ± 1.2 and 9.9 ± 1.4 at 25, 34 and 40 weeks of gestation, respectively. The level of plasma lipids then decreased to 6.0 ± 1.1 g/L at 4 weeks postpartum. The total triglyceride concentration increased from a pre-pregnancy value of 78.54 ± 39 mg/dL to 116 ± 53, 132 ± 65 and 228 ± 83 mg/dL during the first, second and third trimester, respectively. Total cholesterol has a similar trend; it increases from a pre-pregnancy value of 178 ± 38 mg/dL to 190 ± 36, 238 ± 46 and 273 ± 45 mg/dL during the first, second and third trimester, respectively.
Collected data regarding total plasma lipids, triglycerides and cholesterol are given in table 13 of the SDC. The following equations can be used to describe the change in total plasma lipids (equation 21), triglycerides (equation 22) and cholesterol (equation 23) during pregnancy:


Plots of plasma lipids, triglycerides and cholesterol levels at different gestational weeks are given in the SDC.
Gastrointestinal Tract
During pregnancy, the stomach is continuously displaced upward toward the left side of the diaphragm. In most pregnant women, this change leads to displacement of the intra-abdominal segment of the oesophagus into the thorax and can partly explain the gastric reflux that is experienced by many women during pregnancy.[227]
Gastric pH
No differences in basal gastric pH or basal and peak acid outputs have been observed during pregnancy when compared with pre-pregnancy values.[228,229] This is in contrast with a previous review, where an increase in gastric pH was reported.[230]
Gastric Emptying and Gastrointestinal Transit Time
Gastric emptying is not altered in healthy women during pregnancy. Using water[231] and disaccharide solution[232] as test liquids, no difference in gastric emptying was observed during pregnancy. After oral administration of paracetamol (acetaminophen) tablets,[231,233,234] no gastric emptying delay was observed in pregnant women in the first, second and third trimester compared with non-pregnant women. These results are supported by other techniques, where no change in gastric emptying could be demonstrated during pregnancy using serial gastric ultrasound examinations.[231,232] This information is in contrast to a previous review, which reported a reduction in gastric emptying during pregnancy.[230]
The orocaecal transit time (OCTT) did not change during the first trimester of pregnancy; however, in the third trimester OCTT was longer (100 min vs 70 min).[232] The observed prolongation in OCTT should be interpreted with caution as these women had mild dyspepsia during the first trimester and the observed range was 50.5–240 minutes during the third trimester and 40.5–240 minutes postpartum.
Bile
Using real-time ultrasonography, the fasting and residual volumes of the gallbladder were markedly increased during the second and third trimesters in 33 pregnant women compared with 11 pre-pregnant women. Gallbladder emptying has been reported to be incomplete and slower during pregnancy and the bile content tends to be more concentrated.[235]
Limited information is available on gallbladder emptying times. In eight healthy women, the gallbladder emptying rate constant was decreased from 0.041 ± 0.006 min-1 in pre-pregnant women to 0.022 ± 0.003 min-1 during pregnancy.[147] Fasting gallbladder volumes (mL) [mean ± SD (CV)] determined by ultrasonograph increased from a pre-pregnancy (n = 223) value of 20.17 ± 8.35 (41%) to 30.75 ± 12.75 (41%) in 195 pregnant women at the second trimester and remained relatively constant, with a value 29 ± 12.9 (45%) in 115 pregnant women to the end of pregnancy.[147,236–238] The gallbladder ejection fraction was lower in third trimester pregnant women (n = 18) than in postpartum women after delivery (n = 18) [60.56 ± 18.8% vs 77.48 ± 13.37%].[238]
Liver
Despite the fact that there are marked changes in liver function during pregnancy,[239–241] no evidence for significant change of liver morphology could be found. The liver receives about 70% of the blood from the portal veins and the other 30% is delivered at a greater velocity and higher pressure from the hepatic arteries.[242]
Liver Blood Flow
Despite numerous literature reports of marked changes in the cardiovascular system during pregnancy, little is known about changes in hepatic blood flow and the existing data are contradictory. Munnell and Taylor[243] did not find any difference between hepatic blood flows, measured using the Fick principle, with bromosulphthalein in 15 non-pregnant and 15 pregnant women: both were between 1400 and 1500 mL/min/1.73 m2. In another study, Robson et al.[83] calculated the apparent liver blood flow from indocyanine green clearance and found no significant changes during pregnancy. The apparent liver blood flow was found to account for 24% of cardiac output during pregnancy and increased to 37% after delivery. In contrast, Clapp et al.[244] used ultrasonography to estimate portal vein blood flow and found that it rose significantly during early and mid pregnancy (n = 6) at standing rest (580 ± 70 to 790 ± 120 mL/min) and was even higher at recumbent rest (from 660 ± 110 to 1090 ± 120 mL/min). The change in the portal vein blood flow during pregnancy reflects changes of similar magnitude in the overall splanchnic blood flow.[244] This is because approximately two-thirds of splanchnic blood flow is returned to the liver via the portal vein.[242]
Doppler velocimetry of the hepatic vein in healthy women showed a profound change in hepatic venous pulsatility during pregnancy and waveforms changed from their normal pulsatile nature to become flat with increasing gestation,[245,246] most probably due to a reduction of liver compliance or by a rise in intra-abdominal pressure.[246]
Based on the available information, and the knowledge that Doppler flow studies are subject to high variation between and within individuals,[247,248] it is difficult, at this stage, to describe the magnitude and significant of changes in maternal hepatic blood flow. The increase of the portal venous return can explain the increase of hepatic perfusion observed after 26 weeks of gestation as the hepatic arterial blood flow remains unchanged.[249] Collected values on hepatic blood flow are given in table 14 of the SDC.
Metabolic Enzyme Activity
Drug-metabolizing enzymes can be classified into two broad classes: cytochrome P450 (CYP) enzymes and non-CYP enzymes, including the uridine diphosphate glucuronosyltransferase (UGT) family. The activity of many of these enzymes has been shown to change during pregnancy and can affect drugs pharmacokinetics and therapy. For example, human pregnancy is associated with an increased metabolism of the CYP2D6 substrates metoprolol[250–252] and dextromethorphan.[102,253] CYP2D6 is a polymorphic gene and these polymorphisms can alter CYP2D6 activity regardless of pregnancy state.[254] However, although there are no data to support that the activity of these variants changes in a variant-specific manner with pregnancy, maternal CYP2D6 polymorphisms have been shown to have the potential to alter fetal exposure to paroxetine.[3]
While the causative mechanism of the observed changes of metabolizing enzymes has not been identified, accumulated data suggest that the protein expression of these enzymes are regulated by the higher level of hormones, mainly estradiol and progesterone, during pregnancy in a concentration-dependent manner.[2,4,255,256] The known regulatory pathways involve the aryl hydrocarbon, constitutive androstane, pregnane X and estrogen receptors. At this time, for ethical and clinical reasons, it is not practical or possible to get hepatocytes from healthy pregnant women or to run a clinical study for drugs where their safety in pregnancy is not known. Available studies therefore reported any change in CYP activity as a percentage in relation to the pre-pregnant population. Examples of changes in these enzymes and the controlling hormones are given in table II.

Observed impact of maternal changes in metabolizing enzymes on drug pharmacokinetics
Tracy et al.[102] has reported maternal changes in the activity of CYP1A2, CYP2D6 and CYP3A4 isoforms during pregnancy in 25 healthy women. The activity of CYP1A2 decreased from the pre-pregnancy level (100%) by 32.8 ± 22.8%, 48.1 ± 27% and 65.2 ± 15.3% during the first, second and third trimester, respectively. The activity of CYP2D6 increased from the pre-pregnancy level (100%) by 25.6 ± 58.3%, 34.8 ± 41.4% and 47.8 ± 24.7% during the first, second and third trimester, respectively. Similar to CYP2D6, the activity of CYP3A4 increased by 35%, 35% and 38% of the pre-pregnancy level during the first, second and third trimester, respectively. These changes were based on saliva clearance in case of caffeine and invariant urinary parent/metabolite ratios for dextromethorphan O- and N-demethylation, which are not pure markers of enzyme activity.[278,279] Values of CYP2D6 (dextromethorphan/dextrorphan ratio) and CYP3A4 (dextromethorphan/3-hydroxymorphinan) at each trimester were corrected for the changes in renal function at the corresponding trimester by dividing by renal function relative to that at pre-pregnancy. The reciprocal of the quotients is then used as an index of CYP2D6- and CYP3A4-mediated formation of dextrorphan and 3-hydroxymorphinan, respectively, and, hence, of the change in relative enzyme activity. For CYP1A2, no correction was applied since the half-life but not clearance can be detected from saliva. The percentage changes from the original uncorrected data are given in figure 3.

Percentage changes in cytochrome P450 enzymes from the original uncorrected data published by Tracy et al.[102] (no correction is needed for CYP1A2 activity). CYP = cytochrome P450.
The change in the activity of these enzymes (%) during pregnancy over the pre-pregnancy level, after correction of data from Tracy et al.,[102] can be described by using the following equations for CYP1A2 (equation 24), CYP2D6 (equation 25) and CYP3A4 (equation 26) isoforms:


These profiles are plotted in figure 4. The use of dextromethorphan N-demethylation as a marker of CYP3A4 activity leads to underestimate of the real increase in CYP3A4 activity during pregnancy. Use of a more sensitive probe such as midazolam indicated a higher increase in CYP3A4 at term.[38] A wide range of the increase in CYP3A4 activity (50–100%) at term has been reported.[280]

Relative change in studied cytochrome P450 enzymes over gestational age to non-pregnant women. CYP = cytochrome P450.
The activity of other enzymes such as CYP2A6, CYP2C9, UGT1A1, UGT1A4 and UGT2B7 have been reported to be higher during pregnancy than pre-pregnancy levels.[4,17,281] Others such as CYP2C19 and N-acetyltransferase 2 (NAT2) have been reported to be lower during pregnancy.[4,17,281] Although direction of the change (increase or decrease) in expression or activity is identified, little is known about the magnitude of these alterations.
Interestingly, levels of CYP2D6 and CYP1B1 expression in leukocytes were not significantly changed in 18 pregnant women between 35 and 37 weeks of gestation. A trend of increase was observed for CYP1B1 expression, but did not reach significance, most probably due to the observed very large variability between those individuals.[282] Well designed in vivo and in vitro studies are required in this area to quantify the magnitude of induction or suppression of metabolizing enzymes during pregnancy as such changes are likely to have toxicological and therapeutic implications.
Kidney
During normal healthy pregnancy, kidney dimensions increase by approximately 1 cm, and kidney volume increases by as much as 30%.[283,284] No information could be retrieved regarding any changes in kidney composition, enzyme and transporter expression during pregnancy in humans.
There are many physiological parameters that change during pregnancy in the urinary system such as the increasing renal blood supply, glomerular filtration rate (GFR) and creatinine clearance (CLCR). Filtration fraction was significantly reduced during early pregnancy but rose to a value equivalent to the pre-pregnancy level during the third trimester.[103] Systemic vasodilation occurs during early pregnancy, which is probably mediated by progesterone and relaxin.[285,286] The renal collecting system becomes more dilated as early as the first trimester, leading to hydroureteronephrosis and reverts to normal by 6 weeks postpartum.[287,288]
Glomerular Filtration Rate
The GFR, which describes the flow rate of filtered fluid through the nephrons, is one of the main physiological parameters of renal function. The GFR can be determined by injecting inulin into the plasma. Since inulin is neither reabsorbed nor secreted by the kidney after glomerular filtration, its rate of excretion is directly proportional to the rate of filtration of water and solutes across the glomerular filter. Available data show that GFR is raised throughout pregnancy and falls in late pregnancy. This increase in GFR with plasma volume expansion can increase the clearance of renally excreted drugs during pregnancy as in the case of atenolol.[289]
Available data for GFR measured by inulin clearance in healthy pregnant women are listed in table 15 of the SDC. A meta-analysis of the collected data showed an increase in the average level of GFR (mL/min) [mean ± SD (CV)], from 114 ± 28 (25%) in pre-pregnant women to 136 ± 32 (23%), 156 ± 26 (16%), 160 ± 26 (16%) and 156 ± 42 (27%) at 10, 16, 26 and 36 weeks of gestation, respectively. Equation 27 can be used to describe the changes in GFR during pregnancy:

A plot of GFR at different gestational weeks is given in the SDC.
Creatinine Clearance
CLCR is commonly used as a measure of GFR. However, because creatinine is also actively secreted by renal tubules to a small extent, CLCR may overestimate actual GFR. Available data for CLCR during pregnancy are listed in table 16 of the SDC. Data analysis showed an enhanced CLCR during pregnancy in line with inulin clearance. CLCR (mL/min) [mean ± SD (CV)], increases from a pre-pregnancy value of 98.3 ± 14.4 (15%) to 126 ± 20 (16%), 155 ± 28 (18%), 152 ± 39 (25%) and 124 ± 34 (28%) at 12, 26, 33 and 37 weeks of gestation, respectively. Equation 28 can be used to describe the change in CLCR during normal pregnancy:

A plot of CLCR at different gestational weeks is given in the SDC.
Serum Creatinine Level
The creatinine level in plasma is a balance between the kidney function and the production rate of creatinine from breakdown of creatine in muscle. As a consequence of increased CLCR during the gestational period, plasma levels of creatinine are lower than pre-pregnancy levels as muscle mass does not change substantially. Collected data for serum creatinine during pregnancy are presented in table 17 of the SDC. Serum creatinine (mL/dL) [mean ± SD (CV)], decreases from the pre-pregnancy level of 0.80 ± 0.11 (13%) to 0.69 ± 0.09 (13%), 0.64 ± 0.08 (12%), 0.67 ± 0.08 (12%) and 0.66 ± 0.14 (21%) at 18, 15, 34 and 37 weeks of gestation, respectively. Equation 29 can be used to describe the changes in serum creatinine during normal pregnancy:

A plot of the serum creatinine level at different gestational weeks is given in the SDC.
Effective Renal Plasma Flow
Effective renal plasma flow (ERPF) is measured via para-aminohippuric acid clearance. ERPF is an indirect measurement of effective renal blood flow (ERBF). Collected data for ERPF are given in table 18 of the SDC. Data analysis showed that the ERPF increased during early pregnancy but fell towards term. ERPF increased from a mean ± SD [L/h (CV)] pre-pregnancy value of 32.3 ± 6.4 (20%) to 44.5 ± 6.1 (14%), 48.4 ± 8.8 (18%), 47.8 ± 12.5 (26%) and 42.3 ± 11.2 (27%) at 7, 16, 26 and 36 weeks of gestation, respectively. It peaks during the second trimester around 20–25 weeks of gestation with a value of 50 L/h. Equation 30 can be used to describe the change in ERPF during pregnancy:

A plot of ERPF at different gestational weeks is given in the SDC.
Effective Renal Blood Flow
Limited data have been found on the change of the ERBF during pregnancy and in 1991 de Swiet[6] published a graph of average values showing an increase of the renal blood flow from about 47 L/h pre-pregnancy to 65, 77, 73, 69 and 54 L/h at 10, 15, 20, 30 and 40 weeks of gestation, respectively.
Here, in this analysis, the ERBF data for each gestational stage of pregnancy were calculated from ERPF assuming the same distribution as for ERPF and by correcting the data for mean haematocrit values at the respective gestational week using equation 31:

where Hct is haematocrit. Calculation of ERBF resulted in a trend similar to that observed for the ERPF, showing that ERBF (L/h) increases from a pre-pregnancy value, mean ± SD (CV), of 53.1 ± 10.4 (20%) to 72.7 ± 9.9 (14%), 77.9 ± 14.0 (18%), 75.1 ± 19.7 (26%) and 64.4 ± 17.1 (27%) at 7, 16, 26 and 36 weeks of gestation, respectively.
Although the ERBF can be calculated for modelling purposes by using ERPF and applying the corresponding haematocrit value to the gestational week, the following equation (equation 32) can also be used to describe the change in ERPF as a function of gestational age during pregnancy:

A plot of ERBF at different gestational weeks is given in the SDC.
Brain
Brain Mass
In a recent study, brain size was measured in nine healthy women using three-dimensional (3D) magnetic resonance imaging (MRI)[290] before and after delivery. Interestingly, the study found that brain size is reduced during pregnancy, with a maximal reduction at term, with the brain returning to its original size by 6 months after delivery (see table 19 of the SDC). The ventricular system measured included both lateral ventricles and the third ventricle but not the aqueduct or the fourth ventricle. The ventricular size showed a corresponding increase in size during pregnancy and a decrease in size after delivery. It is difficult at present to draw conclusions regarding these parameters based on this study, and more data are required to support this evidence.
Cerebral Blood Flow
During pregnancy, maternal cerebral blood flow (CBF), measured by the Fick principle with nitrous oxide,[291] was reported to be similar to that found in non-pregnant women. However, recently, Nevo et al.[117] assessed CBF by measuring blood flow volume in the internal carotid artery by dual-beam angle-independent digital Doppler ultrasound.[117] They found that CBF gradually increased during normal pregnancy (see table 20 of the SDC). The following equations can be used to describe the increase in cerebral (equation 33) and internal carotid artery (ICA) [equation 34] blood flow to the brain during pregnancy:


Plots of cerebral and ICA blood flow at different gestational weeks are given in the SDC.
Uterus
During pregnancy, the uterus undergoes substantial morphological and physiological changes to accommodate and protect the developing fetus. The weight of the uterus increases by 10–20 times during pregnancy. With no difference attributable to the stage of gestation, water and blood constitute 82.3% and 8% of the uterus weight.[118] More recently, following analysis of data obtained on 3D volume using uterine ultrasonography, it has been shown that the normal uterine volume varies with gravidity and parity.[292] Uterine volume (cm3) increased from 55.3 ± 25.7 (n = 91) to 66.5 ± 29.3 (n = 38) and 103.2 ± 33 (n = 81) in nulli-, primi- and multi-gravid women, respectively. On the other hand, uterine volume increased from 56.5 ± 26.3 (n = 112) to 81.7 ± 36 (n = 29) and 104.5 ± 32 (n = 69) cm3 in nulli-, primi- and multi-parous women, respectively. Unfortunately, these results were not given in terms of how the uterine volume changed along the pregnancy period, as reliable information could not be found about the menstrual cycle from most of the women in this study.
Uterine Mass
Pregnancy results in a 10-fold increase in uterine wet weight and this value increases with the number of previous pregnancies.[119,120] The mean wet mass of the non-pregnant uterus varies from about 44 g in the nullipara to over 110 g at parity 5 or over.[119] Hence, each successive pregnancy alters the baseline value for the pre-pregnancy or ‘normal’ state, leading to an increase in the baseline variability. A value of 80 g was reported for a reference adult female.[293] Blood constitutes about 8% of the weight of the uterus.[118] The available data are given in table 21 of the SDC, which shows a gap of information for uterine weight, particularly between 20 and 35 weeks of pregnancy; however, a weight gain are assumed during this period. Equation 35 best fits the available data:

A plot of uterine mass at different gestational weeks is given in the SDC.
Uterine Blood Flow
Previous studies have shown that the uterus receives about 0.5%[65] of cardiac output in pre-pregnant women. This increases during pregnancy to 3.5% at early pregnancy,[122] 4.2% at 13 weeks of gestation,[65] 5.6% at 22 weeks of pregnancy[121] and 12% at late pregnancy.[121,122] Collected data about uterine blood flow during pregnancy are presented in table 22 of the SDC. The observed variability between studies is due to differences in the methodology, mainly positioning and time, site of sampling, the techniques and analytical algorithm used, and the differences between individual characteristics. For the purpose of the current data analysis, when a study measured uterine blood flow at one side of the common trunk, the other side is assumed to be the same.
Data analysis showed that the mean ± SD (CV) uterine blood flow (L/h) increases from a pre-pregnancy value of 1.71 ± 0.85 (52%) to 17.5 ± 10 (57%), 28.5 ± 11.5 (40%), 44.4 ± 15 (33%) and 49.1 ± 14 (29%) at 10, 22, 30 and 38 weeks of gestation, respectively. Equation 36 can be used to describe the longitudinal increase of uterine blood flow during pregnancy:

A plot of uterine blood flow at different gestational weeks is given in the SDC.
Mammary Glands
Mass
As for many other parameters, the mass of mammary glands in non-pregnant women is very variable.[132,294–296] Variations in breast volume of up to 36% were found with weekly ultrasonic measurements during the course of seven normal menstrual cycles.[297] Such variability in the baseline makes it difficult to derive a common picture about the increase due to pregnancy from the cross-section studied. Using a computerized breast measurement technique, a wide range of 600–1840 mL has been reported for both breasts in eight women before conception.[132] The absolute increase (mean ± SD) was approximately 145 ± 69 mL of the breast volume (n = 13 breasts) at the end of pregnancy.[132] In another study, 10 of 11 left breasts measured for their volumes during pregnancy using a water displacement technique exhibited volume increases of between 60 and 480 mL, while the volume of one breast decreased by 20 mL.[133] It should be pointed out that this indirect measurement is not precise and is influenced by the individual’s position.[133] Data obtained using a water displacement technique were excluded in our analysis. Advanced techniques such as 3D scan and MRI are now available by which breast volume can be measured more accurately and precisely to guarantee objective and exact recording.[134,135] However, although these methods have been used to describe breast volume in non-pregnant women, no study could be found using these techniques in pregnancy. Collected data are given in table 23 of the SDC. Equation 37 can be used to describe the longitudinal increase of total volume of both breasts during pregnancy:

A plot of the volume of mammary glands at different gestational weeks is given in the SDC.
Blood Flow
Early studies measured mammary blood flow indirectly during pregnancy by means of skin temperature increase, as a measure of blood flow increases to the gland.[298] Burd et al.[299] found that breast skin temperature rose by 1°C from week 0 to 20 and was then stable until day 1 postpartum when it rose further. No estimate of changes in relative blood flow was made with this method.
Thoresen and Wesche[136] used a pulsed Doppler ultrasound velocity meter to measure blood velocities in the mammary branch of the right lateral thoracic artery in one subject throughout pregnancy and postpartum. They found that the blood velocity in the breast artery was 0.01 m/s before pregnancy and increased 2.5-fold from about 0.07 to 0.16 m/s at the 12th and 25th week of pregnancy and then remained steady until partus. The study also reported a dilation of breast arteries of up to 40% during pregnancy. Another study[300] demonstrated a continuous increase in the mean blood flow velocity in the breast with gestational age from a pre-pregnancy value of about 0.9 kHz to about 1.4 kHz at the 11th week and 2.5 kHz at the 28th week of gestation. Most of the increase was reported to be before the end of the second trimester of pregnancy, after which it tended towards a plateau until the pregnancy was almost full term. Unfortunately, the data were from one woman only but both breasts were studied. It should be noted that in both studies, only figures were given and the numbers given above were extracted (see the Methods section).
Although there is some evidence that mammary gland blood flow increases during pregnancy, no reliable data could be recovered that could conclude that the increase is a function of the gestational time. Consequently, most of our knowledge is based upon very limited data from case studies.
Other Changes
There are many changes in other maternal tissues during pregnancy and these are described below; most have little data describing them and many have no place in the current PBPK models.
Respiration
Pregnancy is associated with major mechanical and biochemical changes in the respiratory system.[301] The gradual enlargement of the uterus leads to changes in the abdominal size and shape, shifting the diaphragm up to 4 cm above its usual position.[302,303] The thoracic cage circumference increases by 5–7 cm during pregnancy. These changes begin at the end of the first trimester and continue throughout the rest of gestation, reaching a peak at week 37.[302,304] The most pronounced changes in the pregnant respiratory system include the increase in tidal volume from 450 to 700 mL, progressive decrease in respiratory reserve volume from 700 to 550 mL and decrease in the residual volume from 1000 to 800 mL. The inspiration capacity increases from 2500 mL in non-pregnant women to 2750 mL during pregnancy.[305,306] Inspiratory reserve volume, vital capacity and total lung capacity remain relatively unchanged.[302,306] Ventilation increased from a median of 9.4 L/min in the pre-pregnancy state to 10.5 L/min by 8–11 weeks and then slowly increased to 12.6 L/min in late pregnancy.[307] The hyperventilation of pregnancy has been attributed primarily to a progesterone effect.[303,308]
Oxygen consumption at rest varies between 249 and 331 mL/min in pregnant women and between 191 and 254 mL/min in non-pregnant women; it increases during pregnancy by 37 (range 30–40) mL/min[307,309–312] to meet the increasing metabolic demands during pregnancy. This increase in consumption is accounted for by (i) the needs of the fetus (12 mL/min); (ii) the placenta (4 mL/min); (iii) increased maternal cardiac output (7 mL/min); (iv) ventilation (2 mL/min); (v) the kidneys (7 mL/min); and (vi) extra breast and uterine tissue (5 mL/min).[313] The mean ± SD basal metabolic rate increases from pregravid value of 5430 ± 660 kJ/24 h to 5570 ± 640, 5740 ± 680, 6860 ± 680 and 7180 ± 1180 kJ/24 h at 14, 20, 32 and 35 weeks of gestation, respectively.[37,314]
Pulmonary vascular resistance significantly decreases (by about 34%) from 119 ± 47 dyne · cm/sec5 in pre-pregnant women to 78 ± 22 dyne · cm/sec5 during the 36th–38th week of pregnancy.[61] Mean pulmonary artery pressure is unchanged during pregnancy.[61]
Sex Hormones
In non-pregnant women, the ovary is the main source of sex hormones, progesterone and estrogens. Pregnancy is characterized by about 100-fold elevated levels of circulating estrogens and progesterone, which increase with advancing gestational age. By the end of the first trimester, the feto-placental unit becomes the major site of steroid hormone production and secretion during pregnancy. Progesterone protects the embryo by preventing hypoxia and by aiding the delivery of both oxygen and glucose. Between the 7th and 9th gestational week, progesterone production shifts from the corpus luteum to the placenta.[315,316] Estrogens levels also increase during pregnancy, including estradiol, estrone, estriol and estetrol.[315] Among these, only estradiol is reported here. The levels of pregnancy estradiol are significantly and strongly correlated in successive pregnancies of the same woman.[39,317] The increasing estradiol level during pregnancy has been linked to the many changes that occur throughout gestational time, such as in water and sodium retention resulting in an expanded plasma volume and up- and down-regulation of metabolizing enzymes. In addition to the effect of previous conception on sex hormone concentration, plasma levels of both progesterone and estradiol vary within each healthy woman, with the lowest level during the follicular phase and the highest level during the luteal phase.[315,318,319] For these reasons, it is difficult to justify which concentration should be used as a basal value; therefore, reported values from the three phases regardless of parity were pooled and the mean was selected as a baseline for the gestational time-dependent profile. Collected studies for estradiol (table 24) and progesterone (table 25) are given in the SDC.
The average estradiol level (ng/mL) [mean ± SD (CV)] increases during pregnancy from the pre-pregnancy value of 0.062 ± 0.058 (94%) to 0.51 ± 0.45 (90%), 3.45 ± 1.75 (52%), 6.60 ± 3.86 (59%), 5.86 ± 5.59 (95%), 11.0 ± 5.51 (50%), 17.2 ± 9.3 (54) and 15.7 ± 9.2 at 8, 16, 21, 24, 27, 36 and 39 gestational weeks, respectively.
Average progesterone level (ng/mL) [mean ± SD (CV)] increases during pregnancy from the pre-pregnancy value of 1.42 ± 3.34 (234%) to 24.63 ± 13.7 (53%), 39.66 ± 13.43 (34%), 84.72 ± 35.06 (41%), 89.83 ± 29.0 (32%), 142.7 ± 40 (28%) and 190.8 ± 47.3 (22%) at 8, 16, 24, 30, 33 and 38 gestational weeks, respectively.
The following equations can be used to describe the longitudinal increase of female estradiol (equation 38) and progesterone (equation 39) during pregnancy:


Plots of plasma estradiol and progesterone levels at different gestational weeks are given in the SDC.
Thyroid
Thyroid volume did not change during the follicular (8.8 ± 3.2 mL) and luteal (9.7 ± 3.1 mL) phase in 11 healthy non-pregnant women.[320] A clinically detectable up to 3-fold increase in thyroid size has been found in iodine-deficient areas, causing what is called ‘goiter of pregnancy’.[321,322]
In iodine-replete areas, thyroid volume, measured by ultrasonography, did not change in ten healthy women during pregnancy. The volume readings (mean ± SD) were 10.3 ± 5.1, 10.6 ± 4.4, 9.6 ± 3.8 and 9.4 ± 3.0 mL before pregnancy and during the first, second and third trimesters, respectively.[320] Thyroid volume did not change in pregnant women living in marginally iodine-deficient areas when they administered iodine supplementation for the prevention of goiter.[323] No information could be found regarding thyroid blood flow during normal pregnancy. Serum concentrations of free triiodothyronine and free tetraiodothyronine decline slightly during pregnancy.[37,320]
Peripheral Blood Flow
Skin changes are common during pregnancy, including vascular and haematological changes, blood flow, temperature, thickness, pigmentation, alterations in glandular activity, and mucous membrane changes.[324–326] There is abundant clinical evidence that blood flow in the skin is increased during pregnancy, particularly in the extremities. Increased blood flow to maternal skin allows dissipation of the heat generated by the fetus.[327] This can explain the common phenomena that pregnant women complain of the heat and feel warm with clammy hands, most probably due to the increased metabolic rate during gestation.[319,328] Most blood flow measurements in the extremities have been made non-invasively using different techniques including plethysmographic,[327,329] photoelectric flow recorder[330] and Doppler flowmetry.[331] Available studies that gave the blood flow reading in terms of volume/time are given in table 26 of the SDC. Regardless of high variability in the obtained measurements, it is obvious from these data that the blood flow to the hand is 3- to 7-fold higher at term than the pre-pregnancy value. A small increase in the calf, arm and forearm blood flow during pregnancy can be visualized from the collected data.
Products of Pregnancy
The products of conception (placenta, fetus, amniotic fluid) comprise approximately 35% of the total gestational weight gain[332] and their longitudinal changes are considered below as part of PBPK information to model kinetics of xenobiotics during various stages of pregnancy.
Intrauterine Volume
During the first 20 weeks of pregnancy, the volume of the amniotic fluid is the major component of intrauterine volume.[319] All intrauterine components grow rapidly during the second trimester to reach about 2100 ± 500 mL by the end of the second trimester.[149] From the beginning of the third trimester to term, fetal growth is the major contributor to increased intrauterine volume. Collected information about total intrauterine volume is given in table 27 of the SDC. There is clearly a gap in these data sets during the first trimester. Due to lack of certainty, an interpolation was done between time zero and the time of the first observation at 13 gestational weeks. A lower growth rate during this early time was assumed. Decomposition of the intrauterine volume profile to its sub-components is covered later in this article. The change in intrauterine (IU) volume can be described by equation 40:

A plot of intrauterine volumes at different gestational weeks is given in the SDC.
Fetus
Accurate predictions of fetal size and age have an important place in clinical management during antenatal care. The fetus in humans is called an embryo until about 8 weeks after fertilization, after which it is called a fetus. Before the embryo is identified, the gestational sac is the only available intrauterine structure that can be used to determine if an intrauterine pregnancy exists.[318,333] Using ultrasonography, the gestational sac can be visualized as early as 4.5 weeks. The growth of the gestational sac during embryonic life is given in table 28 of the SDC. The volume growth during the first month of pregnancy is very slow and becomes faster during the third month of gestation. During 8–12 gestational weeks, water constitutes 92% of the wet weight.[155]
The mean ± SD (CV) gestational sac volume (GSV) [mL] is about 14 ± 13 (90%), 38 ± 25 (66%), 102 ± 43 (%) and 144 ± 27 (19%) at 6, 8, 10 and 13.5 weeks of pregnancy, respectively. The variability is higher at lower sac volumes, most probably due to the limitations of the methodology. Based on these data, the GSV can be described by equation 41:

A plot of GSV at different gestational weeks is given in the SDC.
At term the mean fetal density, determined by air displacement, is about 1.030 ± 0.030 g/mL.[334] The fetal density is not a static measurement and varies during the gestational age as the body composition changes with factors such as fetal fat, water, muscles and bone contents.[335] Since these covariates were not reported in each study, and because no single number can be used throughout the gestational time, a value of 1 g/mL was assumed here to get the volume from the weight in this paper.
Collected data for fetal growth are given in table 29 of the SDC. Meta-analysis of these data sets showed that the fetus grows significantly during the second and third trimester. The mean ± SD (CV) fetal volume (mL) increases from 0.5 ± 0.14 (28%) to 9.4 ± 2.9 (31%), 76 ± 25 (33%), 292 ± 70 (24%), 728 ± 176 (24%), 1513 ± 291 (19%), 2547 ± 439 (17%) and 3439 ± 439 (13%) at 6, 10, 16, 20, 25, 30, 35 and 40 weeks of conception, respectively.
The use of polynominal equations did not describe the data well. The sixth-order polynomial equation performed well from the 7th to 25th week of gestation, but not on both ends. The fifth-order polynomial equation predicted quite well from the 26th week to term, but its prediction during the early growth was worse (2-fold overprediction at the 12th week and more than 20-fold underprediction in the negative field). The fourth-order polynomial equation massively overpredicted fetal volume during the first trimester.
Gompertz and logistic functions were checked for their appropriateness as they have been widely cited and used to describe fetal growth.[25,336,337] Gompertz function was reported to be superior to both polynominal and logistic functions to describe human fetal growth data.[337] These functions were considered here and their parameters were solved using the Microsoft Excel® Solver 2007 to solve its parameters. The Gompertz function gave the best fit among these functions (figure 5); while the logistic function showed good description of the data from 18th week of gestation to term, it failed to describe the early growth during the first trimester. Actually, more accurate description and interpretation of this data requires fitting a model that takes into account variables such as fetal sex, maternal parity, height, weight, gestational age and other sources of variability, mainly intra-individual and inter-studies variability terms. The impacts of such covariates on fetal weight have been reported during pregnancy.[156,157,338–340]

Fetal volume growth during pregnancy: performance of different functions vs actual data. The inset graph represents the expanded view of the first trimester values.
For the current description, the Gompertz equation (equation 42) can be used to describe the longitudinal increase of fetal volume during pregnancy.

A plot of mean fetal volumes with SDs at different gestational weeks is given in the SDC.
Placenta
A major role of the placenta is to transmit nutrient substances to the fetus, thereby providing essential regulation of fetal metabolism and growth. In addition to its nutritional function, it has an endocrine function as it becomes the main source of progesterone during the second and third trimesters[316] and regulates fetal exposure to maternal intake of xenobiotics via an anatomical and physiological barrier, the ‘blood-placenta barrier’. This barrier consists of a single layer of syncytiotrophoblasts and fetal capillary endothelium,[341–343] both of which express a wide range of proteins, mainly transporters and metabolizing enzymes, that determine the level of fetal exposure to maternal intake.[344–349]
Typically, the placenta has a discoid shape. It can be identified as early as 6 weeks gestation by transvaginal evaluation and by 10 weeks gestation by transabdominal evaluation as a rim around the gestational sac.[350] The average placenta volume/weight ratio is 1.048 ± 0.006 mL/g determined by the water displacement method in 30 normal placentas.[171] Of its total wet weight, a human placenta at term contains about 84.6 ± 1.3% water (n = 54), 12 ± 0.88% protein (n = 54), 1.3 ± 0.32% collagen (n = 16), 1.0 ± 0.4% ash (n = 16) and 0.4 ± 0.07% lipid (n = 12).[351] In 46 normal term placentas, the specific gravity was found to be 0.995.[352] Decomposition of a typical wet placenta of 658 g at term is 200 g cord, membranes and drainable blood, 320 g water, 100 g trapped blood, 13 g inert protein, 22 g metabolic protein and 3 g non-protein solids.[353]
The volume of the placenta is continuously increasing during pregnancy, with considerable variability.[171,172] At birth the cord and both the cord and membrane constitute about 5% and 16.3% of the total untrimmed placental weight, respectively[354] and receive about 33% of the total feto-placental blood circuit.[355] Reported placenta size for intrauterine growth-restricted, large and small for gestational age fetuses were excluded here. Therefore, placental weight reported for normal and appropriate for gestational age fetuses was included in this study. These data are shown in table 30 of the SDC.
Data analysis showed that the volume of the placenta (mL) increases during pregnancy with a mean value ± SD (CV) of 134 ± 58 (44%), 254 ± 62 (24%), 460 ± 173 (38%), 593 ± 90 (15%) and 659 ± 103 (16%) at 14, 20, 30, 36 and 40 weeks of conception, respectively. Equation 43 can be used to describe the longitudinal increase of placenta volume during pregnancy:

A plot of placenta volume at different gestational weeks is given in the SDC.
Amniotic Fluid Volume
Amniotic fluid volume during pregnancy is a dynamic process. In early gestation, the amniotic fluid is likely formed by active transport by the amnion into the amniotic space and water is allowed to flow passively.[356] Fetal urine contributes to the volume of amniotic fluid from 11 weeks of gestation[158,159,357] and becomes the major source of amniotic fluid production in the second half of the pregnancy. The fetal urine production rates were found to be about 7.5, 22.2, 56.1 and 125.1 mL/h at 25, 30, 35 and 40 gestational weeks, respectively.[358] Fetal secretion from the lungs and from the oral-nasal cavity contributes to the overall amniotic fluid volume.[356] On the other hand, fetal swallowing plays a part in the elimination of amnii as early as 11 weeks gestation and becomes the major source of elimination at the second half of gestation[356,359] as it is probably not transferred across the skin in a significant amount in the third trimester.[159]
The specific gravity of amniotic fluid removed at 14 weeks’ gestation was determined to be 1.007.[160] The composition of amniotic fluid is similar to that of the fetal extracellular fluid before 20 weeks of gestation and its volume is closely related to the fetal weight. After 20–22 weeks of gestation fetal skin becomes keratinized and offers no impediment to the movement of fluid.[159]
Earlier studies that measured amniotic fluid volume in the first half of gestation have been made directly on the contents of the amniotic sac after therapeutic hysterotomy or hysterectomy.[180,181] During the second half of gestation or in pregnancies intended to be continued, a dye dilution method was used instead of a direct method.[360] More recently the volume of amniotic fluid has been measured by ultrasonography. Ultrasound evaluation of amniotic fluid volume can never represent a true ‘quantitative’ method and its actual reliability has not consistently been proved by scientific evidence.[361]
Collected studies reporting amniotic fluid volumes from normal outcomes are summarized in table 31 of the SDC. Unfortunately, only limited data could be found between 21 and 33 weeks of gestation. Analysis of the collected data showed that the mean ± SD (CV) amniotic fluid volume (mL) increases from 41 ± 15 (36%) to 200 ± 64 (32%), 359 ± 106 (30%), 823 ± 264 (32%) and 758 ± 132 (18%) at 9, 15, 20, 34 and 40 weeks of gestation, respectively. Equation 44 can be used to describe the longitudinal increase of amniotic fluid (AF) volume during pregnancy:

A plot of amniotic fluid volume at different gestational weeks is given in the SDC.
Discussion
The PBPK models offer a systematic approach to assessing the exposure of pregnant women to various xenobiotics in the different stages of pregnancy and to discern potential differences compared with non-pregnant women. However, such models require substantial data gathering related to the system (human body) to be combined with compound-related information on the drug or xenobiotic prior to PBPK modelling being conducted. To our knowledge, no unique source is currently available to offer the data required for PBPK models during pregnancy and this shortcoming may lead to unnecessary repetition of the data gathering exercise. Moreover, research reports describing the longitudinal changes of relevant parameters are limited.
This report summarizes available data in peer-reviewed literature for many physiological changes in healthy, predominantly Caucasian, pregnant populations in terms of how they change from preconception or early pregnancy to the end of pregnancy. This database can be analysed to derive many parameters (point estimates and distributions), which are required to develop deterministic or probabilistic PBPK models for this population. The developed PBPK models can then be used for pharmacological and toxicological studies, including the dose (exposure)-response relationship, dose adjustment and risk assessment. Moreover, a robust PBPK model based on correlated Monte Carlo simulation can be built when appropriate relationships between the various parameters are established using relevant statistical tools.
The starting point for gathering systems data for PBPK would be the body size and its composition. Measurement of changes in body composition during pregnancy is confounding mainly due to the lack of appropriate baseline data and methodology. Body composition can change as early as in the first trimester[35,37,52,319] and ‘baseline’ measurements obtained at the postpartum period or early in pregnancy may not represent the pre-pregnancy composition.[35,36,48] Most commonly, methods used to quantify the changes in pregnant body composition are based on different assumptions. For example, the two-component model in body composition methods[202,362] assumes that the densities of fat mass and FFM are constant during pregnancy and known (i.e. FFM is composed of 73% water, 20% protein and 7% bone mineral).[363] This model was modified by van Raaij et al.,[202] based on the average changes in density and composition of the FFM during pregnancy. Studies that compared two-, three- and four-component models of estimating body fat mass during pregnancy[48,364] found that two-component models varied from underestimating fat mass by 9% to overestimating fat mass by 22% compared with the four-component model. Three-component models provided much more accurate fat mass values, within 1% of the four-component model. The accuracy of these methods is still questionable and more valid methods of quantifying fat mass in individual women during pregnancy are needed.
An additional hurdle to gathering data observed during the study was the fact that many studies performed their analysis after pooling the data into three trimesters, at monthly or 10-weekly intervals. Selection of such intervals can introduce much distortion of the results. For instance, it can mask a peak, if any, of a parameter within the studied intervals that occurs at a given gestational point in another publication. In many papers, authors reported only the mean value of the parameter of interest without mentioning the variability around it. On the other hand, many studies reported the results in terms of graphical figures and extracting the data from these may lead to technical errors.
Despite all the difficulties described above, the current level of data collection seems sufficient as a starting point for building pregnancy PBPK models encompassing longitudinal changes of physiological and biological values with gestational age. These applications surely require verification for their performance against field data (clinical observation on pharmaceutical drugs or opportunistic data on environmental chemicals). Such models have to be viewed as live models that are built on a flexible framework that allows new data to be incorporated as it becomes available. Based on the current study, there are a number of areas where data are lacking; in most cases due to clinical or ethical reasons and lack of appropriate methodology. This is particularly marked in parameters, which are related to early fetal growth, regional distribution of maternal cardiac output to different tissues and tissue composition (neutral lipid, phospholipids and protein levels), and are necessary for estimating volume of distribution and xenobiotic partition coefficients. In addition, less is known about regional distribution of blood flow to both maternal and fetal organs during gestation. Although there is some information regarding the direction of change in the activity of many metabolizing enzymes during pregnancy, the magnitude of these changes is not well described. For those enzymes whose activities were described, most of these data were uncorrected for the impact of other factors such as the change in protein binding and renal function.
We also identified sets of sparse data that come from cross-sectional studies and at a particular gestational age, where the cross-validation of methodology between different approaches is questionable. Application of non-linear mixed effect analysis to such a set by accounting for different sources of variability is warranted. In addition to previous limitations, extrapolation of experimental methods from a pre-pregnant to a pregnant population needs to be re-assessed.
It is clear that for many parameters there are limited existing data, such as activity of metabolizing enzymes, uterine mass, and blood flow to the mammary glands and liver during pregnancy. The current evaluation of these data was carried out based on the collected data presented in the SDC tables. Thus, the provided mean and variability values for poorly described parameters may not represent the actual mean or variability in the real situation. Collected data determined the sort/order of the derived equations and their coefficients. However, the current paper provides up-to-date data and reveals gaps in existing knowledge, identifying areas where further research is required.
At the moment, pregnant women are excluded during clinical studies and most published results stem from retrospective reports. Unfortunately, longitudinal studies, where the same subject acts as a control and a test subject, are very limited in their purpose and sample size. We aimed to provide a comprehensive database for a Caucasian pregnant population. The equations derived were descriptive in terms of how their parameters change during pregnancy. In order to develop a mechanistic model, multivariate analysis of pregnant covariates, means and distribution should be carried out and the results integrated with the model parameters. Such analysis is required to achieve biological plausibility of the relationship between physiological parameters, which is not the scope of the current paper.
This paper also shows the need to understand the molecular mechanisms that underlie the temporal, physiological, and anatomical and biochemical adaptations occurring during pregnancy. In addition to the divergent methodologies that have been used, the nature of the underlying signalling molecules, how these molecular mechanisms and signals interact, in what ways these changes are influenced by individual and population factors, and whether the adaptations observed during first pregnancy are memorized and affect subsequent pregnancies can be identified as a hot topics for further investigation. When we understand how these molecular changes can affect drug pharmacokinetics more clearly, we will be able to build more mechanistic pregnancy PBPK models and improve their predictive capabilities.
Conclusion
The changes in kinetics of xenobiotics or drugs during pregnancy might stem from a highly complex myriad of factors that influence various compounds in different ways. However, capturing variations in the system parameters, which include alterations in body composition, organ functions and biological processes, are a common element in any PBPK model. We have provided a repository of such information and have shown that various elements of system parameters relevant to PBPK in pregnancy follow different temporal trajectories of change with gestational age. The interaction between these temporal changes during gestation and specific properties of the exogenous compounds results in time-dependent differences in kinetics and, consequently, dynamics of effects that these compounds may exert; with implications for the susceptibility of pregnant women to the effects of these compounds.
References
Anger GJ, Piquette-Miller M. Pharmacokinetic studies in pregnant women. Clin Pharmacol Ther 2008 Jan; 83(1): 184–7
Jeong H. Altered drug metabolism during pregnancy: hormonal regulation of drug-metabolizing enzymes. Expert Opin Drug Metab Toxicol 2010 Jun; 6(6): 689–99
Ververs FF, Voorbij HA, Zwarts P, et al. Effect of cytochrome P450 2D6 genotype on maternal paroxetine plasma concentrations during pregnancy. Clin Pharmacokinet 2009; 48(10): 677–83
Hodge LS, Tracy TS. Alterations in drug disposition during pregnancy: implications for drug therapy. Expert Opin Drug Metab Toxicol 2007 Aug; 3(4): 557–71
Clapp JF, Capeless E. Cardiovascular function before, during, and after the first and subsequent pregnancies. Am J Cardiol 1997 Dec 1; 80(11): 1469–73
De Swiet M. The cardiovascular system. In: Hytten F, Chamberlain G, editors. Clinical physiology in obstetrics. 2nd ed. Oxford: Blackwell Science Ltd, 1991: 3–38
Pritchard JA. Changes in the blood volume during pregnancy and delivery. Anesthesiology 1965 Jul–Aug; 26: 393–9
Chapman AB, Abraham WT, Zamudio S, et al. Temporal relationships between hormonal and hemodynamic changes in early human pregnancy. Kidney Int 1998 Dec; 54(6): 2056–63
Brown MA, Whitworth JA. The kidney in hypertensive pregnancies: victim and villain. Am J Kidney Dis 1992 Nov; 20(5): 427–42
Lindheimer MD, Katz AI. Sodium and diuretics in pregnancy. N Engl J Med 1973 Apr 26; 288(17): 891–4
Headley J, Northstone K, Simmons H, et al. Medication use during pregnancy: data from the Avon Longitudinal Study of Parents and Children. Eur J Clin Pharmacol 2004 Jul; 60(5): 355–61
Andrade SE, Gurwitz JH, Davis RL, et al. Prescription drug use in pregnancy. Am J Obstet Gynecol 2004 Aug; 191(2): 398–407
Cohen LS, Altshuler LL, Harlow BL, et al. Relapse of major depression during pregnancy in women who maintain or discontinue antidepressant treatment. JAMA 2006 Feb 1; 295(5): 499–507
Ramos E, St-Andre M, Rey E, et al. Duration of antidepressant use during pregnancy and risk of major congenital malformations. Br J Psychiatry 2008 May; 192(5): 344–50
Andrade SE, Raebel MA, Brown J, et al. Use of antidepressant medications during pregnancy: a multisite study. Am J Obstet Gynecol 2008 Feb; 198(2): 194e1–5
Davis RL, Rubanowice D, McPhillips H, et al. Risks of congenital malformations and perinatal events among infants exposed to antidepressant medications during pregnancy. Pharmacoepidemiol Drug Saf 2007 Oct; 16(10): 1086–94
Anderson GD. Pregnancy-induced changes in pharmacokinetics: a mechanistic-based approach. Clin Pharmacokinet 2005; 44(10): 989–1008
Little BB. Pharmacokinetics during pregnancy: evidence-based maternal dose formulation. Obstet Gynecol 1999 May; 93(5 Pt 2): 858–68
FDA, Center for Drug Evaluation and Research. Guidance for industry: pharmacokinetics in pregnancy — study design, data analysis, and impact on dosing and labeling [online]. Available from URL: http://www.fda.gov/downloads/Drugs/GuidanceComplianceRegulatoryInformation/Guidances/ucm072133.pdf [Accessed 2010 Sep 11]
Johnson TN, Rostami-Hodjegan A. Resurgence in the use of physiologically based pharmacokinetic models in pediatric clinical pharmacology: parallel shift in incorporating the knowledge of biological elements and increased applicability to drug development and clinical practice. Paediatr Anaesth 2011 Mar; 21(3): 291–301
Beaudouin R, Micallef S, Brochot C. A stochastic whole-body physiologically based pharmacokinetic model to assess the impact of inter-individual variability on tissue dosimetry over the human lifespan. Regul Toxicol Pharmacol 2010 Jun; 57(1): 103–16
Jamei M, Dickinson GL, Rostami-Hodjegan A. A framework for assessing inter-individual variability in pharmacokinetics using virtual human populations and integrating general knowledge of physical chemistry, biology, anatomy, physiology and genetics: a tale of ‘bottom-up’ vs ‘top-down’ recognition of covariates. Drug Metab Pharmacokinet 2009; 24(1): 53–75
Andrew MA, Hebert MF, Vicini P. Physiologically based pharmacokinetic model of midazolam disposition during pregnancy. Conf Proc IEEE Eng Med Biol Soc 2008; 2008: 5454–7
Corley RA, Mast TJ, Carney EW, et al. Evaluation of physiologically based models of pregnancy and lactation for their application in children’s health risk assessments. Crit Rev Toxicol 2003; 33(2): 137–211
Young JF, Branham WS, Sheehan DM, et al. Physiological “constants” for PBPK models for pregnancy. J Toxicol Environ Health 1997 Dec 12; 52(5): 385–401
Luecke RH, Wosilait WD, Pearce BA, et al. A physiologically based pharmacokinetic computer model for human pregnancy. Teratology 1994 Feb; 49(2): 90–103
Luecke RH, Wosilait WD, Pearce BA, et al. A computer model and program for xenobiotic disposition during pregnancy. Comput Methods Programs Biomed 1997 Jul; 53(3): 201–24
Gentry PR, Covington TR, Andersen ME, et al. Application of a physiologically based pharmacokinetic model for isopropanol in the derivation of a reference dose and reference concentration. Regul Toxicol Pharmacol 2002 Aug; 36(1): 51–68
Gentry PR, Covington TR, Clewell 3rd HJ. Evaluation of the potential impact of pharmacokinetic differences on tissue dosimetry in offspring during pregnancy and lactation. Regul Toxicol Pharmacol 2003 Aug; 38(1): 1–16
Aitchison J, Brown JAC. The log normal distribution. Cambridge: University Press, 1966
Armitage P, Berry J, Matthews JNS. Statistical methods in medical research. 4th ed. Oxford: Blackwell Science, 2002
Haddad S, Restieri C, Krishnan K. Characterization of age-related changes in body weight and organ weights from birth to adolescence in humans. J Toxicol Environ Health 2001 Nov 23; 64(6): 453–64
Young JF, Luecke RH, Pearce BA, et al. Human organ/tissue growth algorithms that include obese individuals and black/white population organ weight similarities from autopsy data. J Toxicol Environ Health 2009; 72(8): 527–40
Thomas D, Das SK, Levine JA, et al. New fat free mass: fat mass model for use in physiological energy balance equations. Nutr Metab (Lond) 2010; 7: 39
Butte NF, Ellis KJ, Wong WW, et al. Composition of gestational weight gain impacts maternal fat retention and infant birth weight. Am J Obstet Gynecol 2003 Nov; 189(5): 1423–32
Kopp-Hoolihan LE, van Loan MD, Wong WW, et al. Longitudinal assessment of energy balance in well-nourished, pregnant women. Am J Clin Nutr 1999 Apr; 69(4): 697–704
Lof M, Olausson H, Bostrom K, et al. Changes in basal metabolic rate during pregnancy in relation to changes in body weight and composition, cardiac output, insulin-like growth factor I, and thyroid hormones and in relation to fetal growth. Am J Clin Nutr 2005 Mar; 81(3): 678–85
Hebert MF, Easterling TR, Kirby B, et al. Effects of pregnancy on CYP3A and P-glycoprotein activities as measured by disposition of midazolam and digoxin: a University of Washington specialized center of research study. Clin Pharmacol Ther 2008 Aug; 84(2): 248–53
Lof M, Hilakivi-Clarke L, Sandin SS, et al. Dietary fat intake and gestational weight gain in relation to estradiol and progesterone plasma levels during pregnancy: a longitudinal study in Swedish women. BMC Womens Health 2009; 9: 10
Abrams B, Selvin S. Maternal weight gain pattern and birth weight. Obstet Gynecol 1995 Aug; 86(2): 163–9
Catalano PM, Roman-Drago NM, Amini SB, et al. Longitudinal changes in body composition and energy balance in lean women with normal and abnormal glucose tolerance during pregnancy. Am J Obstet Gynecol 1998 Jul; 179(1): 156–65
de Groot LC, Boekholt HA, Spaaij CK, et al. Energy balances of healthy Dutch women before and during pregnancy: limited scope for metabolic adaptations in pregnancy. Am J Clin Nutr 1994 Apr; 59(4): 827–32
Edouard DA, Pannier BM, London GM, et al. Venous and arterial behavior during normal pregnancy. Am J Physiol 1998 May; 274(5 Pt 2): H1605–12
Ghezzi F, Franchi M, Balestreri D, et al. Bioelectrical impedance analysis during pregnancy and neonatal birth weight. Eur J Obstet Gynecol Re-product Biol 2001 Oct; 98(2): 171–6
Larciprete G, Valensise H, Vasapollo B, et al. Body composition during normal pregnancy: reference ranges. Acta Diabetol 2003 Oct; 40 Suppl. 1: S225–32
Wolfe WS, Sobal J, Olson CM, et al. Parity-associated weight gain and its modification by sociodemographic and behavioral factors: a prospective analysis in US women. Int J Obes Relat Metab Disord 1997 Sep; 21(9): 802–10
Hronek M, Klemera P, Tosner J, et al. Anthropometric measured fat-free mass as essential determinant of resting energy expenditure for pregnant and non-pregnant women. Nutrition 2011 Sep; 27(9): 885–90
Kopp-Hoolihan LE, van Loan MD, Wong WW, et al. Fat mass deposition during pregnancy using a four-component model. J Appl Physiol 1999 Jul; 87(1): 196–202
Goldberg GR, Prentice AM, Coward WA, et al. Longitudinal assessment of the components of energy balance in well-nourished lactating women. Am J Clin Nutr 1991 Nov; 54(5): 788–98
Lederman SA, Paxton A, Heymsfield SB, et al. Body fat and water changes during pregnancy in women with different body weight and weight gain. Obstet Gynecol 1997 Oct; 90(4 Pt 1): 483–8
Van Loan MD, Kopp LE, King JC, et al. Fluid changes during pregnancy: use of bioimpedance spectroscopy. J Appl Physiol 1995 Mar; 78(3): 1037–42
Lof M, Forsum E. Evaluation of bioimpedance spectroscopy for measurements of body water distribution in healthy women before, during, and after pregnancy. J Appl Physiol 2004 Mar; 96(3): 967–73
Deurenberg P. Body composition techniques in health and disease. Cambridge: Cambridge University Press, 1995: 45–56
Frederiksen MC, Ruo TI, Chow MJ, et al. Theophylline pharmacokinetics in pregnancy. Clin Pharmacol Ther 1986 Sep; 40(3): 321–8
Lukaski HC, Siders WA, Nielsen EJ, et al. Total body water in pregnancy: assessment by using bioelectrical impedance. Am J Clin Nutr 1994 Mar; 59(3): 578–85
Pipe NG, Smith T, Halliday D, et al. Changes in fat, fat-free mass and body water in human normal pregnancy. Br J Obstet Gynaecol 1979 Dec; 86(12): 929–40
Seitchik J. Total body water and total body density of pregnant women. Obstet Gynecol 1967 Feb; 29(2): 155–66
Valensise H, Andreoli A, Lello S, et al. Multifrequency bioelectrical impedance analysis in women with a normal and hypertensive pregnancy. Am J Clin Nutr 2000 Sep; 72(3): 780–3
Forsum E, Sadurskis A, Wager J. Resting metabolic rate and body composition of healthy Swedish women during pregnancy. Am J Clin Nutr 1988 Jun; 47(6): 942–7
van Marken Lichtenbelt WD, Snel YE, Brummer RJ, et al. Deuterium and bromide dilution, and bioimpedance spectrometry independently show that growth hormone-deficient adults have an enlarged extracellular water compartment related to intracellular water. J Clin Endocrinol Metab 1997 Mar; 82(3): 907–11
Clark SL, Cotton DB, Lee W, et al. Central hemodynamic assessment of normal term pregnancy. Am J Obstet Gynecol 1989 Dec; 161(6 Pt 1): 1439–42
Robson SC, Hunter S, Boys RJ, et al. Serial study of factors influencing changes in cardiac output during human pregnancy. Am J Physiol 1989 Apr; 256(4 Pt 2): 1060–5
Easterling TR, Benedetti TJ, Schmucker BC, et al. Maternal hemodynamics in normal and preeclamptic pregnancies: a longitudinal study. Obstet Gynecol 1990 Dec; 76(6): 1061–9
Del Bene R, Barletta G, Mello G, et al. Cardiovascular function in pregnancy: effects of posture. BJOG 2001 Apr; 108(4): 344–52
Hale SA, Schonberg A, Badger GJ, et al. Relationship between prepregnancy and early pregnancy uterine blood flow and resistance index. Reprod Sci 2009 Nov; 16(11): 1091–6
Hennessy TG, MacDonald D, Hennessy MS, et al. Serial changes in cardiac output during normal pregnancy: a Doppler ultrasound study. Eur J Obstet Gynecol Reproduct Biol 1996 Dec 27; 70(2): 117–22
Mesa A, Jessurun C, Hernandez A, et al. Left ventricular diastolic function in normal human pregnancy. Circulation 1999 Feb 2; 99(4): 511–7
Salas SP, Marshall G, Gutierrez BL, et al. Time course of maternal plasma volume and hormonal changes in women with preeclampsia or fetal growth restriction. Hypertension 2006 Feb; 47(2): 203–8
Bernstein IM, Ziegler W, Badger GJ. Plasma volume expansion in early pregnancy. Obstet Gynecol 2001 May; 97(5 Pt 1): 669–72
Lund CJ, Donovan JC. Blood volume during pregnancy. Significance of plasma and red cell volumes. Am J Obstet Gynecol 1967 Jun 1; 98(3): 394–403
Whittaker PG, Lind T. The intravascular mass of albumin during human pregnancy: a serial study in normal and diabetic women. Br J Obstet Gynaecol 1993 Jun; 100(6): 587–92
Campbell DM, MacGillivray I. Comparison of maternal response in first and second pregnancies in relation to baby weight. J Obstet Gynaecol Br Commonw 1972 Aug; 79(8): 684–93
Rovinsky JJ, Jaffin H. Cardiovascular hemodynamics in pregnancy. I. Blood and plasma volumes in multiple pregnancy. Am J Obstet Gynecol 1965 Sep 1; 93: 1–15
Caton WL, Roby CC, Reid DE, et al. The circulating red cell volume and body hematocrit in normal pregnancy and the puerperium by direct measurement using radioactive red cells. Am J Obstet Gynecol 1951 Jun; 61(6): 1207–17
Honger PE. Intravascular mass of albumin in pre-eclampsia and normal pregnancy. Scand J Clin Lab Invest 1967; 19(3): 283–7
Verel D, Bury JD, Hope A. Blood volume changes in pregnancy and the puerperium. Clin Sci (Lond) 1956 Feb; 15(1): 1–7
Whittaker PG, Macphail S, Lind T. Serial hematologic changes and pregnancy outcome. Obstet Gynecol 1996 Jul; 88(1): 33–9
Bruinse HW, van den Berg H, Haspels AA. Smoking and its effect on maternal plasma volume during and after normal pregnancy. Eur J Obstet Gynecol Reproduct Biol 1985 Oct; 20(4): 215–9
Cope I. Plasma and blood volume changes in late and prolonged pregnancy. J Obstet Gynaecol Br Empire 1958 Dec; 65(6): 877–94
Hytten FE, Paintin DB. Increase in plasma volume during normal pregnancy. J Obstet Gynaecol Br Emp 1963 Jun; 70: 402–7
Pirani BB, Campbell DM, MacGillivray I. Plasma volume in normal first pregnancy. J Obstet Gynaecol Br Commonw 1973 Oct; 80(10): 884–7
Silver HM, Seebeck M, Carlson R. Comparison of total blood volume in normal, preeclamptic, and nonproteinuric gestational hypertensive pregnancy by simultaneous measurement of red blood cell and plasma volumes. Am J Obstet Gynecol 1998 Jul; 179(1): 87–93
Robson SC, Mutch E, Boys RJ, et al. Apparent liver blood flow during pregnancy: a serial study using indocyanine green clearance. Br J Obstet Gynaecol 1990 Aug; 97(8): 720–4
Darby WJ, Mc GW, Martin MP, et al. The Vanderbilt cooperative study of maternal and infant nutrition. IV: dietary, laboratory and physical findings in 2,129 delivered pregnancies. J Nutr 1953 Dec 10; 51(4): 565–97
Lundstrom P. Studies on erythroid elements and serum iron in normal pregnancy. Acta Soc Med Ups 1950 Jan; 55(1/2): 1–83
Pond SM, Kreek MJ, Tong TG, et al. Altered methadone pharmacokinetics in methadone-maintained pregnant women. J Pharmacol Exp Ther 1985 Apr; 233(1): 1–6
Sala C, Campise M, Ambroso G, et al. Atrial natriuretic peptide and hemodynamic changes during normal human pregnancy. Hypertension 1995 Apr; 25(4 Pt 1): 631–6
Duvekot JJ, Cheriex EC, Pieters FA, et al. Early pregnancy changes in hemodynamics and volume homeostasis are consecutive adjustments triggered by a primary fall in systemic vascular tone. Am J Obstet Gynecol 1993 Dec; 169(6): 1382–92
Haram K, Augensen K, Elsayed S. Serum protein pattern in normal pregnancy with special reference to acute-phase reactants. Br J Obstet Gynaecol 1983 Feb; 90(2): 139–45
Connelly TJ, Ruo TI, Frederiksen MC, et al. Characterization of theophylline binding to serum proteins in pregnant and nonpregnant women. Clin Pharmacol Ther 1990 Jan; 47(1): 68–72
Mendenhall HW. Serum protein concentrations in pregnancy. I: concentrations in maternal serum. Am J Obstet Gynecol 1970 Feb 1; 106(3): 388–99
Tsen LC, Tarshis J, Denson DD, et al. Measurements of maternal protein binding of bupivacaine throughout pregnancy. Anesth Analg 1999 Oct; 89(4): 965–8
Chu CY, Singla VP, Wang HP, et al. Plasma alpha 1-acid glycoprotein levels in pregnancy. Clinica Chimica Acta 1981 May 5; 112(2): 235–40
Krauer B, Dayer P, Anner R. Changes in serum albumin and alpha 1-acid glycoprotein concentrations during pregnancy: an analysis of fetal-maternal pairs. Br J Obstet Gynaecol 1984 Sep; 91(9): 875–81
Tsen LC, Arthur GR, Datta S, et al. Estrogen-induced changes in protein binding of bupivacaine during in vitro fertilization. Anesthesiology 1997 Oct; 87(4): 879–83
Wang HP, Chu CY. A solid-phase enzyme-linked immunosorbent assay for the quantitation of human plasma alpha 1-acid glycoprotein. Clin Chem 1979 Apr; 25(4): 546–9
Reboud P, Groulade J, Groslambert P, et al. The influence of normal pregnancy and the postpartum state on plasma proteins and lipids. Am J Obstet Gynecol 1963 Jul 15; 86: 820–8
Desoye G, Schweditsch MO, Pfeiffer KP, et al. Correlation of hormones with lipid and lipoprotein levels during normal pregnancy and postpartum. J Clin Endocrinol Metab 1987 Apr; 64(4): 704–12
Alvarez JJ, Montelongo A, Iglesias A, et al. Longitudinal study on lipoprotein profile, high density lipoprotein subclass, and postheparin lipases during gestation in women. J Lipid Res 1996 Feb; 37(2): 299–308
Butler CL, Williams MA, Sorensen TK, et al. Relation between maternal recreational physical activity and plasma lipids in early pregnancy. Am J Epidemiol 2004 Aug 15; 160(4): 350–9
Lippi G, Albiero A, Montagnana M, et al. Lipid and lipoprotein profile in physiological pregnancy. Clin Lab 2007; 53(3–4): 173–7
Tracy TS, Venkataramanan R, Glover DD, et al. Temporal changes in drug metabolism (CYP1A2, CYP2D6 and CYP3A activity) during pregnancy. Am J Obstet Gynecol 2005 Feb; 192(2): 633–9
Dunlop W. Serial changes in renal haemodynamics during normal human pregnancy. Br J Obstet Gynaecol 1981 Jan; 88(1): 1–9
Assali NS, Dignam WJ, Dasgupta K. Renal function in human pregnancy: II. Effects of venous pooling on renal hemodynamics and water, electrolyte, and aldosterone excretion during gestation. J Lab Clin Med 1959 Sep; 54: 394–408
Davison JM, Hytten FE. Glomerular filtration during and after pregnancy. J Obstet Gynaecol Br Commonw 1974 Aug; 81(8): 588–95
Irons DW, Baylis PH, Davison JM. Effect of atrial natriuretic peptide on renal hemodynamics and sodium excretion during human pregnancy. Am J Physiol 1996 Jul; 271(1 Pt 2): F239–42
Lafayette RA, Druzin M, Sibley R, et al. Nature of glomerular dysfunction in pre-eclampsia. Kidney Int 1998 Oct; 54(4): 1240–9
Moran P, Baylis PH, Lindheimer MD, et al. Glomerular ultrafiltration in normal and preeclamptic pregnancy. J Am Soc Nephrol 2003 Mar; 14(3): 648–52
Sims EA, Krantz KE. Serial studies of renal function during pregnancy and the puerperium in normal women. J Clin Invest 1958 Dec; 37(12): 1764–74
Spaanderman M, Ekhart T, van Eyck J, et al. Preeclampsia and maladaptation to pregnancy: a role for atrial natriuretic peptide? Kidney Int 2001 Oct; 60(4): 1397–406
Sturgiss SN, Wilkinson R, Davison JM. Renal reserve during human pregnancy. Am J Physiol 1996 Jul; 271(1 Pt 2): F16–20
Andrew MA, Easterling TR, Carr DB, et al. Amoxicillin pharmacokinetics in pregnant women: modeling and simulations of dosage strategies. Clin Pharmacol Ther 2007 Apr; 81(4): 547–56
Davison JM, Dunlop W, Ezimokhai M. 24-Hour creatinine clearance during the third trimester of normal pregnancy. Br J Obstet Gynaecol 1980 Feb; 87(2): 106–9
Davison JM, Noble MC. Serial changes in 24 hour creatinine clearance during normal menstrual cycles and the first trimester of pregnancy. Br J Obstet Gynaecol 1981 Jan; 88(1): 10–7
Vural P, Akgul C, Canbaz M. Urinary PGE2 and PGF2alpha levels and renal functions in preeclampsia. Gynecol Obstet Invest 1998; 45(4): 237–41
De Alvarez RR. Renal glomerulotubular mechanisms during normal pregnancy. I: glomerular filtration rate, renal plasma flow, and creatinine clearance. Am J Obstet Gynecol 1958 May; 75(5): 931–44
Nevo O, Soustiel JF, Thaler I. Maternal cerebral blood flow during normal pregnancy: a cross-sectional study. Am J Obstet Gynecol 2010 Nov; 203(5): 475e1–6
Hytten FE, Cheyne GA. The size and composition of the human pregnant uterus. J Obstet Gynaecol Br Commonw 1969 May; 76(5): 400–3
Woessner JF, Brewer TH. Formation and breakdown of collagen and elastin in the human uterus during pregnancy and post-partum involution. Biochemical J 1963 Oct; 89: 75–82
Morrione TG, Seifter S. Alteration in the collagen content of the human uterus during pregnancy and post partum involution. J Exp Med 1962 Feb 1; 115: 357–65
Flo K, Wilsgaard T, Vartun A, et al. A longitudinal study of the relationship between maternal cardiac output measured by impedance cardiography and uterine artery blood flow in the second half of pregnancy. BJOG 2010 Jun; 117(7): 837–44
Thaler I, Manor D, Itskovitz J, et al. Changes in uterine blood flow during human pregnancy. Am J Obstet Gynecol 1990 Jan; 162(1): 121–5
Bernstein IM, Ziegler WF, Leavitt T, et al. Uterine artery hemodynamic adaptations through the menstrual cycle into early pregnancy. Obstet Gynecol 2002 Apr; 99(4): 620–4
Dickey RP, Hower JF. Ultrasonographic features of uterine blood flow during the first 16 weeks of pregnancy. Human Reprod 1995 Sep; 10(9): 2448–52
Jeffreys RM, Stepanchak W, Lopez B, et al. Uterine blood flow during supine rest and exercise after 28 weeks of gestation. BJOG 2006 Nov; 113(11): 1239–47
Konje JC, Howarth ES, Kaufmann P, et al. Longitudinal quantification of uterine artery blood volume flow changes during gestation in pregnancies complicated by intrauterine growth restriction. BJOG 2003 Mar; 110(3): 301–5
Konje JC, Kaufmann P, Bell SC, et al. A longitudinal study of quantitative uterine blood flow with the use of color power angiography in appropriate for gestational age pregnancies. Am J Obstet Gynecol 2001 Sep; 185(3): 608–13
Metcalfe J, Romney SL, Ramsey LH, et al. Estimation of uterine blood flow in normal human pregnancy at term. J Clin Invest 1955 Nov; 34(11): 1632–8
Palmer SK, Zamudio S, Coffin C, et al. Quantitative estimation of human uterine artery blood flow and pelvic blood flow redistribution in pregnancy. Obstet Gynecol 1992 Dec; 80(6): 1000–6
Rigano S, Ferrazzi E, Boito S, et al. Blood flow volume of uterine arteries in human pregnancies determined using 3D and bi-dimensional imaging, angio-Doppler, and fluid-dynamic modeling. Placenta 2010 Jan; 31(1): 37–43
Wilson MJ, Lopez M, Vargas M, et al. Greater uterine artery blood flow during pregnancy in multigenerational (Andean) than shorter-term (European) high-altitude residents. Am J Physiol 2007 Sep; 293(3): R1313–24
Cox DB, Kent JC, Casey TM, et al. Breast growth and the urinary excretion of lactose during human pregnancy and early lactation: endocrine relationships. Exp Physiol 1999 Mar; 84(2): 421–34
Hytten FE. Clinical and chemical studies in human lactation. VI: the functional capacity of the breast. Br Med J 1954 Apr 17; 1(4867): 912–5
Eder M, Schneider A, Feussner H, et al. Breast volume assessment based on 3D surface geometry: verification of the method using MR imaging [in German]. Biomed Tech (Berl) 2008 Jun; 53(3): 112–21
Kovacs L, Eder M, Hollweck R, et al. New aspects of breast volume measurement using 3-dimensional surface imaging. Ann Plast Surg 2006 Dec; 57(6): 602–10
Thoresen M, Wesche J. Doppler measurements of changes in human mammary and uterine blood flow during pregnancy and lactation. Acta Obstet Gynecol Scand 1988; 67(8): 741–5
Hussain Z, Roberts N, Whitehouse GH, et al. Estimation of breast volume and its variation during the menstrual cycle using MRI and stereology. Br J Radiol 1999 Mar; 72(855): 236–45
Kovacs L, Eder M, Hollweck R, et al. Comparison between breast volume measurement using 3D surface imaging and classical techniques. Breast 2007 Apr; 16(2): 137–45
Arslan AA, Zeleniuch-Jacquotte A, Lukanova A, et al. Effects of parity on pregnancy hormonal profiles across ethnic groups with a diverse incidence of breast cancer. Cancer Epidemiol Biomarkers Prev 2006 Nov; 15(11): 2123–30
Dickey RP, Hower JF. Relationship of estradiol and progesterone levels to uterine blood flow during early pregnancy. Early Pregnancy 1996 Jun; 2(2): 113–20
Potischman N, Troisi R, Thadhani R, et al. Pregnancy hormone concentrations across ethnic groups: implications for later cancer risk. Cancer Epidemiol Biomarkers Prev 2005 Jun; 14(6): 1514–20
Risberg A, Olsson K, Lyrenas S, et al. Plasma vasopressin, oxytocin, estradiol, and progesterone related to water and sodium excretion in normal pregnancy and gestational hypertension. Acta Obstet Gynecol Scand 2009; 88(6): 639–46
Tamimi R, Lagiou P, Vatten LJ, et al. Pregnancy hormones, pre-eclampsia, and implications for breast cancer risk in the offspring. Cancer Epidemiol Biomarkers Prev 2003 Jul; 12(7): 647–50
Tulchinsky D, Korenman SG. The plasma estradiol as an index of fetoplacental function. J Clin Invest 1971 Jul; 50(7): 1490–7
Wald A, Van Thiel DH, Hoechstetter L, et al. Effect of pregnancy on gastrointestinal transit. Dig Dis Sci 1982 Nov; 27(11): 1015–8
Fu Q, VanGundy TB, Shibata S, et al. Menstrual cycle affects renal-adrenal and hemodynamic responses during prolonged standing in the postural orthostatic tachycardia syndrome. Hypertension 2010 Jul; 56(1): 82–90
Kern Jr F, Everson GT, DeMark B, et al. Biliary lipids, bile acids, and gallbladder function in the human female: effects of pregnancy and the ovulatory cycle. J Clin Invest 1981 Nov; 68(5): 1229–42
Winkel P, Gaede P, Lyngbye J. Method for monitoring plasma progesterone concentrations in pregnancy. Clin Chem 1976 Apr; 22(4): 422–8
Jones TB, Price RR, Gibbs SJ. Volumetric determination of placental and uterine growth relationships from B-mode ultrasound by serial area-volume determinations. Invest Radiol 1981 Mar–Apr; 16(2): 101–6
Geirsson RT, Ogston SA, Patel NB, et al. Growth of total intrauterine, intra-amniotic and placental volume in normal singleton pregnancy measured by ultrasound. Br J Obstet Gynaecol 1985 Jan; 92(1): 46–53
Falcon O, Wegrzyn P, Faro C, et al. Gestational sac volume measured by three-dimensional ultrasound at 11 to 13+6 weeks of gestation: relation to chromosomal defects. Ultrasound Obstet Gynecol 2005 Jun; 25(6): 546–50
Lee W, Deter RL, McNie B, et al. Quantitative and morphological assessment of early gestational sacs using three-dimensional ultrasonography. Ultrasound Obstet Gynecol 2006 Sep; 28(3): 255–60
Muller T, Sutterlin M, Pohls U, et al. Transvaginal volumetry of first trimester gestational sac: a comparison of conventional with three-dimensional ultrasound. J Perinat Med 2000; 28(3): 214–20
Steiner H, Gregg AR, Bogner G, et al. First trimester three-dimensional ultrasound volumetry of the gestational sac. Arch Gynecol Obstet 1994; 255(4): 165–70
Jirasek JE, Uher J, Uhrova M. Water and nitrogen content of the body of young human embryos. Am J Obstet Gynecol 1966 Nov 15; 96(6): 868–71
Thomson AM, Billewicz WZ, Hytten FE. The weight of the placenta in relation to birthweight. J Obstet Gynaecol Br Commonw 1969 Oct; 76(10): 865–72
Bonellie S, Chalmers J, Gray R, et al. Centile charts for birthweight for gestational age for Scottish singleton births. BMC Pregnancy Childbirth 2008; 8: 5
Abramovich DR. The volume of amniotic fluid in early pregnancy. J Obstet Gynaecol Br Commonw 1968 Jul; 75(7): 728–31
Lind T, Kendall A, Hytten FE. The role of the fetus in the formation of amniotic fluid. J Obstet Gynaecol Br Commonw 1972 Apr; 79(4): 289–98
Smith DL. Amniotic fluid volume. A measurement of the amniotic fluid present in 72 pregnancies during the first half of pregnancy. Am J Obstet Gynecol 1971 May 15; 110(2): 166–72
Clapp JF, Rizk KH, Appleby-Wineberg SK, et al. Second-trimester placental volumes predict birth weight at term. J Soc Gynecol Invest 1995 Jan–Feb; 2(1): 19–22
Hafner E, Schuchter K, van Leeuwen M, et al. Three-dimensional sonographic volumetry of the placenta and the fetus between weeks 15 and 17 of gestation. Ultrasound Obstet Gynecol 2001 Aug; 18(2): 116–20
Hertig AT, Rock J, Adams EC. A description of 34 human ova within the first 17 days of development. Am J Anat 1956 May; 98(3): 435–93
Jackson CM. On the prenatal growth of the human body and the relative growth of the various organs and parts. Am J Anat 1909; 9(1): 119–65
McKeown T, Record RG. The influence of placental size on foetal growth according to sex and order of birth. J Endocrinol 1953 Nov; 10(1): 73–81
Molteni RA, Stys SJ, Battaglia FC. Relationship of fetal and placental weight in human beings: fetal/placental weight ratios at various gestational ages and birth weight distributions. J Reproduct Med 1978 Nov; 21(5): 327–34
Osei EK, Faulkner K. Fetal position and size data for dose estimation. Br J Radiol 1999 Apr; 72(856): 363–70
Verburg BO, Jaddoe VW, Wladimiroff JW, et al. Fetal hemodynamic adaptive changes related to intrauterine growth: the Generation R Study. Circulation 2008 Feb 5; 117(5): 649–59
Mayhew TM, Sorensen FB, Klebe JG, et al. The effects of mode of delivery and sex of newborn on placental morphology in control and diabetic pregnancies. J Anat 1993 Dec; 183(Pt 3): 545–52
Wilcox M, Gardosi J, Mongelli M, et al. Birth weight from pregnancies dated by ultrasonography in a multicultural British population. BMJ 1993 Sep 4; 307(6904): 588–91
Wolf H, Oosting H, Treffers PE. Placental volume measurement by ultrasonography: evaluation of the method. Am J Obstet Gynecol 1987 May; 156(5): 1191–4
Hellman LM, Kobayashi M, Tolles WE, et al. Ultrasonic studies on the volumetric growth of the human placenta. Am J Obstet Gynecol 1970 Nov 1; 108(5): 740–50
Bozkurt N, Basgul Yigiter A, Gokaslan H, et al. Correlations of fetal-maternal outcomes and first trimester 3-D placental volume/3-D power Doppler calculations. Clin Exp Obstet Gynecol 2010; 37(1): 26–8
Bujold E, Effendi M, Girard M, et al. Reproducibility of first trimester three-dimensional placental measurements in the evaluation of early placental insufficiency. J Obstet Gynaecol Can 2009 Dec; 31(12): 1144–8
Howe D, Wheeler T, Perring S. Measurement of placental volume with real-time ultrasound in mid-pregnancy. J Clin Ultrasound 1994 Feb; 22(2): 77–83
Pardi G, Cetin I. Human fetal growth and organ development: 50 years of discoveries. Am J Obstet Gynecol 2006 Apr; 194(4): 1088–99
Perry IJ, Beevers DG, Whincup PH, et al. Predictors of ratio of placental weight to fetal weight in multiethnic community. BMJ 1995 Feb 18; 310(6977): 436–9
Wegrzyn P, Faro C, Falcon O, et al. Placental volume measured by three-dimensional ultrasound at 11 to 13+6 weeks of gestation: relation to chromosomal defects. Ultrasound Obstet Gynecol 2005 Jul; 26(1): 28–32
Wolf H, Oosting H, Treffers PE. Second-trimester placental volume measurement by ultrasound: prediction of fetal outcome. Am J Obstet Gynecol 1989 Jan; 160(1): 121–6
Rhodes P. The volume of liquor amnii in early pregnancy. J Obstet Gynaecol Br Commonw 1966 Feb; 73(1): 23–6
Fuchs F. Volume of amniotic fluid at various stages of pregnancy. Clin Obstet Gynecol 1966 Jun; 9(2): 449–60
Charles D, Jacoby HE, Burgess F. Amniotic fluid volumes in the second half of pregnancy. Am J Obstet Gynecol 1965 Dec 1; 93(7): 1042–7
Elliott PM, Inman WH. Volume of liquor amnii in normal and abnormal pregnancy. Lancet 1961 Oct 14; 2(7207): 835–40
Gadd RL. The volume of the liquor amnii. Proc. Royal Soc Med 1966 Nov; 59(11 Part 1): 1131–3
Gillibrand PN. Changes in amniotic fluid volume with advancing pregnancy. J Obstet Gynaecol Br Commonw 1969 Jun; 76(6): 527–9
Lind T, Hytten FE. Relation of amniotic fluid volume to fetal weight in the first half of pregnancy. Lancet 1970 May 30; 1(7657): 1147–9
Office for National Statistics. Conception statistics, England and Wales, 2008 [online]. Available from URL: http://www.ons.gov.uk [Accessed 2012 Mar 16]
Macfarlane A, Mugford M. Birth counts: statistics of pregnancy and childbirth. 2nd ed. London: The Stationery Office, 2000
Chow YH, Dattani N. Estimating conception statistics using gestational age information from NHS Numbers for Babies data. Health Stat Q 2009 Spring; (41): 21–7
Papageorghiou AT, Bakoulas V, Sebire NJ, et al. Intrauterine growth in multiple pregnancies in relation to fetal number, chorionicity and gestational age. Ultrasound Obstet Gynecol 2008 Dec; 32(7): 890–3
Bergsjo P, Denman DW, Hoffman HJ, et al. Duration of human singleton pregnancy: a population-based study. Acta Obstet Gynecol Scand 1990; 69(3): 197–207
NHS Maternity Statistics. Live born singleton taking place in NHS hospitals in England during 2009–2010 [online]. Available from URL: http://www.hesonline.nhs.uk [Accessed 2011 Mar]
Rasmussen K, Yaktine A, editors. Weight gain during pregnancy: reexamining the guidelines. Washington, DC: National Academies Press, 2009
Billewicz WC, Thomson AM. Clinical significance of weight trends during pregnancy. Br Med J 1957 Feb 2; 1(5013): 243–7
Institute of Medicine. Nutrition during pregnancy. Washington, DC: National Academies Press, 1990
Cedergren M. Effects of gestational weight gain and body mass index on obstetric outcome in Sweden. Int J Gynaecol Obstet 2006 Jun; 93(3): 269–74
Nohr EA, Bech BH, Vaeth M, et al. Obesity, gestational weight gain and preterm birth: a study within the Danish National Birth Cohort. Paediatr Perinat Epidemiol 2007 Jan; 21(1): 5–14
Schubring C, Englaro P, Siebler T, et al. Longitudinal analysis of maternal serum leptin levels during pregnancy, at birth and up to six weeks after birth: relation to body mass index, skinfolds, sex steroids and umbilical cord blood leptin levels. Hormone Res 1998; 50(5): 276–83
Okereke NC, Huston-Presley L, Amini SB, et al. Longitudinal changes in energy expenditure and body composition in obese women with normal and impaired glucose tolerance. Am J Physiol Endocrinol Metab 2004 Sep; 287(3): E472–9
Lederman SA. Pregnancy. In: Hyeymsfield SB, Lohman TG, Wang Z, et al., editors. Human body composition. 2nd ed. Champaign (IL): Human Kinetics, 2005: 299–312
Lederman SA, Pierson Jr RN, Wang J, et al. Body composition measurements during pregnancy. Basic Life Sci 1993; 60: 193–5
van Raaij JM, Peek ME, Vermaat-Miedema SH, et al. New equations for estimating body fat mass in pregnancy from body density or total body water. Am J Clin Nutr 1988 Jul; 48(1): 24–9
Duffus GM, MacGillivray I, Dennis KJ. The relationship between baby weight and changes in maternal weight, total body water, plasma volume, electrolytes and proteins and urinary estriol excretion. J Obstet Gynecol Br Commonw 1971; 78: 97–104
Stachenfeld NS, Taylor HS. Progesterone increases plasma volume independent of estradiol. J Appl Physiol 2005 Jun; 98(6): 1991–7
Simmons LA, Gillin AG, Jeremy RW. Structural and functional changes in left ventricle during normotensive and preeclamptic pregnancy. Am J Physiol Heart Circ Physiol 2002 Oct; 283(4): H1627–33
Hunter S, Robson SC. Adaptation of the maternal heart in pregnancy. Br Heart J 1992 Dec; 68(6): 540–3
Ueland K, Novy MJ, Peterson EN, et al. Maternal cardiovascular dynamics. IV: the influence of gestational age on the maternal cardiovascular response to posture and exercise. Am J Obstet Gynecol 1969 Jul 15; 104(6): 856–64
Brown MA, Gallery ED. Volume homeostasis in normal pregnancy and pre-eclampsia: physiology and clinical implications. Bailliere’s Clin Obstet Gynaecol 1994 Jun; 8(2): 287–310
Lee W. Cardiorespiratory alterations during normal pregnancy. Crit Care Clin 1991 Oct; 7(4): 763–75
Katz R, Karliner JS, Resnik R. Effects of a natural volume overload state (pregnancy) on left ventricular performance in normal human subjects. Circulation 1978 Sep; 58(3 Pt 1): 434–41
Mabie WC, DiSessa TG, Crocker LG, et al. A longitudinal study of cardiac output in normal human pregnancy. Am J Obstet Gynecol 1994 Mar; 170(3): 849–56
Desai DK, Moodley J, Naidoo DP. Echocardiographic assessment of cardiovascular hemodynamics in normal pregnancy. Obstet Gynecol 2004 Jul; 104(1): 20–9
van Oppen AC, van der Tweel I, Alsbach GP, et al. A longitudinal study of maternal hemodynamics during normal pregnancy. Obstet Gynecol 1996 Jul; 88(1): 40–6
Lees MM, Scott DB, Kerr MG, et al. The circulatory effects of recumbent postural change in late pregnancy. Clin Sci 1967 Jun; 32(3): 453–65
Kinsella SM, Lee A, Spencer JA. Maternal and fetal effects of the supine and pelvic tilt positions in late pregnancy. Eur J Obstet Gynecol Reprod Biol 1990 Jul–Aug; 36(1–2): 11–7
Fujitani S, Baldisseri MR. Hemodynamic assessment in a pregnant and peripartum patient. Crit Care Med 2005 Oct; 33 (10 Suppl.): S354–61
Faupel-Badger JM, Hsieh CC, Troisi R, et al. Plasma volume expansion in pregnancy: implications for biomarkers in population studies. Cancer Epidemiol Biomarkers Prev 2007 Sep; 16(9): 1720–3
Metcalfe J, Ueland K. Maternal cardiovascular adjustments to pregnancy. Prog Cardiovasc Dis 1974 Jan–Feb; 16(4): 363–74
Chesley LC. Plasma and red cell volumes during pregnancy. Am J Obstet Gynecol 1972 Feb 1; 112(3): 440–50
Jepson JH. Endocrine control of maternal and fetal erythropoiesis. Can Med Assoc J 1968 May 4; 98(18): 844–7
Ervasti M, Kotisaari S, Heinonen S, et al. Elevated serum erythropoietin concentration is associated with coordinated changes in red blood cell and reticulocyte indices of pregnant women at term. Scand J Clin Lab Invest 2008; 68(2): 160–5
Jepson JH, Lowenstein L. Inhibition of the stem-cell action of erythropoietin by estradiol. Proc Soc Exp Biol Med 1966 Nov; 123(2): 457–60
Jepson JH, Lowenstein L. Role of erythropoietin and placental lactogen in the control of erythropoiesis during pregnancy. Can J Physiol Pharmacol 1968 Jul; 46(4): 573–6
Jepson JH, McGarry EE, Lowenstein L. Erythropoietin excretion in a hypopituitary patient: effects of testosterone and vasopressin. Arch Int Med 1968 Sep; 122(3): 265–70
Mukundan H, Resta TC, Kanagy NL. 17-Beta estradiol independently regulates erythropoietin synthesis and NOS activity during hypoxia. J Cardiovasc Pharmacol 2004 Feb; 43(2): 312–7
Otto SJ, van Houwelingen AC, Badart-Smook A, et al. Changes in the maternal essential fatty acid profile during early pregnancy and the relation of the profile to diet. Am J Clin Nutr 2001 Feb; 73(2): 302–7
Ulmsten U, Sundstrom G. Esophageal manometry in pregnant and non-pregnant women. Am J Obstet Gynecol 1978 Oct 1; 132(3): 260–4
Van Thiel DH, Gavaler JS, Joshi SN, et al. Heartburn of pregnancy. Gastroenterology 1977 Apr; 72(4 Pt 1): 666–8
O’Sullivan GM, Bullingham RE. The assessment of gastric acidity and antacid effect in pregnant women by a non-invasive radiotelemetry technique. Br J Obstet Gynaecol 1984 Oct; 91(10): 973–8
Dawes M, Chowienczyk PJ. Drugs in pregnancy. Pharmacokinetics in pregnancy. Best Pract Res 2001 Dec; 15(6): 819–26
Wong CA, Loffredi M, Ganchiff JN, et al. Gastric emptying of water in term pregnancy. Anesthesiology 2002 Jun; 96(6): 1395–400
Chiloiro M, Darconza G, Piccioli E, et al. Gastric emptying and orocecal transit time in pregnancy. J Gastroenterol 2001 Aug; 36(8): 538–43
Macfie AG, Magides AD, Richmond MN, et al. Gastric emptying in pregnancy. Br J Anaesth 1991 Jul; 67(1): 54–7
Whitehead EM, Smith M, Dean Y, et al. An evaluation of gastric emptying times in pregnancy and the puerperium. Anaesthesia 1993 Jan; 48(1): 53–7
Braverman DZ, Johnson ML, Kern Jr F. Effects of pregnancy and contraceptive steroids on gallbladder function. N Engl J Med 1980 Feb 14; 302(7): 362–4
Van Bodegraven AA, Bohmer CJ, Manoliu RA, et al. Gallbladder contents and fasting gallbladder volumes during and after pregnancy. Scand J Gastroenterol 1998 Sep; 33(9): 993–7
Kapicioglu S, Gurbuz S, Danalioglu A, et al. Measurement of gallbladder volume with ultrasonography in pregnant women. Can J Gastroenterol 2000 May; 14(5): 403–5
Hahm JS, Park JY, Song SC, et al. Gallbladder motility change in late pregnancy and after delivery. Korean J Intern Med 1997 Jan; 12(1): 16–20
Bacq Y, Zarka O, Brechot JF, et al. Liver function tests in normal pregnancy: a prospective study of 103 pregnant women and 103 matched controls. Hepatology 1996 May; 23(5): 1030–4
Jamjute P, Ahmad A, Ghosh T, et al. Liver function test and pregnancy. J Matern Fetal Neonatal Med 2009 Mar; 22(3): 274–83
Knox TA. Evaluation of abnormal liver function in pregnancy. Semin Perinatol 1998 Apr; 22(2): 98–103
Tindall VR. The liver in pregnancy. Clin Obstet Gynaecol 1975; 2(2): 441–62
Munnell EW, Taylor HC. Liver blood flow in pregnancy-hepatic vein catheterization. J Clin Invest 1947 Sep; 26(5): 952–6
Clapp JF, Stepanchak W, Tomaselli J, et al. Portal vein blood flow-effects of pregnancy, gravity, and exercise. Am J Obstet Gynecol 2000 Jul; 183(1): 167–72
Roobottom CA, Hunter JD, Weston MJ, et al. Hepatic venous Doppler waveforms: changes in pregnancy. J Clin Ultrasound 1995 Oct; 23(8): 477–82
Gyselaers W, Molenberghs G, Mesens T, et al. Maternal hepatic vein Doppler velocimetry during uncomplicated pregnancy and pre-eclampsia. Ultrasound Med Biol 2009 Aug; 35(8): 1278–83
Lui EY, Steinman AH, Cobbold RS, et al. Human factors as a source of error in peak Doppler velocity measurement. J Vasc Surg 2005 Nov; 42(5): 972–9
Yzet T, Bouzerar R, Allart JD, et al. Hepatic vascular flow measurements by phase contrast MRI and doppler echography: a comparative and reproducibility study. J Magn Reson Imaging 2010 Mar; 31(3): 579–88
Mesens T, Tomsin K, Molenberghs G, et al. Reproducibility and repeatability of maternal venous Doppler flow measurements in renal interlobar and hepatic veins. Ultrasound Obstet Gynecol 2010 Jul; 36(1): 120–1
Hogstedt S, Lindberg B, Rane A. Increased oral clearance of metoprolol in pregnancy. Eur J Clin Pharmacol 1983; 24(2): 217–20
Hogstedt S, Rane A. Plasma concentration-effect relationship of metoprolol during and after pregnancy. Eur J Clin Pharmacol 1993; 44(3): 243–6
Sandstrom B, Lindeberg S, Lundborg P, et al. Disposition of the adrenergic blocker metoprolol in the late pregnant women, the amniotic fluid, the cord blood and the neonate. Clin Exp Hypertension 1983; 2(1): 75–82
Wadelius M, Darj E, Frenne G, et al. Induction of CYP2D6 in pregnancy. Clin Pharmacol Ther 1997 Oct; 62(4): 400–7
Abduljalil K, Frank D, Gaedigk A, et al. Assessment of activity levels for CYP2D6*1, CYP2D6*2, and CYP2D6*41 genes by population pharmaco-kinetics of dextromethorphan. Clin Pharmacol Ther 2010 Nov; 88(5): 643–51
Jeong H, Choi S, Song JW, et al. Regulation of UDP-glucuronosyltransferase (UGT) 1A1 by progesterone and its impact on labetalol elimination. Xenobiotica 2008 Jan; 38(1): 62–75
Urquhart BL, Tirona RG, Kim RB. Nuclear receptors and the regulation of drug-metabolizing enzymes and drug transporters: implications for inter-individual variability in response to drugs. J Clin Pharmacol 2007 May; 47(5): 566–78
Aldridge A, Bailey J, Neims AH. The disposition of caffeine during and after pregnancy. Semin Perinatol 1981 Oct; 5(4): 310–4
Brazier JL, Ritter J, Berland M, et al. Pharmacokinetics of caffeine during and after pregnancy. Dev Pharmacol Ther 1983; 6(5): 315–22
Knutti R, Rothweiler H, Schlatter C. Effect of pregnancy on the pharmacokinetics of caffeine. Eur J Clin Pharmacol 1981; 21(2): 121–6
Gardner MJ, Schatz M, Cousins L, et al. Longitudinal effects of pregnancy on the pharmacokinetics of theophylline. Eur J Clin Pharmacol 1987; 32(3): 289–95
Dempsey D, Jacob 3rd P, Benowitz NL. Accelerated metabolism of nicotine and cotinine in pregnant smokers. J Pharmacol Exp Ther 2002 May; 301(2): 594–8
Lander CM, Smith MT, Chalk JB, et al. Bioavailability and pharmacokinetics of phenytoin during pregnancy. Eur J Clin Pharmacol 1984; 27(1): 105–10
Dickinson RG, Hooper WD, Wood B, et al. The effect of pregnancy in humans on the pharmacokinetics of stable isotope labelled phenytoin. Br J Clin Pharmacol 1989 Jul; 28(1): 17–27
Hebert MF, Ma X, Naraharisetti SB, et al. Are we optimizing gestational diabetes treatment with glyburide? The pharmacologic basis for better clinical practice. Clin Pharmacol Ther 2009 Jun; 85(6): 607–14
McGready R, Stepniewska K, Seaton E, et al. Pregnancy and use of oral contraceptives reduces the biotransformation of proguanil to cycloguanil. Eur J Clin Pharmacol 2003 Oct; 59(7): 553–7
Wangboonskul J, White NJ, Nosten F, et al. Single dose pharmacokinetics of proguanil and its metabolites in pregnancy. Eur J Clin Pharmacol 1993; 44(3): 247–51
Heikkinen T, Ekblad U, Palo P, et al. Pharmacokinetics of fluoxetine and norfluoxetine in pregnancy and lactation. Clin Pharmacol Ther 2003 Apr; 73(4): 330–7
Heikkinen T, Ekblad U, Kero P, et al. Citalopram in pregnancy and lactation. Clin Pharmacol Ther 2002 Aug; 72(2): 184–91
Buchanan ML, Easterling TR, Carr DB, et al. Clonidine pharmacokinetics in pregnancy. Drug Metab Dispos 2009 Apr; 37(4): 702–5
Kanto J, Sjovall S, Erkkola R, et al. Placental transfer and maternal midazolam kinetics. Clin Pharmacol Ther 1983 Jun; 33(6): 786–91
Prevost RR, Akl SA, Whybrew WD, et al. Oral nifedipine pharmacokinetics in pregnancy-induced hypertension. Pharmacotherapy 1992; 12(3): 174–7
Jarvis MA, Wu-Pong S, Kniseley JS, et al. Alterations in methadone metabolism during late pregnancy. J Addict Dis 1999; 18(4): 51–61
Wolff K, Boys A, Rostami-Hodjegan A, et al. Changes to methadone clearance during pregnancy. Eur J Clin Pharmacol 2005 Nov; 61(10): 763–8
Hardman J, Endres L, Fischer P, et al. Pharmacokinetics of labetalol in pregnancy. Pharmacotherapy 2005; 25(10): 1493
Fotopoulou C, Kretz R, Bauer S, et al. Prospectively assessed changes in lamotrigine-concentration in women with epilepsy during pregnancy, lactation and the neonatal period. Epilepsy Res 2009 Jul; 85(1): 60–4
Franco V, Mazzucchelli I, Gatti G, et al. Changes in lamotrigine pharmacokinetics during pregnancy and the puerperium. Ther Drug Monit 2008 Aug; 30(4): 544–7
Tran TA, Leppik IE, Blesi K, et al. Lamotrigine clearance during pregnancy. Neurology 2002 Jul 23; 59(2): 251–5
Rostami-Hodjegan A, Kroemer HK, Tucker GT. In-vivo indices of enzyme activity: the effect of renal impairment on the assessment of CYP2D6 activity. Pharmacogenetics 1999 Jun; 9(3): 277–86
Johnson TN, Tucker GT, Rostami-Hodjegan A. Development of CYP2D6 and CYP3A4 in the first year of life. Clin Pharmacol Ther 2008 May; 83(5): 670–1
Anderson GD, Carr DB. Effect of pregnancy on the pharmacokinetics of antihypertensive drugs. Clin Pharmacokinet 2009; 48(3): 159–68
Anderson GD. Using pharmacokinetics to predict the effects of pregnancy and maternal-infant transfer of drugs during lactation. Expert Opin Drug Metab Toxicol 2006 Dec; 2(6): 947–60
Lind AB, Wadelius M, Darj E, et al. Gene expression of cytochrome P450 1B1 and 2D6 in leukocytes in human pregnancy. Pharmacol Toxicol 2003 Jun; 92(6): 295–9
Christensen T, Klebe JG, Bertelsen V, et al. Changes in renal volume during normal pregnancy. Acta Obstet Gynecol Scand 1989; 68(6): 541–3
Bailey RR, Rolleston GL. Kidney length and ureteric dilatation in the puerperium. J Obstet Gynaecol Br Commonw 1971 Jan; 78(1): 55–61
Davison JM. The effect of pregnancy on kidney function in renal allograft recipients. Kidney Int 1985 Jan; 27(1): 74–9
Conrad KP. Emerging role of relaxin in the maternal adaptations to normal pregnancy: implications for preeclampsia. Semin Nephrol 2011 Jan; 31(1): 15–32
Fried AM, Woodring JH, Thompson DJ. Hydronephrosis of pregnancy: a prospective sequential study of the course of dilatation. J Ultrasound Med 1983 Jun; 2(6): 255–9
Grenier N, Pariente JL, Trillaud H, et al. Dilatation of the collecting system during pregnancy: physiologic vs obstructive dilatation. Eur Radiol 2000; 10(2): 271–9
Hebert MF, Carr DB, Anderson GD, et al. Pharmacokinetics and pharmacodynamics of atenolol during pregnancy and postpartum. J Clin Pharmacol 2005 Jan; 45(1): 25–33
Oatridge A, Holdcroft A, Saeed N, et al. Change in brain size during and after pregnancy: study in healthy women and women with preeclampsia. Am J Neuroradiol 2002 Jan; 23(1): 19–26
McCall M. Cerebral blood flow and metabolism in toxemias of pregnancy. Surg Gynecol Obstet 1949 Dec; 89(6): 715–21, illust
Benacerraf BR, Shipp TD, Lyons JG, et al. Width of the normal uterine cavity in premenopausal women and effect of parity. Obstet Gynecol 2010 Aug; 116(2 Pt 1): 305–10
ICPR. International Commission on Radiological Protection. Report of the Task Group on Reference Man. Oxford: Pergammon Press, 1975. ICRP publication no. 23
Milligan D, Drife JO, Short RV. Changes in breast volume during normal menstrual cycle and after oral contraceptives. Br Med J 1975 Nov 29; 4(5995): 494–6
Hegenbart L, Na YH, Zhang JY, et al. A Monte Carlo study of lung counting efficiency for female workers of different breast sizes using deformable phantoms. Phys Med Biol 2008 Oct 7; 53(19): 5527–38
Loughry CW, Sheffer DB, Price TE, et al. Breast volume measurement of 598 women using biostereometric analysis. Ann Plast Surg 1989 May; 22(5): 380–5
Malini S, Smith EO, Goldzieher JW. Measurement of breast volume by ultrasound during normal menstrual cycles and with oral contraceptive use. Obstet Gynecol 1985 Oct; 66(4): 538–41
Pickles VR. Blood-flow estimations as indices of mammary activity. J Obstet Gynaecol Br Emp 1953 Jun; 60(3): 301–11
Burd LI, Dorin M, Philipose V, et al. The relationship of mammary temperature to parturition in human subjects. Am J Obstet Gynecol 1977 Jun 1; 128(3): 272–8
Sambrook M, Bamber JC, Minasian H, et al. Ultrasonic Doppler study of the hormonal response of blood flow in the normal human breast. Ultrasound Med Biol 1987 Mar; 13(3): 121–9
Jensen D, Webb KA, O’Donnell DE. Chemical and mechanical adaptations of the respiratory system at rest and during exercise in human pregnancy. Appl Physiol Nutr Metab 2007 Dec; 32(6): 1239–50
Hegewald MJ, Crapo RO. Respiratory physiology in pregnancy. Clin Chest Med 2011 Mar; 32(1): 1–13
Elkus R, Popovich Jr J. Respiratory physiology in pregnancy. Clin Chest Med 1992 Dec; 13(4): 555–65
Contreras G, Gutierrez M, Beroiza T, et al. Ventilatory drive and respiratory muscle function in pregnancy. Am Rev Respir Dis 1991 Oct; 144(4): 837–41
McAuliffe F, Kametas N, Costello J, et al. Respiratory function in singleton and twin pregnancy. BJOG 2002 Jul; 109(7): 765–9
Gardner MO, Doyle NM. Asthma in pregnancy. Obstet Gynecol Clin North Am 2004 Jun; 31(2): 385–413, vii
Spatling L, Fallenstein F, Huch A, et al. The variability of cardiopulmonary adaptation to pregnancy at rest and during exercise. Br J Obstet Gynaecol 1992 Jul; 99 Suppl. 8: 1–40
Rees GB, Broughton Pipkin F, Symonds EM, et al. A longitudinal study of respiratory changes in normal human pregnancy with cross-sectional data on subjects with pregnancy-induced hypertension. Am J Obstet Gynecol 1990 Mar; 162(3): 826–30
Knuttgen HG, Emerson Jr K. Physiological response to pregnancy at rest and during exercise. J Appl Physiol 1974 May; 36(5): 549–53
Pernoll ML, Metcalfe J, Kovach PA, et al. Ventilation during rest and exercise in pregnancy and postpartum. Respir Physiol 1975 Dec; 25(3): 295–310
Pernoll ML, Metcalfe J, Schlenker TL, et al. Oxygen consumption at rest and during exercise in pregnancy. Respir Physiol 1975 Dec; 25(3): 285–93
Emerson Jr K, Saxena BN, Poindexter EL. Caloric cost of normal pregnancy. Obstet Gynecol 1972 Dec; 40(6): 786–94
De Swiet M. The respiratory system. 2nd ed. Oxford: Blackwell Science Ltd, 1991
Bronstein MN, Mak RP, King JC. Unexpected relationship between fat mass and basal metabolic rate in pregnant women. Br J Nutr 1996 May; 75(5): 659–68
Liu JH. Endocrinology of pregnancy. In: Creasy RK, Resnik R, Iams JD, editors. Maternal-fetal medicine: principles and practice. 5th ed. Philadelphia (PA): Saunders, 2004: 121–34
Holmdahl TH, Johansson ED, Wide L. The site of progesterone production in early pregnancy. Acta Endocrinol 1971 Jun; 67(2): 353–61
Bernstein L, Lipworth L, Ross RK, et al. Correlation of estrogen levels between successive pregnancies. Am J Epidemiol 1995 Sep 15; 142(6): 625–8
Blackburn ST. Fetal, and neonatal physiology: a clinical perspective. 3rd ed. St Louis (MO): Saunders, 2007
Hytten F, Chamberlain G. Clinical physiology in obstetrics. 2nd ed. Oxford: Blackwell Scientific, 1980
Berghout A, Endert E, Ross A, et al. Thyroid function and thyroid size in normal pregnant women living in an iodine replete area. Clin Endocrinol 1994 Sep; 41(3): 375–9
Fister P, Gaberscek S, Zaletel K, et al. Thyroid volume changes during pregnancy and after delivery in an iodine-sufficient Republic of Slovenia. Eur J Obstet Gynecol Reproduct Biol 2009 Jul; 145(1): 45–8
Vila L, Legaz G, Barrionuevo C, et al. Iodine status and thyroid volume changes during pregnancy: results of a survey in Aran Valley (Catalan Pyrenees). J Endocrinol Invest 2008 Oct; 31(10): 851–5
Antonangeli L, Maccherini D, Cavaliere R, et al. Comparison of two different doses of iodide in the prevention of gestational goiter in marginal iodine deficiency: a longitudinal study. Eur J Endocrinol 2002 Jul; 147(1): 29–34
Kumari R, Jaisankar TJ, Thappa DM. A clinical study of skin changes in pregnancy. Indian J Dermatol Venereol Leprol 2007 Mar–Apr; 73(2): 141
Muallem MM, Rubeiz NG. Physiological and biological skin changes in pregnancy. Clinics Dermatol 2006 Mar–Apr; 24(2): 80–3
Wade TR, Wade SL, Jones HE. Skin changes and diseases associated with pregnancy. Obstet Gynecol 1978 Aug; 52(2): 233–42
Ginsburg J, Duncan SL. Peripheral blood flow in normal pregnancy. Cardiovascular Res 1967 Apr; 1(2): 132–7
Beinder E, Huch A, Huch R. Peripheral skin temperature and micro-circulatory reactivity during pregnancy: a study with thermography. J Perinatal Med 1990; 18(5): 383–90
Ashton H. Cigarette smoking in pregnancy: differences in peripheral circulation between smokers and non-smokers. Br J Obstet Gynaecol 1975 Nov; 82(11): 868–81
Katz M, Sokal MM. Skin perfusion in pregnancy. Am J Obstet Gynecol 1980 May 1; 137(1): 30–3
de Mul FF, Blaauw J, Aarnoudse JG, et al. Diffusion model for iontophoresis measured by laser-Doppler perfusion flowmetry, applied to normal and preeclamptic pregnancies. J Biomed Optics 2007 Jan–Feb; 12(1): 014032
Pitkin RM. Nutritional support in obstetrics and gynecology. Clin Obstet Gynecol 1976 Sep; 19(3): 489–513
Rodeck CH, Whittle MJ. Fetal medicine: basic science and clinical practice. 2nd ed. Oxford: Churchill Livingstone, 2008
Friis-Hansen B. The body density of newborn infants. Acta Paediatrica 1963 Sep; 52: 513–21
Levine D. Three-dimensional fetal MR imaging: will it fulfill its promise? Radiology 2001 May; 219(2): 313–5
Luecke RH, Wosilait WD, Young JF. Mathematical modeling of human embryonic and fetal growth rates. Growth Dev Aging 1999 Spring-Summer; 63(1–2): 49–59
Wosilait WD, Luecke RH, Young JF. A mathematical analysis of human embryonic and fetal growth data. Growth Dev Aging 1992 Winter; 56(4): 249–57
Wilcox MA, Johnson IR, Maynard PV, et al. The individualised birthweight ratio: a more logical outcome measure of pregnancy than birthweight alone. Br J Obstet Gynaecol 1993 Apr; 100(4): 342–7
Blair EM, Liu Y, de Klerk NH, et al. Optimal fetal growth for the Caucasian singleton and assessment of appropriateness of fetal growth: an analysis of a total population perinatal database. BMC Pediatrics 2005; 5(1): 13
Bertino E, Di Battista E, Bossi A, et al. Fetal growth velocity: kinetic, clinical, and biological aspects. Arch Dis Child 1996 Jan; 74(1): F10–5
Enders AC, Blankenship TN. Comparative placental structure. Adv Drug Deliv Rev 1999 Jun 14; 38(1): 3–15
Jones CJ, Fox H. Ultrastructure of the normal human placenta. Electron Microsc Rev 1991; 4(1): 129–78
Stoz F, Schuhmann RA, Schebesta B. The development of the placental villus during normal pregnancy: morphometric data base. Arch Gynecol Obstet 1988; 244(1): 23–32
Pollex EK, Hutson JR. Genetic polymorphisms in placental transporters: implications for fetal drug exposure to oral antidiabetic agents. Expert Opin Drug Metab Toxicol 2011 Mar; 7(3): 325–39
Prouillac C, Lecoeur S. The role of the placenta in fetal exposure to xenobiotics: importance of membrane transporters and human models for transfer studies. Drug Metab Dispos 2010 Oct; 38(10): 1623–35
Zharikova OL, Fokina VM, Nanovskaya TN, et al. Identification of the major human hepatic and placental enzymes responsible for the biotransformation of glyburide. Biochem Pharmacol 2009 Dec 15; 78(12): 1483–90
Ceckova-Novotna M, Pavek P, Staud F. P-glycoprotein in the placenta: expression, localization, regulation and function. Reproduct Toxicol 2006 Oct; 22(3): 400–10
Syme MR, Paxton JW, Keelan JA. Drug transfer and metabolism by the human placenta. Clin Pharmacokinet 2004; 43(8): 487–514
Hakkola J, Pelkonen O, Pasanen M, et al. Xenobiotic-metabolizing cytochrome P450 enzymes in the human feto-placental unit: role in intrauterine toxicity. Crit Rev Toxicol 1998 Jan; 28(1): 35–72
Kuhlmann RS, Warsof S. Ultrasound of the placenta. Clin Obstet Gynecol 1996 Sep; 39(3): 519–34
Younoszai MK, Haworth JC. Chemical composition of the placenta in normal preterm, term, and intrauterine growth-retarded infants. Am J Obstet Gynecol 1969 Jan 15; 103(2): 262–4
Younoszai MK, Haworth JC. Placental dimensions and relations in preterm, term, and growth-retarded infants. Am J Obstet Gynecol 1969 Jan 15; 103(2): 265–71
Garrow JS. The relationship of foetal growth to size and composition of the placenta. Proc Royal Soc Med 1970 May; 63(5): 498–500
Leary SD, Godfrey KM, Greenaway LJ, et al. Contribution of the umbilical cord and membranes to untrimmed placental weight. Placenta 2003 Feb–Mar; 24(2–3): 276–8
Yao AC, Moinian M, Lind J. Distribution of blood between infant and placenta after birth. Lancet 1969 Oct 25; 2(7626): 871–3
Brace RA. Progress toward understanding the regulation of amniotic fluid volume: water and solute fluxes in and through the fetal membranes. Placenta 1995 Jan; 16(1): 1–18
Wagner G, Fuchs F. The volume of amniotic fluid in the first half of human pregnancy. J Obstet Gynaecol Br Empire 1962 Feb; 69: 131–6
Touboul C, Boulvain M, Picone O, et al. Normal fetal urine production rate estimated with 3-dimensional ultrasonography using the rotational technique (virtual organ computer-aided analysis). Am J Obstet Gynecol 2008 Jul; 199(1): 57e1–5
Garby L. Studies on transfer of matter across membranes with special reference to the isolated human amniotic membrane and the exchange of amniotic fluid. Acta Physiol Scand 1957; 40(137): 1–84
Dildy GA, Lira N, Moise Jr KJ, et al. Amniotic fluid volume assessment: comparison of ultrasonographic estimates versus direct measurements with a dye-dilution technique in human pregnancy. Am J Obstet Gynecol 1992 Oct; 167(4 Pt 1): 986–94
Gramellini D, Fieni S, Verrotti C, et al. Ultrasound evaluation of amniotic fluid volume: methods and clinical accuracy. Acta Biomed 2004; 75 Suppl. 1: 40–4
Lukaski HC. Methods for the assessment of human body composition: traditional and new. Am J Clin Nutr 1987 Oct; 46(4): 537–56
Siri WE. Gross composition of the body. In: Tobias CA, Lawrence JH, editors. Advances in biological and medical physics. New York: Academic, 1956: 239–80
Hopkinson JM, Butte NF, Ellis KJ, et al. Body fat estimation in late pregnancy and early postpartum: comparison of two-, three-, and four-component models. Am J Clin Nutr 1997 Feb; 65(2): 432–8
Acknowledgements
This project was funded by an FSA (Food Standards Agency) grant (T01065) of the UK Government. We thank Mr James Kay for assistance with collecting the references and preparation of the manuscript. We also would like to thank Mrs Melanie Gee (Information Scientist from Learning and Information Services, Sheffield Hallam University) for her help in developing and running the literature search strategies. The authors have no conflicts of interest that are directly relevant to the content of this study.
Author information
Authors and Affiliations
Corresponding author
Electronic Supplementary Material
Rights and permissions
About this article
Cite this article
Abduljalil, K., Furness, P., Johnson, T.N. et al. Anatomical, Physiological and Metabolic Changes with Gestational Age during Normal Pregnancy. Clin Pharmacokinet 51, 365–396 (2012). https://doi.org/10.2165/11597440-000000000-00000
Published:
Issue Date:
DOI: https://doi.org/10.2165/11597440-000000000-00000