
Abstract
Purpose
The diagnosis of prosthetic valve (PV) infective endocarditis (IE) and infection of cardiac implantable electronic devices (CIEDs) remains challenging. The aim of this study was to assess the usefulness of 18F-FDG PET/CT in these patients and analyse the interpretation criteria.
Methods
We included 41 patients suspected of having IE by the Duke criteria who underwent 18F-FDG PET/CT. The criteria applied for classifying the findings as positive/negative for IE were: (a) visual analysis of only PET images with attenuation-correction (AC PET images); (b) visual analysis of both AC PET images and PET images without AC (NAC PET images); (c) qualitative analysis of NAC PET images; and (d) semiquantitative analysis of AC PET images. 18F-FDG PET/CT was considered positive for IE independently of the intensity and distribution of FDG uptake. The gold standard was the Duke pathological criteria (if tissue was available) or the decision of an endocarditis expert team after a minimum 4 months follow-up.
Results
We studied 62 areas with suspicion of IE, 28 areas (45 %) showing definite IE and 34 (55 %) showing possible IE. Visual analysis of only AC PET images showed poor diagnostic accuracy (sensitivity 20 %, specificity 57 %). Visual analysis of both AC PET and NAC PET images showed excellent sensitivity (100 %) and intermediate specificity (73 %), focal uptake being more frequently associated with IE. The accuracy of qualitative analysis of NAC PET images depended on the threshold: the maximum sensitivity, specificity and accuracy achieved were 88 %, 80 %, 84 %, respectively. In the semiquantitative analysis of AC PET images, SUVmax was higher in areas of confirmed IE than in those without IE (∆SUVmax 2.2, p < 0.001). When FDG uptake was twice that in the liver, IE was always confirmed, and SUVmax 5.5 was the optimal threshold for IE diagnosis using ROC curve analysis (area under the curve 0.71).
Conclusion
The value of 18F-FDG PET/CT in the diagnosis of suspected IE of PVs and CIEDs is highly dependent on patient preparation and the method used for image interpretation. Based on our results, the best method is to consider a study positive for IE when FDG uptake is present in both AC PET and NAC PET images.
Introduction
The diagnosis of prosthetic valve (PV) infective endocarditis (IE) and infection of cardiac implantable electronic devices (CIEDs; pacemakers and implantable cardioverter defibrillators) remains challenging. Neither incidence nor mortality have decreased in the last 30 years. Despite advances in diagnosis and therapy, it is a severe disease associated with high mortality, and management decisions are particularly difficult. Early diagnosis and timely initiation of the correct antimicrobial therapy, in addition to early surgery if necessary, improves prognosis and reduces mortality.
When the endocarditis is located in a PV (PVE) or in a CIED (CIEDIE) the prognosis is worse and the diagnosis is more complex than when the disease is located in a native valve. The incidence of PVE and CIEDIE has increased in recent years. PVE has an estimated incidence of 0.3 – 1.2 % of patients per year [1], representing 10 – 30 % of patients with IE, and is the most severe type [2]. On the other hand, in recent years there has been an increase in the clinical indications for the implantation of a CIED, with an incidence of infection of 1 – 7 % [3]. Approximately 70 % of patients with a CIED are older than 65 years old and more than 75 % have at least one associated disease [4], and with increasing comorbidity there is a higher risk of infection and secondarily of IE [5]. The clinical presentation of CIEDIE is usually atypical, and blood cultures are more frequently negative. Echocardiography, especially transoesophageal echocardiography, but also transthoracic echocardiography, shows lower diagnostic efficacy, being negative or inconclusive in up to 20 % of patients with confirmed PVE.
The modified Duke diagnostic criteria published by Li et al. [6] are widely used in clinical practice for the diagnosis of the disease. They use several parameters: clinical, microbiological and echocardiographic, to classify the clinical suspicion of IE as definite, possible or rejected, depending on the number of criteria each patient has (Tables 1 and 2). However, they have a lower diagnostic efficacy when IE settles on a PV or CIED.
In order to improve the accuracy of these diagnostic criteria, the European Society of Cardiology (ESC) has included 18F-FDG PET/CT as well as echocardiography in the diagnostic criteria in the latest version of the guidelines for the management of IE, published in August 2015 [7]. Thus, the new criteria for the diagnosis of IE proposed by the ESC in 2015 include the following additional criteria related to 18F-FDG PET/CT: (a) in PVE an abnormal uptake of FDG in the location of the implant should be considered a new major diagnostic criterion (if the PV was implanted at least 3 months before), and (b) the identification by imaging of recent events related to septic emboli should be considered a new minor diagnostic criterion. Therefore, PET/CT is now a new imaging tool providing functional and structural information for the diagnosis of PVE and CIEDIE. Its main indication is in patients with greater diagnostic uncertainty, i.e. those classified as possible or rejected IE but with a high clinical suspicion [7].
However, there is still no consensus on the methodology that should be followed for a correct interpretation of the images, and the interpretation criteria have not been described in detail and are not standardised. As PET/CT is now considered a new imaging study for the diagnosis of IE, the aims of this study were to: (a) assess the diagnostic accuracy of contrast-enhanced PET/CT with 18F-FDG in these types of patients, and (b) analyse the methodology that should be followed for a correct interpretation of the images and the criteria for interpreting 18F-FDG PET/CT scans.
Materials and methods
Patients
We included 41 patients in the study, 26 (63 %) men and 15 (37 %) women, with a proportion between the sexes of 1.7:1 and an average age of 70 ± 14 years (range 23 – 89 years). We evaluated 62 areas of suspected IE, classified as definite in 28 (45 %) and possible in 34 (55 %), and located in a PV in 42 (68 %) and in a CIED in 20 (32 %). Of the PVs, 27 were mechanical and 15 biological, and 24 were located in the aortic valve, 16 in the mitral valve and 2 in the tricuspid valve. IE was diagnosed in 52 % of the cohort (32 areas) with confirmation on the basis of pathological Duke criteria in 20 areas (63 %) and on the basis of a clinical board decision after a 4 month clinical follow-up with no invasive intervention in 12 areas (37 %). In the remaining 48 % of the cohort (30 areas) the diagnosis of IE was rejected. 18F-FDG PET/CT imaging in two representative patients with clinical suspicion of definite IE is shown in Figs. 1 and 2.

A 66-year-old woman with an aortic prosthetic valve implanted 2 years before (a arrow, PET/CT CT image) referred for clinical suspicion of definite IE (transoesophageal echocardiography with evidence of a vegetation in the prosthesis and positive blood cultures for Streptococcus Sanguis). b Contrast-enhanced 18F-FDG PET/CT shows pathological 18F-FDG uptake in all the prosthetic valve, with more intense and focal uptake in the right posterolateral region (SUVmax 9.2 arrow). c, d This pathological uptake is evident in the PET images both with attenuation correction (c) and without (d) attenuation correction and is easily differentiated from the surrounding tissue, and is suggestive of IE. Additionally, contrast-enhanced PET/CT showed 18F-FDG uptake in the colon, in liver metastases and in peritoneal implants, all of which were later confirmed as stage IV colon cancer, that was treated medically. Regarding the IE, the patient was treated with antimicrobial therapy, as surgery of the valve was considered inappropriate

A 75-year-old man with a pacemaker implanted 3 years before with clinical suspicion of definite IE (transoesophageal echocardiography with evidence of a vegetation adherent to the electrode localised in the right cavities and positive blood cultures for Staphylococcus Schleiferi). a, b 18F-FDG PET/CT evidences pathological uptake of 18F-FDG with a linear pattern in the right atrium corresponding to the intracardiac portion of the electrode of the pacemaker (a CT, b fused PET/CT) with SUVmax 3.9. c, d This pathological 18F-FDG uptake is evident on the images both with attenuation correction (c) and without (d) attenuation correction and is easily differentiated from the surrounding tissue, and is suggestive of IE. Antimicrobial therapy was initiated and the pacemaker was removed. IE was confirmed in the pathology study
In this prospective study we included all patients referred to our department from November 2012 to January 2015 with suspected IE, classified as definite or possible IE, located in a PV or CIED. The clinical suspicion was based on the modified Duke criteria (Tables 1 and 2). A multidisciplinary medical and surgical team expert in IE treated all patients. The study was performed in a tertiary care hospital with cardiovascular surgery and a centre of reference for this disease. Patients of both sexes with no age limit were included. In patients with several areas with suspected IE, each suspicious area was evaluated independently, by clinical criteria, imaging criteria (echocardiography and 18F-FDG PET/CT) and in the final diagnosis. Exclusion criteria were pregnancy and the need for urgent surgery during the wait for the 18F-FDG PET/CT scan.
The gold standards used for the final diagnosis were histopathology and culture of surgical specimens obtained on cardiac surgery or autopsy. Diagnosis was based on the Duke pathological criteria (microorganism demonstrated in the vegetation by culture or histopathology, or in an intracardiac abscess). If this information was not available, the final diagnosis was established by an expert medical team following at least 4 months of follow-up from the time of the episode. In no case the information supplied by the 18F-FDG PET/CT altered or influenced the final diagnosis.
As liver FDG uptake was used as a reference for the uptake in other areas, we evaluated the hepatic function of every patient by measurement of hepatic enzymes (ALT, AST and GGT) in the blood analysis performed before the FDG PET/CT study. Hepatic function was considered normal when these values were in their normal ranges or were slightly elevated to no more than twice the top value of the normal range. When one or more enzymes were higher than twice the top value of the normal range, liver function was considered abnormal. Only six patients presented altered hepatic function (due to known hepatic steatosis in two, metastases from an adenocarcinoma in one, in the context of an acute pancreatitis of biliary origin in one, and unknown aetiology without previous alteration of the liver and with normal abdominal ultrasonography in two). However, all six of these patients showed normal FDG uptake values in the left hepatic lobe (SUVmax between 2.9 and 3.7), and therefore they were not excluded from the study. The remaining patients showed normal hepatic function and normal FDG uptake values.
18F-FDG PET/CT
The 18F-FDG PET/CT study was performed as far as possible with high priority in relation to the availability, and ideally within 72 h of the request. All studies were performed with the same PET/CT system (Biograph 6 TruePoint; Siemens) with a theoretical spatial resolution of 3 – 4 mm. This system comprises four rows of detectors with LSO crystals and a six-row detector CT component with dose modulation depending on the topogram (CARE Dose; Siemens). The acquisition mode was 3D, with a coincidence detection window of 4.1 ns.
Patient preparation and study protocol
In order to reduce physiological uptake of 18F-FDG by the myocardial cells as much as possible, all patients consumed a low-carbohydrate high-fat diet during the 48 h before the procedure, and fasted for the last 12 h. In addition, to further reduce myocardial uptake of 18F-FDG, an intravenous bolus of heparin at 50 U/kg body weight was administered 15 min before administration of 18F-FDG, if there were no contraindications. Blood glucose levels were always checked before 18F-FDG administration with an upper limit of 200 mg/dL. 18F-FDG was administered at a dose of 5 MBq/kg body weight using an automatic injector (Medrad Intego 200; Bayer). All patients rested in a quiet room for 45 to 60 min to allow uptake.
The 18F-FDG PET/CT procedure was performed following EANM guidelines [8, 9], administering 130 mL of iodinated contrast agent (with a delay of 45 s and a speed of 2.5 mL/s), if not contraindicated. First, a thoracic CT scan in deep inspiration was performed to acquire arterial phase images (110 kV and 60 mAs, 2.5 mm thickness), followed by a whole-body CT scan in the portal phase (110 kV and 95 mAs, 0.5 s tube rotation, pitch 6 and 5 mm thickness) from the top of the skull to the distal extremity of the thighs. The image was acquired with a 512 matrix and 1 mm pixel. The PET scan was then acquired in the caudocranial direction with 3 min per bed position and 20 % overlap. Iterative reconstruction was applied. Neither the CT nor the PET protocol included cardiac gating.
A whole-body contrast-enhanced 18F-FDG PET/CT scan was acquired to analyse both the heart and the rest of the body. However, analysis of the images was divided into two studies depending on the region, one focusing on the diagnosis of IE in the heart and the other focusing on septic emboli in the rest of the body. Contrast-enhanced CT images were used in the differential diagnosis of lesions located in organs other than the heart. As cardiac CT gating was not performed, CT images of the heart were of low quality and did not allow differential diagnosis of possible lesions related to IE. Therefore, CT images were not used in the evaluation or in the final diagnosis of heart lesions.
Interpretation and image analysis
Studies were analysed by two nuclear medicine physicians and one radiologist, all with experience in the field, using the same workstation (Syngo software system; Siemens Medical Imaging). Regarding the analysis of the PET/CT images related to the clinical suspicion in each patient, all areas with suspicion of IE in PVs and CIEDs that could present IE were taken into account based on the available data (clinical history, analysis, imaging). These areas were analysed independently in the PET/CT study and if they showed increased uptake of 18F-FDG they were considered suspicious for IE based on the metabolic information supplied by PET. If tissues surrounding the PV, the CIED or any other high-density object (i.e. the catheter) showed areas of increased 18F-FDG uptake, both the attenuation-corrected (AC) images and the images without AC (NAC images) were analysed. All AC PET images were analysed visually and semiquantitatively in terms of SUV, whereas the NAC images were analysed only qualitatively, as it is not possible to measure SUV on NAC images. Areas of increased 18F-FDG uptake were also analysed semiquantitatively comparing them with other areas of physiological FDG uptake. The criteria applied for reading the images and classifying the findings as positive or negative for IE were:
-
1.
Visual analysis of only the AC PET images: 18F-FDG uptake was considered pathological when there was an increased 18F-FDG uptake in the suspicious area, independently of its intensity, distribution and extent, and in this case the PET study was considered positive for IE. If there was no increased uptake in the suspicious area, the PET study was categorised as negative.
-
2.
Visual analysis of both the AC PET and the NAC PET images: If increased 18F-FDG uptake on the AC PET images persisted on the NAC PET images, independently of its intensity, the PET study was considered positive for IE. On the contrary, if the increased uptake did not persist on the NAC PET images, the study was considered negative. Furthermore, two patterns of uptake, focal and diffuse, were differentiated depending on the distribution of the increased 18F-FDG uptake.
-
3.
Qualitative analysis of the NAC PET images: Intensity that persisted on the NAC PET images was also analysed. The areas showing suspicious uptake on the AC PET images were scored on the NAC PET images using a grey scale from 1 to 3 in relation to the uptake in the surrounding tissue (myocardial or background uptake adjacent to the generator or extracardiac electrode), as follows: 1 no difference in uptake, 2 subtle differentiation, and 3 clear or marked differentiation. An example is presented in Fig. 3.
Fig. 3 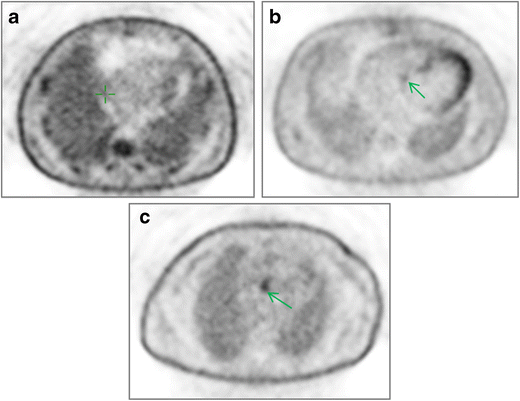
Qualitative analysis of NAC PET images using a three-point grey scale: a grade 1 increased 18F-FDG uptake on the AC PET image persists on the NAC PET image but it is impossible to differentiate it from uptake in the surrounding tissue; b grade 2 increased uptake on the AC PET image persists on the NAC PET image with subtle differentiation from uptake in the surrounding tissue; c grade 3 increased uptake on the AC PET image persists on the NAC PET image with clear or marked differentiation from uptake in the surrounding tissue
-
4.
Semiquantitative analysis of the AC PET images: SUVmax was measured in the suspicious area (PV and CIED) and was compared to physiological uptake (as SUVmax) in two areas: (1) the mediastinal blood pool (MBP), calculated by measuring a volume of interest (VOI) of a diameter of 3 mm inside the walls of the ascending aorta; and (2) the liver, calculated by measuring a VOI of diameter 3 cm drawn in the right hepatic lobe excluding any areas of inhomogeneous or focally increased uptake (physiological, pathological or due to artefacts). A five-point scale was applied using these references: 0 no uptake, 1 uptake (SUVmax) lower than that in the MBP, 2 uptake higher than that in the MBP but lower than that in the liver, 3 uptake higher than the liver but less than twice its value; 4 uptake more than twice that in the liver.

Statistical analysis
Descriptive analysis
The qualitative variables analysed are presented with frequency distributions. The quantitative variables analysed are presented including the averages and standard deviation.
Diagnostic efficacy of PET
The diagnostic efficacy of 18F-FDG PET/CT in the final diagnosis of IE was evaluated by calculating sensitivity (Se), specificity (Sp), positive predictive value (PPV), negative predictive value (NPV) and accuracy (Ac) with the 95 % confidence intervals (CI).
Diagnostic efficacy of SUVmax
The area under the ROC curve (AUC) of the quantitative variable SUVmax was calculated as a measure of the overall performance of the test in the final diagnosis of IE. The optimal performance can be determined from the ROC curve, calculating the threshold that provides the highest accuracy. We compared the average SUVmax between patients with and without IE using the nonparametric Mann-Whitney U test.
In all the comparisons, the null hypothesis was rejected with a type I error or “error a” less than 0.05. The statistical program used was SPSS v15.0 y STATA 9.0.
Results
The time between implantation of the device or PV and the PET/CT scan was longer than 12 months in 64 % of the areas studied (40 areas), between 6 weeks and 12 months in 10 % (6 areas), and less than 6 weeks in 26 % (16 areas). In areas with suspicion of late IE (more than 1 year), the diagnosis of infection was confirmed in 53 % of the areas analysed (21/40) and the percentage of error of PET/CT was 15 % (6 areas false-positive), whereas in areas with suspicion of early IE (less than 1 year), the final diagnosis was of infection in 59 % (11 areas of those less than 6 weeks, and 2 areas of those between 6 weeks and 12 months), and PET/CT had a lower false-positive rate with only 9 % of the areas (two false-positive areas). In no case did 18F-FDG PET/CT provide an inconclusive or doubtful result at the time of diagnosis or exclusion of disease, nor was it necessary to exclude any study because of suboptimal quality for the evaluation of heart disease.
Next, we present the results of the PET/CT scans for the diagnosis of IE obtained in relation to the methods used in interpreting the images. Additionally, Table 3 shows the details of the interpretations for each location.
Visual analysis of only AC PET images
Of the suspicious areas, 90 % (56) showed increased 18F-FDG uptake on the AC PET images. This gave Se 100 % (95 % CI: 89 – 100 %), Sp 20 % (95 % CI: 7.7 – 38.6 %), NPV 100 % (95 % CI: 54.1 – 100 %), PPV 57.1 % (95 % CI: 43.2 – 70.3 %) and Ac 61.2 % (95 % CI: 48.1 – 73.4 %) in the diagnosis of IE. Of the 34 suspicious areas in which possible IE was initially suspected, PET led to reclassification of 29 as IE and rejection of the diagnosis of IE in 5. In this subgroup, 18F-FDG PET/CT showed a rate of success or accurate diagnosis of 29.4 % (95 % CI: 15 – 47 %).
Visual analysis of both AC PET and NAC PET images
Of the 56 clinically suspicious areas with increased 18F-FDG uptake on the AC PET images, 40 (71 %) showed persistently increased uptake on the NAC PET images independently of intensity. Analysing both AC PET and NAC PET images side by side resulted in Se 100 % (95 % CI: 89.1 – 100 %), Sp 73.3 % (95 % CI: 54.1 – 87.7 %), NPV 100 % (95 % CI: 84.6 – 100 %), PPV 80 % (95 % CI: 64.4 – 90.9 %) and Ac 87.1 % (95 % CI: 76.1 – 94.3 %) in the diagnosis of IE. Of the 34 suspicious areas in which possible IE was initially suspected, PET led to the reclassification of 13 as IE and rejection of the diagnosis of IE in 21. In this subgroup 18F-FDG PET/CT showed a rate of success or accurate diagnosis of 76.5 % (95 % CI: 0.58 – 0.89 %). The distribution of the increased 18F-FDG uptake was focal in 38 % and diffuse in 62 % of the clinically suspicious areas, confirming IE in 76 % of the areas with focal uptake and 44 % of the areas with diffuse uptake (p = 0.020).
Qualitative analysis of the NAC PET images
In 16 suspected areas although there was increased 18F-FDG uptake in the AC PET it did not persist in the NAC PET, whereas in another 6 suspected areas it was not necessary to use the NAC PET because the AC PET was negative. Thus, the qualitative analysis of the NAC PET images was done in 64 % (40 areas) of the cohort. In 24 of these 40 areas (60 %) the uptake persisted and could be differentiated without difficulty from the surrounding background, in 10 areas (25 %) the uptake persisted but was difficult to differentiate from the surrounding background, and in 6 areas (15 %) the uptake persisted but could not be differentiated from the surrounding tissue. Diagnostic accuracy depended on the threshold for positivity:
-
Considering PET images positive for IE when 18F-FDG uptake that persisted in the NAC PET images could be differentiated from the surrounding tissue (excluding those uptakes that were indistinguishable from the surrounding background), Se was 87.5 % (95 % CI: 71 – 96.5 %), Sp 80 % (95 % CI: 61.4 – 92.3 %), NPV 85.7 % (95 % CI: 67.3 – 96 %), PPV 82.4 % (95 % CI: 65.5 – 93.2 %) and Ac 83.9 % (95 % CI: 72.3 – 92 %). Using this threshold Sp and NPV were increased although there was a slight decrease in Se and NPV. Of the 34 suspicious areas in which possible IE was initially suspected, analysis of the PET images led to reclassification of 10 areas as IE and rejection of the diagnosis in 24 areas. In this subgroup, 18F-FDG PET/CT showed a rate of success or accurate diagnosis of 79.4 % (95 % CI: 0.62 – 0.91 %).
-
On the contrary, considering PET images positive for IE only when 18F-FDG uptake that persisted in the NAC PET images could be clearly differentiated from the surrounding tissue, Se and NPV were significantly lower at 59.4 % (95 % CI: 40.6 – 76.3 %) and 65.8 % (95 % CI: 48.6 – 80.4 %), respectively, and and Ac 66.1 % (95 % CI: 53.0 – 77.7 %). Furthermore, these lower Se and NPV values were not associated with improvements in Sp or PPV, which were similar to those in the previous group at 83.3 % (95 % CI: 65.3 – 94.4 %) and 79.2 % (95 % CI: 57.8 – 92.9 %), respectively. Of the 34 suspicious areas in which possible IE was initially suspected, analysis of the PET images led to reclassification of 9 areas as IE and rejection of the diagnosis in 25 areas. In this subgroup 18F-FDG PET/CT showed a rate of success or accurate diagnosis of 82.4 % (95 % CI: 0.65 – 0.93 %).
Quantitative analysis of AC-PET images
The suspicious foci of IE showed an average SUVmax of 4.9 ± 2.5 (range 0 – 13.3). The SUVmax values of the suspicious foci of IE distributed in percentiles were 3.3 at the 25th percentile (p25), 4.4 at the 50th percentile (p50) and 6.3 at the 75th percentile (p75). The MBP showed an average SUVmax of 1.9 ± 0.3 (range 1.3 – 2.9), and the hepatic parenchyma and average SUVmax of 3.4 ± 0.8 (range 2.0 – 5.4). In 55 % of the suspected foci of IE the uptake was higher than but less than twice that in the liver, whereas in 19 % the uptake was more than double the hepatic uptake, and only 16 % showed uptake higher than the MBP and lower than the liver.
When the final diagnosis was IE, the average SUVmax in the suspected foci of IE was 5.9 ± 2.4. On the contrary, when the diagnosis of IE was rejected, the average SUVmax was 3.6 ± 2.1. The difference in SUVmax was 2.23 (95 % CI: 1.04 – 3.42; p = 0.004), with higher values in the areas where IE was finally confirmed. In the patients with a PV with a final diagnosis of IE, those with a biological prosthesis showed a higher average SUVmax than those with a mechanical prosthesis (SUVmax 8.2 ± 2.6 and 5.4 ± 1.8, respectively). In the patients in whom the diagnosis of IE was finally rejected, the average SUVmax was similar in those with both types of prosthesis (SUVmax 3.3 ± 1.7 in those with a biological prosthesis and 3.5 ± 2.5 in those with a mechanical prosthesis). The difference in SUVmax was 4.9 (95 % CI: 2.41 – 7.34; p = 0.003) in those with a biological prosthesis and 1.9 (95 % CI: 0.11 – 3.61; p = 0.189) in those with a mechanical prosthesis, with higher values in the areas where IE was finally confirmed.
The ROC curves showed a good diagnostic performance of 18F-FDG PET/CT in IE (Fig. 4). The maximum joint Se and Sp was achieved with a SUVmax 5.5 to differentiate between PET positive or PET negative for IE with an AUC of 0.71, with a Se 50 % (95 % CI: 31.9 – 68.1), Sp 80 % (95 % CI: 61.4 – 92.3), NPV 60 % (95 % CI: 43.3 – 75.1), PPV 72.7 % (95 % CI: 49.8 – 89.3) and Ac 64.5 % (95 % CI: 51.3 – 76.3).

Receiver operating characteristic (ROC) curve analysis of the value of SUVmax for predicting infective endocarditis
Discussion
Multimodality imaging with 18F-FDG PET/CT has undoubtedly a great potential for the early diagnosis of PVE and CIEDIE [10–12]. Recent guidelines such as ESC 2015 [7] propose its inclusion as a new imaging modality for the diagnosis of PVE. However, standardisation is still needed regarding several aspects for a proper assessment of this disease. Some of the pending issues are: (a) patient preparation for the 18F-FDG PET/CT procedure with regard to the use of heparin or not; (b) the acquisition protocol including timing and extent of the scan; (c) the processing protocol with regard to the need or not for different types of images (AC, NAC); and the most important (d) the criteria used for interpreting the studies [10]. There is currently no consensus regarding the interpretation criteria for 18F-FDG PET/CT in IE, and there are no published guidelines with clear, standardised and uniform criteria for the evaluation of this disease. The available evidence shows that each group dedicated to research in this area uses a different patient preparation, different acquisition protocols and different interpretation criteria.
In our study we considered necessary an adequate patient preparation that would minimise physiological uptake of 18F-FDG by the myocardial cells. Myocardial uptake of 18F-FDG is very variable among patients and even in the same patient in different studies. The risk of artefacts increases with increasing physiological uptake, and the presence of artefacts makes image interpretation very difficult and can mask possibly pathological 18F-FDG uptake. Several methods have been proposed to lower physiological uptake, such as the use of heparin [13], prolonged fasting [14] and a low-carbohydrate high-fat diet [15]. All these methods seem to lower the levels of insulin in the blood and increase the levels of free fatty acids, which induce an inhibition of the myocardial uptake of 18F-FDG. In our study preparation for the 18F-FDG PET/CT scan included the following: (a) a special low-carbohydrate high-fat diet during the 48 h before the procedure; (b) a long fasting period of 12 h before the scan; and (c) administration of heparin when not contraindicated. This protocol led to interpretable studies in all patients (100 %), without needing to exclude any due to suboptimal images in the heart region, and there were no inconclusive or doubtful studies.
Most groups use protocols that include fasting before the procedure for a minimum of 6 h [16, 17] to a maximum of 12 h [11], 8 h being the most usual period [18, 19]. We have also found no consensus in the literature regarding the use of a specific diet before the study. Some groups recommend a diet of the indicated characteristics (low-carbohydrate high-fat) before the fasting period [11, 17], and other groups do not describe in detail, or even at all, the dietary preparation in patients included in their studies [18–20]. The absence of adequate preparation before the procedure may be a reason for the worse performance of 18F-FDG PET/CT in other studies some of which have shown Se in the range 30 – 40 % [16, 19], in contrast to Se in the range 90 – 100 % obtained in our work. Based on our study in which we were able to obtain sufficiently clear images for adequate interpretation in the diagnosis of IE, we propose that a protocol similar to the one used in this study be applied systematically for the preparation of patients before 18F-FDG PET/CT. However, other patient preparation protocols could be as effective as the one we used.
All patients were treated empirically with antimicrobial therapy at the beginning of the suspected IE following the recommendations of the clinical guidelines. The antimicrobial therapy was later modified according to the results of the antibiogram. Although the aim was to perform the 18F-FDG PET/CT study during the 72 h following initiation of the antimicrobial therapy, the average time from initiation of therapy to the PET/CT study was 11 days. However, prolonged antimicrobial therapy before the PET/CT study did not mask the active foci of infection. Indeed, in our opinion none of our false-negative results was due to the biological effects of the antimicrobial therapy. Nevertheless, we cannot exclude the possibility of a certain bias due to empirical antimicrobial therapy at the beginning of the suspected IE, as the antimicrobial therapy could be considered a reason for having fewer false-negative results that would have increased the sensitivity of 18F-FDG PET/CT.
Artefacts due to overcorrection appear on AC PET images as areas of increased uptake due to the presence of metallic components [21, 22]. These artefacts must be taken into account when evaluating suspected foci of IE located next to metallic elements, such as PV (mechanical and biological, although the latter to a lesser degree) and CIED. To avoid the problem of artefacts on AC PET images that can interfere with reaching a correct diagnosis, we consider essential the systematic use of the AC PET images as well as the NAC PET images. An essential criterion for classifying a study as suggestive of IE is the persistence of uptake on the NAC PET images. This is evidenced by the results of this study in which the use of only the AC PET images led to a very low Sp (20 %), a value much lower than those obtained by echocardiography and the modified Duke criteria [7]. On the contrary, the systematic use of both the AC PET and the NAC PET images to evaluate suspected PVE and CIEDIE, independently of the intensity of 18F-FDG uptake, led to an Ac of 87 %, Sp of 73 % and PPV of 80 % without a reduction in Se or NPV. Most authors recommend using the NAC PET images in this context [11, 16–19].
Based on our results, the most recomended criteria to evaluate in the PET study would be in cases of possible IE to consider a study as positive for infection when the FDG uptake can be observed both in the AC PET and in the NAC PET, being able to differentiate in this last one the pathological uptake from the surrounding tissue. Applying these criteria PET/CT would show an accuracy of around 80 %. However, it is generally agreed that NAC PET images present limitations due to their low quality. NAC PET images are difficult to evaluate as they usually present a very low spatial resolution, especially in small lesions. Thus, they are usually of limited use, except when evaluating the presence of artifacts due to the presence of metal components, where they can certainly be key to a correct interpretation.
In this study, focal FDG uptake was more frequently associated with the presence of IE than diffuse FDG uptake, which was associated with IE in about half of the areas evaluated. To the best of our knowledge, this parameter has not been analysed in a standard way by other groups.
There is no clear SUVmax threshold that allows precise differentiation between active IE and its absence. Only the group of Sarrazin et al. [18] observed a SUVmax of 4.4 ± 1.6 in the patients with clinical suspicion of IE, as compared to a SUVmax of 1.2 ± 1.4 in asymptomatic patients with a recent surgery for implantation, concluding that PET/CT is able to differentiate between inflammatory postsurgical changes due to a recent surgery from infectious changes related to IE. SUVmax was similar to the one observed by our group (4.9 ± 2.5), being slightly higher in our study when the IE was confirmed where the SUVmax reached an average of 5.9 ± 2.4. As has been often discussed in oncology, it is difficult and adventurous to establish a fixed threshold to discriminate between pathological uptake and normal/physiological uptake, as there are many factors influencing the uptake. We observed that higher uptakes were more frequently associated with IE, with a good Sp of 80 % and a SUVmax cutoff of 5.5, but in contrast the Se was 50 %. However, it would not be reasonable to use this parameter in analysing the distribution of SUVmax in the areas evaluated without also taking into account the rest of the information supplied by the image in addition to other diagnostic parameters (clinical, microbiological and echocardiographic).
To define a quantitative scale of 18F-FDG uptake for assigning different categories depending on the level of 18F-FDG uptake in the suspected area of IE as compared to the standard references (MBP and the liver), we followed the Deauville criteria (used to evaluate interim response in lymphomas) [23, 24]. Such a detailed analysis for the study of IE has not been reported previously. We observed that up to 75 % of the suspicious areas showed 18F-FDG uptake higher than that in the liver and therefore also higher than in the MBP, allowing easy differentiation from the background and physiological uptake in the heart. Others including Cautela et al. [19] have used other reference regions such as the descending thoracic aorta, hepatic parenchyma and pectoral region, and have obtained promising results in the evaluation of infection in the pocket of the cardiac device (local infection), but very unfavourable results in the evaluation of IE in the remaining components of the CIED. Although this type of analysis helps the interpretation, we believe it should not replace the use of NAC PET images. This is because we observed that in 30 % of areas evaluated with uptake higher than but less than twice that in the liver, the uptake did not persist in the NAC PET images, leading to the interpretation as negative for IE and finally to excluding the diagnosis of IE in all these cases. If the NAC PET images had not been used, there would have been 10 false-positive findings of IE. However, when the uptake was doubling that in the liver it always persisted in the NAC PET images, allowing easy differentiation with only one erroneous diagnosis with PET/CT. The final diagnosis of IE was correct in 92 % of the evaluated areas. Furthermore, 18F-FDG uptake of low to moderate intensity, lower than hepatic uptake, can be considered of little relevance and, therefore, not suggestive of infection. In our study, 30 % of the 10 areas with this pattern of uptake showed persistent uptake in the NAC PET images and a final diagnosis of IE. In conclusion, when areas suspected of IE show pathological uptake twice that in the liver, there is no need to use the NAC PET images. However, in the remaining areas (uptake less than twice that in the liver) it will be necessary to evaluate the NAC PET images to minimise the likelihood of false-positive findings.
We have underlined the importance of the NAC PET images in the evaluation of this pathology. The main problem we have had to face is the imposibility to quantify the uptake of 18F-FDG in the NAC PET images, in order to be able to measure in a more objective and reproducible way the grade of uptake. NAC PET images were only evaluated using visual qualitative methodology. There is only one previous study in which the use of semiquantitative analysis of NAC PET images has been investigated [18], but such an analysis was not possible on our workstation. To solve this problem and to provide a reproducible and objective reading method, we designed a qualitative analysis method using a scale to score the intensity contrast, that allowed the differentiation of areas of suspicious uptake from uptake in the surrounding tissue. In this way, in a study considered positive for IE because pathological uptake on the AC PET image persisted on the NAC PET image, the persistent uptake could be differentiated from uptake in the surrounding tissue, and thus we obtained excellent diagnostic performance with Se near 90 %, Sp 80 % and Ac 84 %, and the Sp and PPV values were similar to those found by other groups that have studied PV, for example Saby et al. [11] who found Sp 80 % and PPV 85 %. On the contrary, our Se and NPV values are higher than those reported previously (around 60 – 70 %), probably because in our study we used very strict criteria both in patient preparation and in the interpretation of the AC PET and NAC PET images.
The two groups that have studied CIED have found different results. Graziosi et al. [24] found Se 63 % and Sp 86 %, whereas Cautela et al. [19] found Se 86 % and Sp 100 % for detection of infection of the bag of the generator and a clearly lower performance for the diagnosis of IE, with Se 30 % and Sp 62 %. In the detection of CIEDIE we achieved Sp and PPV 90 % and Ac 95 %, much more promising than in the detection PVE.
One of the main limitations of our study was that we included only patients with PV and CIED, who are considered high-risk patients. In many of these patients, even those with a high clinical suspicion of IE, the gold standard imaging test is echocardiography, but the use of this method for the evaluation of these particular patients is very difficult. Because of this, we decided to evaluate the use of 18F-FDG PET/CT in this clinical context. However, this limits the applicability of the conclusions to this subgroup of patients. It would be interesting to carry out a further study with more patients including other clinical scenarios, such as patients with endocarditis in native valves.
To the best of our knowledge, no previously published studies have included the two main premises of our study: (1) an adequate preparation of the patient to minimise the likelihood of myocardial uptake of 18F-FDG; and (2) a systematic reading and interpretation method including both the AC PET and the NAC PET images, as well as a detailed qualitative and semiquantitative analysis. The favourable results obtained indicate 18F-FDG PET/CT could be useful for the evaluation of IE when it is suspected to be localised in a PV and CIED. 18F-FDG PET/CT has a key role in the evaluation of high-risk patients in whom clinical suspicion is not backed up by microbiological or echocardiography findings and who are therefore classified as having possible IE. In conclusion, it is in these patients that 18F-FDG PET/CT can help detect the disease and reclassify those with higher diagnostic difficulty. However, further studies with more patients are needed to enable analysis of subgroups of patients with different types of valve (biological or mechanical).
In our study no cardiac gating protocol was followed, neither for CT nor for PET. There are already available PET/CT systems that allow cardiac gating with CT and PET, which will very probably allow a much more precise evaluation of the cardiac structures. Future studies will have to analyse the performance of these new systems in the evaluation of suspected IE.
Conclusion
The diagnostic efficacy of 18F-FDG PET/CT in patients with suspected IE in a PV and CIED is highly dependent on two factors: an adequate preparation of the patient before the procedure and the methology used for the interpretation of the images. Based on our results the best method of interpretation is to consider an 18F-FDG PET/CT study positive for IE when the 18F-FDG uptake is present in the AC PET and it persists in the NAC PET, where it can be differentiated from the surrounding background independently of its intensity, extent and distribution. However, NAC PET images are difficult to evaluate due to their low resolution and are usually of limited use, except when evaluating the presence of artifacts due to the presence of metal components.
References
Moreillon P, Que YA. Infective endocarditis. Lancet. 2004;363:139–49.
Habib G, Thuny F, Avierinos JF. Prosthetic valve endocarditis: current approach and therapeutic options. Prog Cardiovasc Dis. 2008;50:274–81.
Uslan DZ, Sohail MR, Sauver JL, Friedman PA, Hayes DL, Stoner SM, et al. Permanent pacemaker and implantable cardioverter defibrillator infection: a population-based study. Arch Intern Med. 2007;167:669–75.
Uslan DZ, Tleyjeh IM, Baddour LM, Friedman PA, Jenkins SM, Sauver JL, et al. Temporal trends in permanent pacemaker implantation: a population-based study. Am Heart J. 2008;155:896–903.
Baddour LM, Epstein AE, Erickson CC, Knight BP, Levison ME, Lockhart PB, et al. Update on cardiovascular implantable electronic device infections and their management: a scientific statement from the American Heart Association. Circulation. 2010;121:458–77.
Li JS, Sexton DJ, Mick N, Nettles R, Fowler Jr VG, Ryan T, et al. Proposed modifications to the Duke criteria for the diagnosis of infective endocarditis. Clin Infect Dis. 2000;30:633–8.
Habib G, Lancellotti P, Antunes MJ, Bongiorni MG, Casalta JP, Del Zotti F, et al. 2015 ESC Guidelines for the management of infective endocarditis: The Task Force for the Management of Infective Endocarditis of the European Society of Cardiology (ESC). Endorsed by: European Association for Cardio-Thoracic Surgery (EACTS), the European Association of Nuclear Medicine (EANM). Eur Heart J. 2015;36:3075–128.
Boellaard R, Delgado-Bolton R, Oyen WJ, Giammarile F, Tatsch K, Eschner W, et al. FDG PET/CT: EANM procedure guidelines for tumour imaging: version 2.0. Eur J Nucl Med Mol Imaging. 2015;42:328–54.
Jamar F, Buscombe J, Chiti A, Christian PE, Delbeke D, Donohoe KJ, et al. EANM/SNMMI guideline for 18F-FDG use in inflammation and infection. J Nucl Med. 2013;54:647–58.
Chen W, Kim J, Molchanova-Cook OP, Dilsizian V. The potential of FDG PET/CT for early diagnosis of cardiac device and prosthetic valve infection before morphologic damages ensue. Curr Cardiol Rep. 2014;16:459.
Saby L, Laas O, Habib G, Cammilleri S, Mancini J, Tessonnier L, et al. Positron emission tomography/computed tomography for diagnosis of prosthetic valve endocarditis: increased valvular 18F-fluorodeoxyglucose uptake as a novel major criterion. J Am Coll Cardiol. 2013;61:2374–82.
Millar BC, Prendergast BD, Alavi A, Moore JE. 18FDG-positron emission tomography (PET) has a role to play in the diagnosis and therapy of infective endocarditis and cardiac device infection. Int J Cardiol. 2013;167:1724–36.
Minamimoto R, Morooka M, Kubota K, Ito K, Masuda-Miyata Y, Mitsumoto T, et al. Value of FDG-PET/CT using unfractionated heparin for managing primary cardiac lymphoma and several key findings. J Nucl Cardiol. 2011;18:516–20.
Langah R, Spicer K, Gebregziabher M, Gardon L. Effectiveness of prolonged fasting 18F-FDG PET/CT in the detection of cardiac sarcoidosis. J Nucl Cardiol. 2009;16:801–10.
Lum DP, Wandell S, Ko J, Coel MN. Reduction of myocardial-2-deoxy-2-(18F)fuoro-D-glucose uptake artifacts in positron emission tomography using dietary carbohydrate restriction. Mol Imaging Biol. 2002;4:332–7.
Kouijzer JE, Vos J, Janssen JR, van Dijk PJ, Oyen WJ, Bleeker-Rovers CP. The value of 18F-FDG PET/CT in diagnosing infectious endocarditis. Eur J Nucl Med Mol Imaging. 2013;40:1102–7.
Ricciardi A, Sordillo P, Ceccarelli L, Maffongelli G, Calistri G, Di Pietro B, et al. 18-Fluoro-2-deoxyglucose positron emission tomography-computed tomography: an additional tool in the diagnosis of prosthetic valve endocarditis. Int J Infect Dis. 2014;28:219–24.
Sarrazin JF, Philippon F, Tessier M, Guimond J, Molin F, Champagne J, et al. Usefulness of fluorine-18 positron emission tomography/computed tomography for identification of cardiovascular implantable electronic device infections. J Am Coll Cardiol. 2012;59:1616–25.
Cautela J, Alessandrini S, Cammilleri S, Giorgi R, Richet H, Casalta JP, et al. Diagnostic yield of FDG positron-emission tomography/computed tomography in patients with CEID infection: a pilot study. Europace. 2013;15:252–7.
Graziosi M, Nanni C, Lorenzini M, Diemberger I, Bonfiglioli R, Pasquale F, et al. Role of 18F-FDG PET/CT in the diagnosis of infective endocarditis in patients with an implanted cardiac device: a prospective study. Eur J Nucl Med Mol Imaging. 2014;41:1617–23.
Kamel EM, Burger C, Burk A, Von Schulthess GK, Goerres GW. Impact of metallic dental implants on CT-based attenuation correction in a combined PET/CT scanner. Eur Radiol. 2003;13:724–8.
Goerres GW, Ziegler SI, Burger C, Berthold T, Von Schulthess GK, Buck A. Artefacts at PET and PET/CT caused by metallic hip prosthetic material. Radiology. 2003;226:577–84.
Meignan M, Gallamini A, Haioun C. Report on the First International Workshop on Interim-PET-Scan in Lymphoma. 2009;50:1257–60.
Pilkington Woll JP, García Vicente AM, Talavera Rubio MP, Palomar Muñoz AM, Jiménez Londoño G, León Martín A, et al. Evaluación cuantitativa y cualitativa de la PET/TC a mitad del tratamiento en linfomas en la predicción de respuesta metabólica completa. Rev Esp Med Nucl Imagen Mol. 2013;32:70–6.
Author information
Authors and Affiliations
Corresponding authors
Ethics declarations
Conflicts of interest
None.
Ethical approval
All procedures performed in studies involving human participants were in accordance with the ethical standards of the institutional and/or national research committee and with the principles of the 1964 Declaration of Helsinki and its later amendments or comparable ethical standards.
Informed consent
Informed consent was obtained from all individual participants included in the study.
Rights and permissions
About this article

Cite this article
Jiménez-Ballvé, A., Pérez-Castejón, M.J., Delgado-Bolton, R.C. et al. Assessment of the diagnostic accuracy of 18F-FDG PET/CT in prosthetic infective endocarditis and cardiac implantable electronic device infection: comparison of different interpretation criteria. Eur J Nucl Med Mol Imaging 43, 2401–2412 (2016). https://doi.org/10.1007/s00259-016-3463-9
Received:
Accepted:
Published:
Issue Date:
DOI: https://doi.org/10.1007/s00259-016-3463-9