
Abstract
This article explores the suitability of a long short-term memory recurrent neural network (LSTM-RNN) and artificial intelligence (AI) method for low-flow time series forecasting. The long short-term memory works on the sequential framework which considers all of the predecessor data. This forecasting method used daily discharged data collected from the Basantapur gauging station located on the Mahanadi River basin, India. Different metrics [root-mean-square error (RMSE), Nash–Sutcliffe efficiency (ENS), correlation coefficient (R) and mean absolute error] were selected to assess the performance of the model. Additionally, recurrent neural network (RNN) model is also used to compare the adaptability of LSTM-RNN over RNN and naïve method. The results conclude that the LSTM-RNN model (R = 0.943, ENS = 0.878, RMSE = 0.487) outperformed RNN model (R = 0.935, ENS = 0.843, RMSE = 0.516) and naïve method (R = 0.866, ENS = 0.704, RMSE = 0.793). The finding of this research concludes that LSTM-RNN can be used as new reliable AI technique for low-flow forecasting.
Introduction
Forecasting hydrologic time series (HTS) is a vital research topic for researchers, and undoubtedly forecasting has always been prime concern in hydrological practices. The forecasting of rainfall and water level in a river is very important task for water resources engineers for planning and monitoring water resources activities like providing irrigation water, maintaining environmental flow, providing drinking water, recreational purpose and many more other activities. Hydrological processes like stream flow generation processes are not only controlled by external climatic conditions, but also by physical properties (Beven 2012). Developing appropriate models for forecasting hydrological time series is a challenging task due to the influences of many factors and complicated hydrologic processes (Gárfias-Soliz et al. 2010; Nayak et al. 2004; Sang 2013; Sang et al. 2009).
While dealing with time series forecasting in hydrology, there are two approaches generally witnessed in the literature: the first one is stochastic models and the other one is artificial intelligence (AI) techniques. The AI techniques are generally referred as black box models in the literature due to its complex and unknown underlying process. It is very difficult to say which approach is the best for hydrological time series forecasting. However, a recent study on hydrological time series forecasting by (Papacharalampous et al. 2019) and its companion studies was algorithmically proved by using large datasets (135–2537 real-world time series and 16,000–48,000 simulated time series) that at the annual and monthly time scales traditional and AI techniques can perform equally well. The gaining popularity of AI techniques for HTS forecasting is clearly witnessed in the studies. (Papacharalampous et al. 2018a) assess the one-step ahead forecasting performance of 20 univariate time series forecasting methods to a large number of geophysical and simulated time series of 91 values. “The simulation experiments reveal the most and least accurate methods for long-term forecasting applications, also suggesting that the simple methods may be competitive in specific cases.” Some of those AI models used in HTS includes neural network (NN)(Atiya et al. 1999; Kişi 2007), support vector machines (SVM) (Kisi and Cimen 2011; Sahoo et al. 2018; Sivapragasam et al. 2001), extreme learning machines (ELM) (Yaseen et al. 2016), adaptive neuro-fuzzy inference system (ANFIS) (Firat and Güngör 2007), random forest (Tyralis and Papacharalampous 2017) and many more such AI techniques can be seen in the literature. Tyralis and Papacharalampous (2018) used Prophet for multi-step ahead forecasting of monthly streamflow. The Prophet algorithm is developed by Facebook for time series forecasting. These AI techniques are the viable alternative tool to study hydrological phenomena, when hydrological attributes are limited and forecasting is essential.
HTS forecasting has received the remarkable consideration by the researchers in the last few decades, and many models for HTS forecasting have showed significant performance in terms of forecasting accuracy. HTS forecasting is still one of the difficult problems and is an active research area of interest in operational hydrology. We have applied sequential LSTM-RNN model for low-flow forecasting at Mahanadi River basin, using low-flow data from the Basantapur station. Additionally, to check its adaptivity for this process, a benchmark model (naïve method) and sequential model (RNN) were used for HTS forecasting.
The main purpose of this study is to inspect the suitability of LSTM-RNN for low-flow forecasting in the selected station of Mahanadi River basin India and compare it with RNN and naïve method. The naïve forecasting method is one of the most commonly used benchmarks for time series forecasting (Hyndman and Athanasopoulos2013; Pappenberger et al. 2015). This method simply sets all forecasts equal to the last value. This naïve method is appropriate when we are interested in multi-step ahead forecasting of time series without seasonality. However, in this study, we are interested in one-step ahead forecasting of monthly values; therefore, an appropriate naïve method is the one based on all monthly values of the last year.
Reviews on modeling approaches for HTS
HTS modeling can be categorized into two groups such as parametric and nonparametric methods. The most widely used parametric time series method is autoregressive integrated moving average (ARIMA) model (Box and Jenkins 1970), that is, ARIMA (p, d, q), where p, d, q, respectively, represent the autoregressive, integrated and moving average polynomial orders. Extensive application and assessments of the various classes of such models reported for the modeling of hydrologic time series were suggested in the past (Arena et al. 2006; Chen and Rao 2002; Hipel and McLeod 1994; Komorník et al. 2006; Srikanthan and McMahon 2001; Toth et al. 2000). Traditional time series forecasting involves decomposing the data into its components such as trend component, seasonal component and noise. In contrast to parametric approaches, nonparametric methods do not have a fixed model structure and parameter. Some of the previous studies also includes the chaotic behavior, hurst phenomena, stochastic and deterministic models and their performance in HTS forecasting (Dimitriadis and Koutsoyiannis 2015; Dimitriadis et al. 2016; Koutsoyiannis and Langousis 2011; Koutsoyiannis et al. 2008).
According to Wang et al. (2009), the HTS models can be broadly divided into three groups: regression-based methods, time series models and artificial intelligence (AI)-based methods. In recent years, HTS forecasting methods have been gradually shifting from traditional statistical models to AI approaches technique. AI techniques being capable of analyzing long series, handling large-scale data, recognizing patterns hidden in historical data and then applying those patterns to predict future scenarios have become increasingly popular in HTS modeling among researchers for developing a variety of models for time series prediction (Sahoo et al. 2017). Papacharalampous et al. (2018b) used random walk (with drift), autoregressive fractionally integrated moving average (ARFIMA), exponential smoothing state-space model with Box–Cox transformation, ARMA errors, trend and seasonal components (BATS), simple exponential smoothing, Theta and Prophet methods for univariate time series forecasting along with a naïve method based on the monthly values of the last year, used for benchmarking purposes. Some of the models used by Papacharalampous et al. (2018b) are quite new or rare in HTS forecasting and beyond the scope of this study.
The artificial neural network (ANN) is one of the common AI procedures established on the conceptualization of the brain and nervous systems (Abiodun et al. 2018) and was successfully applied for HTS forecasting. A broad review of the use of ANN in the hydrological field is given by ASCE Task Committee on “Application of Artificial Neural Networks in Hydrology” (ASCE 2000a, b). A wide number of research have published to report the forecasting performance of several time series models HTS (Carlson et al. 1970; Chang et al. 2002; Chen and Rao 2002; Cheng et al. 2005; Firat and Güngör 2008; Hu et al. 2001; Jain and Kumar 2007; Keskin et al. 2006; Komorník et al. 2006; Lin et al. 2006; Nayak et al. 2004; Salas 1993; Sivapragasam et al. 2007; Zounemat-Kermani and Teshnehlab 2008). Yaseen et al. (2018) have applied Elman recurrent neural network coupled with the rolling mechanism and gray models for streamflow forecasting over various lead times. Wunsch et al. (2018) advocated the suitability of nonlinear autoregressive networks with exogenous input (NARX) model for forecasting groundwater levels in several wells in southwest Germany with a lead time of 6 months ahead. Recently, Zhang et al. (2018a) successfully implemented long short-term memory network for sewer overflow monitoring. A comprehensive review of the state-of-the-art for the application of different AI techniques in streamflow forecasting from 2000 to 2015 was presented by Yaseen et al. (2015). The LSTM-RNN has been found very useful in continuous time series processing such as word recognition and speech recognition. Some studies have investigated the feasibility of LSTM in soil moisture modeling and agricultural applications (Fang et al. 2017), water table depth predicting (Zhang et al. 2018b) drought forecast (Xu et al. 2018). Here, the performance of LSTM-RNN in low-flow forecasts was examined.
Case study and catchment description
In this paper, the monthly low-flow HTS at gauging station namely Basantapur \((82^{ \circ } 78^{{\prime }} {\text{E}},21^{ \circ } 72^{{\prime }} {\text{N}})\) of Mahanadi River basin, India, was analyzed. The Mahanadi River basin was situated between 80°28′E–86°43′E and 19°8′N–23°32′N (Fig. 1). It travels a distance of 851 km from the source of origin before falling into the Bay of Bengal. The major part of the basin is covered with agricultural land accounting for 54.27% of the total area, and 4.45% of the basin is covered by water bodies. The Mahanadi River basin has an average annual rainfall of 1572 mm, over 70% is precipitated during the southwest monsoon between June and October. The daily discharge data from June 1971 to May 2010 of the stations Basantapur were obtained from central water commission (CWC) Bhubaneswar and were used to calculate the monthly low-flow at Basantapur station.

Study area and selected station
Defining low flow and its importance
An appropriate definition of low flow differs from person to person according to the need of the study (Pyrce 2004). Low-flow situation is determined by a certain percentile of discharge (Ahn and Palmer 2016) or a truncation level in a stream. A significant amount of past studies has reported a number of low-flow indices such as Q95 (Laaha and Blöschl 2005), Q85 (Giuntoli et al. 2013), Q75 (Demirel et al. 2013; Jha and Smakhtin 2008; Pyrce 2004), used for low-flow study, where Q95, Q85,Q75 are the discharge equaled or surpassed for the duration of 95%, 85%, and 75% of the observation period, respectively. In the study, ‘low-flow’ threshold is taken as the Q75 discharge, i.e., the flow is equal to or surpassed for the duration of 75% of the observation period which was obtained from the daily discharge data. It is to be noted that the hydrological, topographical and climatic conditions of rivers in India, in general, are quite different, and the approach suggested by Q75 (Jha et al. 2008; Pyrce 2004) may be applicable for Mahanadi River based on actual field conditions.
The reliable prediction of future low flow has many important applications in water resources planning and management. It is also important for the environmental/ecological discharge (Tegos et al. 2018). The importance of low flow encouraged researchers to apply different types of forecasting approaches to evaluate and forecast low flows in rivers. Low flows can be critical in determining how much water must by pass a run-of-river hydro-plant to maintain downstream river ecology and how much is available for power generation in the dry season. “Thermal power stations are dependent on cooling water and information on low flows when the availability of water for abstraction and dilution of cooling water is at a minimum is essential for design purposes” (WMO 2008). For all these applications, there may be a need to forecast flows in order to implement restriction on water use to minimize the risk of very severe restriction in the future. In some instances, licenses to extract water in excess of the available supplies have been issued and thus low-flow forecasts are essential forecast tool. The ultimate goal of the understanding of low-flow processes is to facilitate the development of early warning systems for low-flow adaptation and mitigation which is very crucial in managing water resources in the study river basin. Thus, low-flow assessment plays a crucial role in low-flow managing (Dracup et al. 1980) along with many environmental purposes related to the better management and sustainable development of water resources. Further, detailed information about the various aspect of the low flow can be found in manual on low-flow estimation—prediction by Gustard and Demuth (2009), and a review on low-flow hydrology by Smakhtin (2001).
Theoretical overview
Recurrent neural networks (RNNs)
In recent times, due to successful application of deep learning especially in the field of sequential prediction like statistical language modeling, chaotic time series, ecological modeling for dynamic systems control and finance and marketing motivated researchers to use deep learning for time series forecasting for hydrology events (Assaad et al. 2008; Cinar et al. 2017; Mikolov et al. 2010). The concept behind RNNs is to make use of arbitrarily input data over long sequences, such that it repeats the same task to every element in the sequence and output dependence on the previous computation. In more technicality, it consists of memory cell which captures information till sequence of training data completed. The architecture of RNN’s varies according to its application, many-to-one model (useful when we want to predict at the current time step given all the previous inputs), many-to-many model (useful when we want to predict multiple future time steps at once given all the previous inputs) and several other variations. The final structure selection depends upon the problem statement which depends on phenomena. In our study, many-to-one for one-step ahead forecasting model is used, i.e., to predict the current month’s low-flow value given all the previous month’s low-flow values as input to the model.
RNN is a connectionist model described by interconnections and suitable for modeling temporal dependencies of unspecified duration inputs and the output using internal memory. The feature of RNN is that there is no instantaneous flow of information taking place among the neurons rather than the loops. Thus, it makes possible to keep the influence of the information for a variable at a particular period till the sequential time series complete. The memory of RNN is coded by the recurrent connections, and the output comes from each neuron itself (Assaad et al. 2008). Figure 2 shows a typical RNN structure in unrolled (network of complete sequence) form of full connected network.

Unfolding of Recurrent Neural Network (RNN) (LeCun et al. 2015)
where xt is the input at a time t. The black square in Fig. 2 gets inputs from other neurons at a previous time step xt−1, stis the hidden state at time step t. It is the “memory” of the network. st is calculated based on the previous hidden state and the input at the current step. st captures information about what happened in all the previous time steps and is given by Eq. (1)
yt is the output at step t. For example, if we wanted to predict the next sequence in a time series, it would be a vector of probabilities across the time series. The function f usually is a nonlinear activation function as tanh. RNN shares the same parameters (A, B, W) Fig. 2 across all steps performing the same task at each step, just with different inputs.
Long short-term memory recurrent neural network (LSTM-RNN)
Although the RNNs have the higher competency to deal with nonlinear time series in an effective manner, but there are still some gradient issues to train long time lags, which specially needed for time series forecasting, more specifically for hydrology time series. Also, it has issue with predetermined time lags to learn temporal sequence processing and finding optimal time window size automatically (Gers 2001; Gers et al. 1999). Therefore, to overcome such limitations over RNN, an LSTM-RNN model is adopted in this paper to forecast low flow.
This state-of-the-art approach LSTM-RNN is proposed by Hochreiter and Schmidhuber (1997). The objective of this work is to develop a robust many-to-one LSTM model for hydrological time series. Similar to RNN, LSTM also consists a memory cell (Abidogun 2005) consisting four basic elements: an input gate, a neuron with a self-recurrent connection (a connection to itself), a forget gate and an output gate. The three nonlinear gates present in the block are the summation unit, which controls the inside-outside movement of information via activations cell through multiplications. This multiplication takes place at each input and output cell by their respective gates, while forget gate multiplies previous state (memory cell’s self-recurrent connection) and allowing the cell to forget or remember its previous state using sigmoid activation function. In general, gate activation function (‘ft’) is taken as logistic sigmoid, so that gate activation is between 0 (gate close) and 1 (gate open), whereas tanh or logistic sigmoid is for output activation function (‘Ot’) to overcome the vanishing gradient problem, whose second derivative can sustain for a long range before going to zero. Further, augmentation is possible which depends upon the different problem statement. The weights (‘peephole’ connection) join the cell to the gates, which is presented in Fig. 3, and the rest of the connection is unweighted (or equivalently, a fixed weight). The memory block output connects the rest of the network through output gate multiplication.
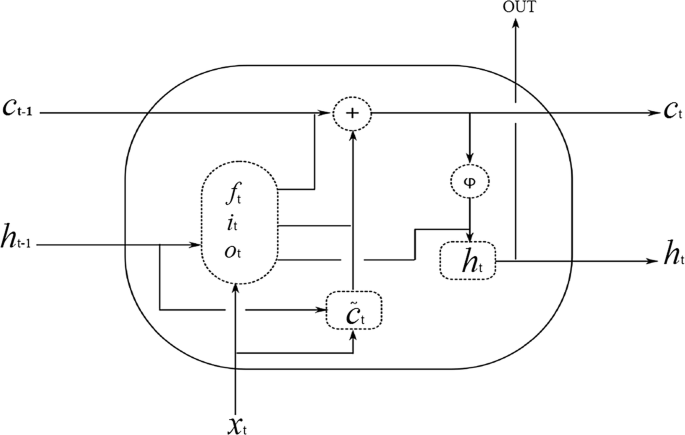
LSTM memory block with one cell with three gated layers: forget gate ft, input gate it and output gate ot, controlling the activation of cells ct−1 and ct
The model input is denoted as x = (x1, …, xj, …, xt), and the output sequence is denoted as \(y = \left( {x_{t + 1} , \ldots ,x_{t + i} , \ldots ,x_{{t + t^{{\prime }} }} } \right)\) where t is prediction period and \(t^{{\prime }}\) is the next time step prediction. In the case of low-flow prediction, x can be considered as historical input data, and y is the single lag period series. The goal of LSTM-RNN is to predict low-flow discharge in the next time step based on previous data and is calculated by the following equation:
where σ denotes the sigmoid function
The memory block is outlined in a box and consists of an input gate, an output gate and a forget gate, where the outputs of three gates are, respectively, represented as follows: \(i_{t} ,o_{t} ,f_{t}\). The activation vectors for each cell and memory block are, respectively, denoted as ct and ht. The weight matrices W and bias vectors b are utilized to build connections between the input layer, output layer and the memory block.
Naïve method
Naïve forecast is the simple and very effective forecasting model and considered as benchmark against most of sophisticated models (Hyndman and Athanasopoulos 2018). Using the naïve approach, forecasts are produced that are equal to the last observed value. Naïve method is also useful for highly seasonal data. The low flows are highly seasonal as in this case, we set each forecast to be equal to the last observed value from the same season of the year (e.g., the same month of the previous year). Suppose the historical data be denoted by, y1, … yT, then forecasting can be denoted by Eq. (8),
where \(\hat{y}_{T + \left. h \right|T}\) is a short-hand for the estimate of \(\hat{y}_{T + h}\) based on the data \(y_{1} , \ldots y_{T}\) and h is the forecast horizon, m is the seasonal period and k is the integer part of (h − 1)/m (i.e., the number of complete years in the forecast period prior to time T + h). This looks more complicated than it really is. For example, with monthly data, the forecast for all future February values is equal to the last observed February value. The interested reader can find more detail about the method in (Hyndman and Athanasopoulos 2018).
Model development and performance evaluation
The objective of study is to implement many-to-one LSTM-RNN model. The assembly of time delay model is developed using “Keras: The Python Deep learning library” (Chollet 2016). The low-flow dataset is divided into training and testing to build the models. The partitioning of the dataset (training and testing) generally varies with the problem of interest. Hence, there is no data division and depend upon problem. We used 70% data for training model and remaining 15% for validation and 15% for testing. Considering the view point of simple model, the RNN has a single-layered topology, i.e., one input layer, one hidden layer and one output layer. LSTM-RNN is constructed using one input layer, one LSTM layer with memory blocks and one output layer. Both the models were tested with 1, 2,3,4 and 5 neurons in the hidden layer with a lag of 1, 3, 6, 9 and 12, and the best configuration was selected based on the RMSE.
A simple data pre-processing step was tested to check model sensitivity, by adopting time series transformation to a logarithmic scale prior training the model (Bandara et al. 2017). Finally, in the post-processing stage, the forecasted value was back-transformed into their actual scale, by taking the exponent of each generated output value. This process is adopted to stabilize the variance of a time series. Firstly, we calculated the Q75 value from the original discharge data. Then, we transformed the Q75, i.e., the low-flow time series in this study using natural logarithm. All the Q75 low-flow time series discharge data are greater than one so while we do log transform of the Q75 time series, there is no chance of getting any value negative. The selection of model architecture includes a selection of model input. Therefore, various time steps were tested in between 1 and 12, and finally 12 time steps were fixed for building the model (Ouyang and Lu 2018). Hence, as input, vector 3D array (number of sample = 468, number of time steps = 12, output = 1) was used to train (70% of the sample data) the model in both cases; in addition, the loss function mean square error and optimizer Adam were used to compile the model as the final step in building the model with 2000 epochs.
Some techniques are recommended for HTS forecasting model performance evaluation according to the published literature related to calibration, validation and application of hydrological models (Schoups et al. 2008). Four performance evaluation criteria used in this study are computed in the following section.
The coefficient of correlation (R)
Root-mean-squared error (RMSE)
Nash–Sutcliffe efficiency coefficient (E NS)
Mean absolute error (MAE)
where \(Q_{{75,{\text{obs}}}}\) = observed Q75; \(Q_{{75,{\text{for}}}}\) = forecasted Q75; \(\bar{Q}_{{75,{\text{obs}}}}\) = average observed; \(\bar{Q}_{{75,{\text{for}}}}\) = average forecasted Q75; N = number of data points.
We used 70% data for training model and remaining 15% for validation and 15% for testing, i.e., from June 1971 to September 1998 for training, from October 1998 to July 2004 for testing and from August 2004 to May 2010 for validation in case of LSTM-RNN and RNN, while for naïve method, we used June 1971 to July 2004 for training and August 2004 to May 2010 for validation.
Result and discussion
As earlier stated, the main purpose of this study is to inspect the suitability of LSTM-RNN for low-flow HTS forecasting and compare with RNN and naïve method.
The outcomes accomplished in this study suggest that the LSTM-RNN method is an effective technique to model the monthly low-flow discharge time series and can give significant prediction performance than the traditional RNN and benchmark naïve method for time series approaches. The results indicate that the best performance can be obtained by LSTM-RNN with a lag of 12 considering RMSE evaluation criteria during the validation phases (Table 1). For RNN, the best performance is also obtained at lag 12.
Overall, the RNN and LSTM-RNN models can give good prediction performance and could be successfully applied to establish the forecasting models that could provide accurate and reliable monthly low-flow prediction. But long-range dependence (also known as the Hurst phenomenon) cannot be modeled by AI learning regression models. This modeling can be made within stochastic frameworks and is mostly important for probabilistic forecasting (long-range dependence leads to wider prediction intervals)(Tyralis and Koutsoyiannis 2014). The results suggest that the LSTM-RNN model was superior to the RNN for monthly low-flow time series forecasting at Basantapur station in the Mahanadi River basin. From Table 1, it is observed that the LSTM–RNN has outperformed in forecasting low flow for the representative station in the Mahanadi River basin compared to RNN and naïve method. The Nash–Sutcliffe model efficiency coefficient (ENS) is 0.889 for LSTM-RNN, 0.825 for RNN and 0.704 for naïve method indicating LSTM-RNN has better predictive power than other two methods. When comparing forecast methods applied to a single time series or to several time series with the same units, the MAE is popular as it is easy to both understand and compute. A forecast method that minimizes the MAE will lead to forecasts of the median, while minimizing the RMSE will lead to forecasts of the mean. It is clearly seen from Table 1 that LSTM–RNN has MAE 0.361 which is better than RNN’s MAE 0.391. For this case study of forecasting low flow for the station Basantapur in the Mahanadi River basin, the LSTM-RNN LSTM-RNN’s performance is increased by 7.67% than the performance of RNN. However, a large comparison study can be used to provide generalized results about the forecasting performance of black box models (e.g., LSTM-RNN, RNN, ANN) (Papacharalampous et al. 2018a, c, 2019; Tyralis and Papacharalampous 2018). Figures 4 and 5 show the LSTM-RNN plots of data during training, testing and validation period, and Fig. 6 showing the training and validation results for naïve method. The scatterplot of the forecasted versus observed Q75 during the validation period is shown in Figs. 7, 8 and 9, respectively, for LSTM-RNN, RNN and naïve method.

Training (from June 1971 to September 1998), testing (from October 1998 to July 2004) and validation (from August 2004 to May 2010) for LSTM-RNN

Training (from June 1971 to September 1998), testing (from October 1998 to July 2004) and validation (from August 2004 to May 2010) for RNN

Training (from June 1971 to July 2004) and validation (from August 2004 to May 2010) for naïve method

Scatterplot of the forecasted versus their corresponding observed Q75 values for LSTM-RNN in the validation period

Scatterplot of the forecasted versus their corresponding observed Q75 values for RNN in the validation period

Scatterplot of the forecasted versus their corresponding observed Q75 values for naïve method in the validation period
Conclusions
An effort was made in this paper to explore the suitability of LSTM-RNN over RNN for hydrological time series. As a case study, monthly low-flow discharge data are used to implement the forecasting models. The standard statistical performance evaluation measures are adopted to evaluate the performances of various models applied.
LSTM-RNN’s ability to forget, remember and update the information pushes it one-step ahead of RNN. The results obtained in this study indicate that the LSTM-RNN method can be used to model low-flow HTS at Basantapur station in the Mahanadi River basin, India, and can give satisfactory performance over RNN and naïve method. LSTM-RNN is well-suited to learn from experience to classify, process and predict time series given time lags of unknown size and bound between important events. Time series prediction involves processing of patterns that evolve the appropriate response at a particular point in time and depends not only on the current value of the observable but also in the past.
Therefore, the results of the study are encouraging, and the authors advocate that LSTM-RNN approaches can be used in modeling the low-flow hydrological time series for the selected station, and this may provide some ideas for researchers and engineers who apply data-driven AI approaches for modeling low-flow hydrological time series forecasting. This work recommends the performance of such model can be improved for low-flow hydrological time series forecasting by adopting several stacked layers (multiple hidden LSTM layers) and a GRU (Gated Recurrent Unit) LSTM that would be scope of this work.
References
Abidogun OA (2005) Data mining, fraud detection and mobile telecommunications: call pattern analysis with unsupervised neural networks. University of the Western Cape, Cape Town
Abiodun OI, Jantan A, Omolara AE, Dada KV, Mohamed NA, Arshad H (2018) State-of-the-art in artificial neural network applications: a survey. Heliyon 4:e00938
Ahn KH, Palmer RN (2016) Use of a nonstationary copula to predict future bivariate low flow frequency in the Connecticut river basin. Hydrol Process 30:3518–3532
Arena C, Cannarozzo M, Mazzola MR (2006) Multi-year drought frequency analysis at multiple sites by operational hydrology–a comparison of methods. Phys Chem Earth Parts A/B/C 31:1146–1163
ASCE (2000a) Artificial neural networks in hydrology. I: Preliminary concepts. J Hydrol Eng 5:115–123
ASCE (2000b) Artificial neural networks in hydrology. II: Hydrologic applications. J Hydrol Eng 5:124–137
Assaad M, Boné R, Cardot H (2008) A new boosting algorithm for improved time-series forecasting with recurrent neural networks. Inf Fusion 9:41–55
Atiya AF, El-Shoura SM, Shaheen SI, El-Sherif MS (1999) A comparison between neural-network forecasting techniques-case study: river flow forecasting. IEEE Trans Neural Netw 10:402–409
Bandara K, Bergmeir C, Smyl S (2017) Forecasting across time series databases using long short-term memory networks on groups of similar series. arXiv preprint arXiv:171003222
Beven KJ (2012) Rainfall-runoff modelling: the primer. Wiley, New York
Box G, Jenkins G (1970) Time series analysis; forecasting and control. Holden-Day, San Francisco
Carlson RF, MacCormick A, Watts DG (1970) Application of linear random models to four annual streamflow series. Water Resour Res 6:1070–1078
Chang F, Chang LC, Huang HL (2002) Real-time recurrent learning neural network for stream-flow forecasting. Hydrol Process 16:2577–2588
Chen H-L, Rao AR (2002) Testing hydrologic time series for stationarity. J Hydrol Eng 7:129–136
Cheng C, Chau K, Sun Y, Lin J (2005) Long-term prediction of discharges in Manwan Reservoir using artificial neural network models. Adv Neural Netw 2005:975
Chollet F (2016) Keras. https://github.com/fchollet/keras/tree/master/keras
Cinar YG, Mirisaee H, Goswami P, Gaussier E, Aït-Bachir A, Strijov V (2017) Position-based content attention for time series forecasting with sequence-to-sequence RNNs. In: International conference on neural information processing. Springer, pp 533–544
Demirel MC, Booij MJ, Hoekstra AY (2013) Identification of appropriate lags and temporal resolutions for low flow indicators in the River Rhine to forecast low flows with different lead times. Hydrol Process 27:2742–2758
Dimitriadis P, Koutsoyiannis D (2015) Climacogram versus autocovariance and power spectrum in stochastic modelling for Markovian and Hurst-Kolmogorov processes. Stoch Environ Res Risk Assess 29:1649–1669
Dimitriadis P, Koutsoyiannis D, Tzouka K (2016) Predictability in dice motion: how does it differ from hydro-meteorological processes? Hydrol Sci J 61:1611–1622
Dracup JA, Lee KS, Paulson EG (1980) On the definition of droughts. Water Resour Res 16:297–302
Fang K, Shen C, Kifer D, Yang X (2017) Prolongation of SMAP to spatiotemporally seamless coverage of continental US using a deep learning neural network. Geophys Res Lett 44:11–15
Firat M, Güngör M (2007) River flow estimation using adaptive neuro fuzzy inference system. Math Comput Simul 75:87–96
Firat M, Güngör M (2008) Hydrological time-series modelling using an adaptive neuro-fuzzy inference system. Hydrol Process 22:2122–2132
Gárfias-Soliz J, Llanos-Acebo H, Martel R (2010) Time series and stochastic analyses to study the hydrodynamic characteristics of karstic aquifers. Hydrol Process 24:300–316
Gers F (2001) Long short-term memory in recurrent neural networks Unpublished PhD dissertation. Ecole Polytechnique Fédérale de Lausanne, Lausanne
Gers FA, Schmidhuber J, Cummins F (1999) Learning to forget: continual prediction with LSTM. 850–855
Giuntoli I, Renard B, Vidal J-P, Bard A (2013) Low flows in France and their relationship to large-scale climate indices. J Hydrol 482:105–118
Gustard A, Demuth S (2009) Manual on low-flow estimation and prediction. Opera
Hipel KW, McLeod AI (1994) Time series modelling of water resources and environmental systems, vol 45. Elsevier, Amsterdam
Hochreiter S, Schmidhuber J (1997) Long short-term memory. Neural Comput 9:1735–1780
Hu T, Lam K, Ng S (2001) River flow time series prediction with a range-dependent neural network. Hydrol Sci J 46:729–745
Hyndman RJ, Athanasopoulos G (2018) Forecasting: principles and practice. OTexts, Melbourne
Jain A, Kumar AM (2007) Hybrid neural network models for hydrologic time series forecasting. Appl Soft Comput 7:585–592
Jha R, Smakhtin V (2008) A review of methods of hydrological estimation at ungauged sites in India, vol 130. IWMI, Colombo
Jha R, Sharma K, Singh V (2008) Critical appraisal of methods for the assessment of environmental flows and their application in two river systems of India. KSCE J Civ Eng 12:213–219
Keskin ME, Taylan D, Terzi O (2006) Adaptive neural-based fuzzy inference system (ANFIS) approach for modelling hydrological time series. Hydrol Sci J 51:588–598
Kişi Ö (2007) Streamflow forecasting using different artificial neural network algorithms. J Hydrol Eng 12:532–539
Kisi O, Cimen M (2011) A wavelet-support vector machine conjunction model for monthly streamflow forecasting. J Hydrol 399:132–140
Komorník J, Komorníková M, Mesiar R, Szökeová D, Szolgay J (2006) Comparison of forecasting performance of nonlinear models of hydrological time series. Phys Chemi Earth Parts A/B/C 31:1127–1145
Koutsoyiannis D, Langousis A (2011) Precipitation, Treatise on Water Science, edited by P. Wilderer and S. Uhlenbrook, 2, 27–78. Academic Press, Oxford
Koutsoyiannis D, Yao H, Georgakakos A (2008) Medium-range flow prediction for the Nile: a comparison of stochastic and deterministic methods/Prévision du débit du Nil à moyen terme: une comparaison de méthodes stochastiques et déterministes. Hydrol Sci J 53:142–164
Laaha G, Blöschl G (2005) Low flow estimates from short stream flow records—a comparison of methods. J Hydrol 306:264–286
LeCun Y, Bengio Y, Hinton G (2015) Deep learning. Nature 521:436
Lin J-Y, Cheng C-T, Chau K-W (2006) Using support vector machines for long-term discharge prediction. Hydrol Sci J 51:599–612
Mikolov T, Karafiát M, Burget L, Cernocký J, Khudanpur S (2010) Recurrent neural network based language model. In: Interspeech, p 3
Nayak PC, Sudheer K, Rangan D, Ramasastri K (2004) A neuro-fuzzy computing technique for modeling hydrological time series. J Hydrol 291:52–66
Ouyang Q, Lu W (2018) Monthly rainfall forecasting using echo state networks coupled with data preprocessing methods. Water Resour Manag 32:659–674
Papacharalampous G, Tyralis H, Koutsoyiannis D (2018a) One-step ahead forecasting of geophysical processes within a purely statistical framework. Geosci Lett 5:12
Papacharalampous G, Tyralis H, Koutsoyiannis D (2018b) Predictability of monthly temperature and precipitation using automatic time series forecasting methods. Acta Geophys 66(4):807–831
Papacharalampous G, Tyralis H, Koutsoyiannis D (2018c) Univariate time series forecasting of temperature and precipitation with a focus on machine learning algorithms: a multiple-case study from Greece. Water Resour Manag 32:5207–5239
Papacharalampous GA, Tyralis H, Koutsoyiannis D (2019) Comparison of stochastic and machine learning methods for multi-step ahead forecasting of hydrological processes. Stoch Environ Res Risk Assess. https://doi.org/10.1007/s00477-018-1638-6
Pyrce R (2004) Hydrological low flow indices and their uses Watershed Science Centre, (WSC) Report
Sahoo S, Russo T, Elliott J, Foster I (2017) Machine learning algorithms for modeling groundwater level changes in agricultural regions of the US. Water Resour Res 53(5):3878–3895
Sahoo BB, Jha R, Singh A, Kumar D (2018) Application of support vector regression for modeling low flow time series. KSCE J Civ Eng 23(2):923–934
Salas JD (1993) Analysis and modeling of hydrologic time series. In: Maidment DR (ed) Handbook of hydrology, vol 19. McGraw Hill, New York, pp 19.1–19.72
Sang Y-F (2013) A review on the applications of wavelet transform in hydrology time series analysis. Atmos Res 122:8–15
Sang Y-F, Wang D, Wu J-C, Zhu Q-P, Wang L (2009) The relation between periods’ identification and noises in hydrologic series data. J Hydrol 368:165–177
Schoups G, Van de Giesen N, Savenije H (2008) Model complexity control for hydrologic prediction. Water Resources Res 44:W00B03
Sivapragasam C, Liong S-Y, Pasha M (2001) Rainfall and runoff forecasting with SSA–SVM approach. J Hydroinform 3:141–152
Sivapragasam C, Vincent P, Vasudevan G (2007) Genetic programming model for forecast of short and noisy data. Hydrol Process 21:266–272
Smakhtin V (2001) Low flow hydrology: a review. J Hydrol 240:147–186
Srikanthan R, McMahon T (2001) Stochastic generation of annual, monthly and daily climate data: a review. Hydrol Earth Syst Sci Discuss 5:653–670
Tegos A, Schlüter W, Gibbons N, Katselis Y, Efstratiadis A (2018) Assessment of environmental flows from complexity to parsimony—lessons from Lesotho. Water 10:1293
Toth E, Brath A, Montanari A (2000) Comparison of short-term rainfall prediction models for real-time flood forecasting. J Hydrol 239:132–147
Tyralis H, Koutsoyiannis D (2014) A Bayesian statistical model for deriving the predictive distribution of hydroclimatic variables. Clim Dyn 42:2867–2883
Tyralis H, Papacharalampous G (2017) Variable selection in time series forecasting using random forests. Algorithms 10:114
Tyralis H, Papacharalampous GA (2018) Large-scale assessment of Prophet for multi-step ahead forecasting of monthly streamflow. Adv Geosci 45:147–153
Wang W-C, Chau K-W, Cheng C-T, Qiu L (2009) A comparison of performance of several artificial intelligence methods for forecasting monthly discharge time series. J Hydrol 374:294–306
WMO (2008) Manual on low flow estimation and prediction. WMO, Geneva
Wunsch A, Liesch T, Broda S (2018) Forecasting groundwater levels using nonlinear autoregressive networks with exogenous input (NARX). J Hydrol 567:743–758
Xu L, Chen N, Zhang X, Chen Z (2018) An evaluation of statistical, NMME and hybrid models for drought prediction in China. J Hydrol 566:235–249
Yaseen ZM, El-Shafie A, Jaafar O, Afan HA, Sayl KN (2015) Artificial intelligence based models for stream-flow forecasting: 2000–2015. J Hydrol 530:829–844
Yaseen ZM, Jaafar O, Deo RC, Kisi O, Adamowski J, Quilty J, El-Shafie A (2016) Stream-flow forecasting using extreme learning machines: a case study in a semi-arid region in Iraq. J Hydrol 542:603–614
Yaseen ZM, Fu M, Wang C, Mohtar WHMW, Deo RC, El-Shafie A (2018) Application of the hybrid artificial neural network coupled with rolling mechanism and grey model algorithms for streamflow forecasting over multiple time horizons. Water Resour Manag 32(5):1883–1899
Zhang D, Lindholm G, Ratnaweera H (2018a) Use long short-term memory to enhance Internet of Things for combined sewer overflow monitoring. J Hydrol 556:409–418
Zhang J, Zhu Y, Zhang X, Ye M, Yang J (2018b) Developing a Long Short-Term Memory (LSTM) based model for predicting water table depth in agricultural areas. J Hydrol 561:918–929
Zounemat-Kermani M, Teshnehlab M (2008) Using adaptive neuro-fuzzy inference system for hydrological time series prediction. Appl Soft Comput 8:928–936
Author information
Authors and Affiliations
Corresponding author
Ethics declarations
Conflict of interest
On behalf of all authors, the corresponding author states that there is no conflict of interest.
Rights and permissions
About this article

Cite this article
Sahoo, B.B., Jha, R., Singh, A. et al. Long short-term memory (LSTM) recurrent neural network for low-flow hydrological time series forecasting. Acta Geophys. 67, 1471–1481 (2019). https://doi.org/10.1007/s11600-019-00330-1
Received:
Accepted:
Published:
Issue Date:
DOI: https://doi.org/10.1007/s11600-019-00330-1