
Abstract
Jams are preparations of fruits whose main preserving agent is sugar. Due to this, health concerns of consumers have resulted in a sugar reduction, and its replacement using alternative sweeteners and introducing new ingredients enhancing nutritional properties. In this study, four types of fruits jams (plum, strawberry, apple, and peach), with or without sugar, were prepared using two microalgae biomass, Arthrospira platensis (Spirulina) and Chlorella vulgaris, and Dunaliella salina extract as ingredients at different mix levels of concentrations, 0.10%–0.10%–0.05% respectively, for plum; 0.04%–0.00%–0.01 respectively, for strawberry; 0.06%–0.04%–0.00% respectively, for apple and 0.00%–0.01%–0.04% respectively, for peach. Physicochemical, rheological, and textural parameters were evaluated. Substitution of sugar/fructose syrup in the jam’s preparation caused changes in pH values, solid soluble content, and rheological and textural properties compared to sugar jams. Using sugar or sweeteners as isomalt, stevia and sucralose and microalgae biomass or extract showed significant changes in colour coordinates, however, these differences were not perceptible by the human eye. Jams containing microalgae biomass-extract showed higher G', G'', G*, and η* values than their corresponding control samples. All the jams presented weak-gel characteristics, distinguishing fruit jams. However, the results of weak-gel model analysis suggest that the influence of the different ingredients in the food system depends not only on their concentration but also on the interactions in the gel structure. Strawberry and apple jams showed no significant differences between microalgae biomass-extract samples and control samples, for both sugar and no sugar added jams being the best-obtained samples.
Introduction
Jam is defined as an intermediate moisture food obtained when boiling fruit pulp with sugar, pectin, acid, and other ingredients such as preservatives, colouring agents, and flavouring; and their composition is controlled by law worldwide [1]. Plum, strawberry, apple, and peach are fruit pulp commonly used in the jam production industry, highly popular in Europe, not only because of their high content in vitamins and minerals but also because of their organoleptic characteristics such as taste and aroma [2,3,4]. During the manufacturing process, all the mixed ingredients show gelation behaviours to obtain a reasonably thick consistency, because of the commercially desired rheological and textural characteristics [5]. However, rheological and textural understanding of fruit gel-based products is gaining interest because of their increasing importance in the modern-day diet, focusing on wellness and lower calorific intake, especially for diabetics and special needs. According to the World Health Organization (WHO) [6], keeping intake of sugars to less than 10% of total energy intake leads to reducing the risk of overweight, obesity, and tooth decay. Hence, they recommend adults and children reduce their daily intake of sugars to less than 10% of their total energy intake, and ideally less than 5% [6]. Thus, the dietary awareness of consumers has resulted in the reduction of the sugar content of commercially prepared foods like jams, and its replacement with alternative sweeteners or a mix of them, directly affecting the rheological and textural properties [7]. High-intensity sweeteners as polyols and especially, natural sweeteners as stevia are becoming more popular for not providing calories but giving sweet flavour to food formulations adding to the pleasure of eating [8, 9]. They are used on a large scale by the food industry due to their good technological properties as thickeners or humectants; they are resistant to heat and are not involved in Maillard reactions [10]. Furthermore, microalgae are a source of several valuable compounds with health benefits such as proteins, carbohydrates, polyunsaturated fatty acids, essential minerals, and vitamins [11], which can increase the nutritional value of food products upon incorporation. The most important microalgae strains cultured today are Arthrospira platensis (Spirulina), Chlorella vulgaris, and Dunaliella salina. The cyanobacterium Spirulina, also considered microalgae, has a high protein content (65% of dry weight) and is a rich source of vitamin B12 and provitamin A, minerals, especially iron, and is a natural source of γ-linolenic acid [12]. Likewise, C. vulgaris is considered a potential source of protein (55% of dry weight), omega-6 family; which includes arachidonic acid; folate, vitamin B12, and iron. Furthermore, D. salina extract has the highest content of β-carotene and an eicosapentaenoic acid content of up to 39% of total fatty acids. These strains of microalgae and extracts have anti-inflammatory effects and a health-promoting factor in many kinds of disorders such as gastric ulcers, wounds, constipation, anaemia, hypertension, and diabetes [11]. Incorporating microalgal biomass in traditional food products, such as bakery products, is a global trend, as several products have been launched worldwide. In these cases, microalgae addition has improved freshness and modify firmness, nutritional values, and colour [13, 14]. Other novel applications for microalgae include emulsions and soups [15,16,17]. Therefore, the food industry must develop new formulations reducing or replacing the sugar content during food production, also enhancing their properties, achievable by adding novel ingredients like microalgae. However, so far microalgae addition in jams has not been studied.
This study aimed to analyse how the addition of two microalgae biomasses, A. platensis and C. vulgaris, and D. salina extract mixed at different levels of concentrations along with sugar/fructose syrup or a sweetener mix affects pH, °Brix, soluble solid content, colour, and rheological and textural properties of four types of fruit jams, plum, strawberry, apple, and peach.
Materials and methods
Materials
Freeze-dried A. platensis (Spirulina) and C. vulgaris (Chlorella) biomasses were supplied by AlgaEnergy S.A. (Madrid, Spain), and D. salina (Dunaliella) extract, by ROHA Europe S.L.U. (Torrent, Spain). Fruit pulp (plum, strawberry, apple, and peach), sweetener mix (isomalt, stevia (Stevia Rebaudiana) and sucralose) and the other ingredients used for the different formulations (Table 1) were supplied by Jumel Alimentaria S.A. (L’Alqueria de la Comtessa, Spain).
Preparation of jams
The jams were prepared according to the procedure provided by Jumel Alimentaria S.A. (L’Alqueria de la Comtessa, Spain). Table 1 describes the ingredients and quantities used for all the samples.
Sugar jams preparation
All ingredients were weighed separately (Table 1). Soluble solid content (SSC) of the fruit pulp was determined as 16 ºBrix for plum pulp, 6 ºBrix for strawberry pulp, 10 ºBrix for apple pulp, and 11 ºBrix for peach pulp. For each type of jam, water and the fruit pulp were added to a kitchen appliance (Thermomix, TM31, Vorwerk Corporate Group, Wuppertal, Germany) and mixed at speed two (200 rpm) for 3 min. Then the mixture was heated until reaching 70 °C, obtaining a homogeneous product. Afterwards, granulated sugar, fructose syrup, and xanthan gum were added to the mixture and blended until reaching 80 °C at speed three (400 rpm). Then, citric acid, potassium sorbate and pectin were added to the mixture and blended for 3 min. At this stage, SSC was around 40 ºBrix. The product was hot-packaged in sterilised 370 mL glass jam jars and subsequently sealed, then inverted, so the hot jam contacted the lid surface [18], in cold water at 5 °C for 5 min to maintain the maximum colour in the product. Jam samples were stored at 4 °C for further studies.
No added sugar jams preparation
The preparation used the same equipment and conditions as Sect. 2.2.1. The ingredients were added in the same order except using the sweeteners mix instead of granulated sugar and fructose syrup. Moreover, xanthan gum was not added in this formulation. Here, SSC content was around 21 ºBrix.
The jams were formulated, replacing part of the water with the microalgae biomass (Spirulina and Chlorella) and extract (Dunaliella) mix for each fruit type, for jams and no sugar added jams (Table 1). The biomass was added to the mixture when the temperature reached 80 °C. The microalgae biomass-extract mix levels were determined according to previous sensorial trials from the company (Jumel Alimentaria S.A., L’Alqueria de la Comtessa, Spain) (data not shown), then the mixture was blended for 2 min. Likewise, the product was hot-packaged in sterilised 370 mL glass jam jars, subsequently sealed and inverted so the hot jam contacts the lid surface [18] in cold water at 5 °C for 5 min. Jam samples were stored at 4 °C for further studies.
Physicochemical analysis
Water activity (aw) of samples were determined using an AquaLab Dewpoint Water Activity Meter 4TE (Decagon Devices Inc., Pullman, WA, USA). SSC of samples, reported as °Brix, were measured with a digital pocket refractometer PAL-1 (ATAGO CO., LTD, Tokyo, Japan). pH values of samples were measured using a pHmeter Crison MultiMeter MM 41 (Hach Lange Spain S.L.U., L’Hospitalet de Llobregat, Spain). Samples were analysed in triplicate at 20 °C on the same day of production.
Colour measurement
Colour coordinates were obtained using a Konica Minolta CM-700d colorimeter (Konica Minolta CM-700d/600d series, Tokyo, Japan) with standard illuminant D65 and visual angle of 10°. Jam samples were individually spread out on circular glass sample holders, 50 mm diameter and 10 mm height, and the L*a*b* values were measured at three equidistant points, where L* indicates lightness (0—black, 100—white); a*, chromaticity on a green (−) to red ( +) axis; and b*, chromaticity on a blue (−) to yellow ( +) axis, according to the CIEL*a*b* system (CIE, 1986). Chroma, C*ab (saturation) and hue angle, h°ab, were also calculated, defined by Eqs. 1 and 2, respectively.
The total colour difference (ΔE) between control samples and microalgae biomasses-extract samples for each type of formulations were determined using L*a*b* values according to Eq. 3.
The measurements were conducted under constant lighting conditions, at 20 °C on the same day of production.
Dynamic rheology
A dynamic oscillatory Kinexus pro + rotational rheometer (Malvern Instruments, Worcestershire, UK) and rSpace software; equipped with a 25 mm diameter parallel-plate geometry (DSR II, Upper Plate) with a 2.0 mm gap between plates and a heat-controlled sample stage (Peltier Cylinder Cartridge, Malvern Instruments, Worcestershire, UK) were used to determine the jam samples viscoelastic properties. Before each measurement, samples were loaded onto the geometry plate and rested for 300 s.
All tested samples were measured using oscillatory sweeps at a frequency ranging from 0.1 to 10 Hz at 0.01 Pa stress (which was within the linear viscoelastic region as determined by an amplitude sweep). The mechanical spectra were obtained recording the elastic modulus (G' (Pa)), related to the material response as a solid; viscous modulus (G'' (Pa)), related to the material response as a fluid; complex viscosity (η* (Pa·s)), used to describe the total resistance to flow of a material considered a viscous-liquid; and the complex modulus (G* (Pa)), a quantitative measure of material stiffness or total resistance of the material to deformation as a function of the frequency range. The loss angle values (tan δ) as a function of frequency, defined as the ratio of G'' to G', were also calculated [7, 19, 20].
SigmaPlot Software version 11.0 (Systat Software Inc., San Jose, CA, USA) was used to fit rheological data to power law equations. Samples were performed in triplicate at 20 °C on the day after their preparation.
Textural analysis
The texture was measured using a TA-XT2 Texture Analyser (Stable Micro Systems Ltd, Godalming, UK) with the software Texture Exponent (version 6.1.12.0) (Stable Micro Systems Ltd). A standard size back extrusion container (50 mm diameter) was filled with 60 mL of sample. A compression plate (35 mm diameter) attached to a 50 kg load cell compress was positioned centrally over the container, compressing the sample at pre- and test-speeds of 1.0 mm/s and a post-test speed of 10 mm/s.
The textural parameters of jam samples are expressed as firmness (N), defined as the maximum force on a product that displays substantial resistance to deformation; Consistency (N.s), defined as the maximum force necessary to overcome the attractive forces between the surface of the sample and the surface of the platen with which the sample comes in contact; Cohesiveness (N), defined as the total force required to carry out the shearing process the maximum negative force of the samples; and index of viscosity (N.s), defined as the force involved in the withdrawal of the plate from the sample [21]. Samples were performed in triplicate at 20 °C on the day after their preparation.
Statistical analysis
Analysis of variance (ANOVA) using Statgraphics Centurion 18 Software, version 18.1.13 (Statgraphics Technologies, Inc. The Plains, VA, USA) with a confidence level of 95% (p < 0.05) was applied to evaluate the differences among each type of jam samples.
Results and discussion
The jam formulations were developed based on company experience in creating formulations for the fruit processing industry, producing sugar jams (plum (G), strawberry (S), apple (A), and peach (P)) and no added sugar jams (plum (SG), strawberry (SS), apple (SA), and peach (SP)). The quantity of microalgae biomass and extracts added in their formulations are shown in Table 1.
Physicochemical properties
Water activity (aw), SSC (°Brix) and pH of food materials are considered important factors influencing jam stability [22]. Sugar in jams reduces the aw to 0.86–0.88 (Fig. 1) showing no significant differences (p > 0.05) between the control and microalgae biomass-extract samples for each type of jam. Sugar acts as a preservative in gelled products, like jams, by reducing the water activity and enhancing the stability, preventing the growth of yeasts and microbes [1, 18]. Nevertheless, the aw in no added sugar jams showed significant differences (p < 0.05), presenting higher values (0.90–0.91) than the sugar jam samples. Overall, aw values are within the tolerance of 0.82–0.94 for jams and jellies [23] agreeing with other authors [24,25,26]. Sugar jam’s SSC was around 40°Brix and for no added sugar jams, around 18°Brix. These values were expected because the conditions of both processes were set to give a product with SSC within the regulations for sugar and no added sugar jams [27, 28]. No SSC significant differences (p > 0.05) were found between control and microalgae biomass-extract samples for each type of fruit. Comparing SSC values between sugar jams and no added sugar jams a logical significant difference (p < 0.05) was observed. The lowest values of SSC were observed for the different no added sugar jams, where a mix of sweeteners was added in the formulations instead of sugar/glucose syrup. SSC are primarily represented by sugars, with acids and minerals contributing [29]. Thus, ingredients like sugar and fructose syrup in the formulation allow higher content of soluble solids and simultaneously reduce the aw of the samples. pH values of all jam samples were between 3.6 and 3.9 (Fig. 1), and therefore, are considered microbiologically stable (pH lower than 4.0) because of adding citric acid, potassium sorbate and pasteurisation as the final stage of the jam production process [4, 18, 24].
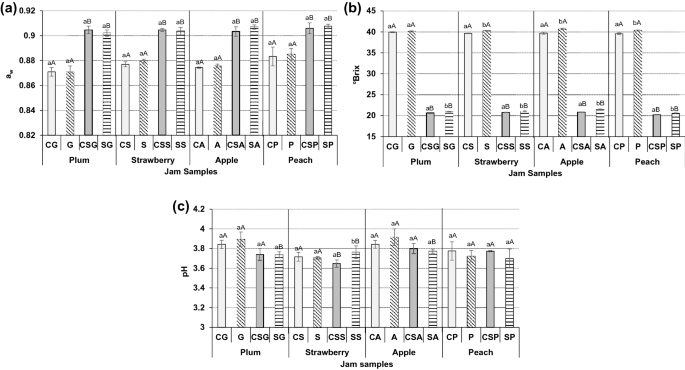
Water activity (aw), Soluble solid content (SSC, °Brix), and pH of fruit jams. Sugar plum jam (G) and its control (CG), no sugar added plum jam (SG) and its control (CSG). Sugar strawberry jam (S) and its control (CS), no sugar added strawberry jam (SS) and its control (CSS). Sugar apple jam (A) and its control (CA), no sugar added apple jam (SA) and its control (CSA). Sugar peach jam (P) and its control (CP), no sugar added peach jam (SP) and its control (CSP). For microalgae-enriched jam, the same superscript small letter within type of fruit indicates homogeneous groups established by ANOVA (p < 0.05) comparing each control formulation for both, sugar jams, and no sugar added jams. For sugar jams and no sugar added jams, the same superscript capital letter within type of fruit indicates homogeneous groups established by ANOVA (p < 0.05) comparing control jam samples and microalgae-enriched jam samples
Colour measurements
Figure 2 shows the mean values and standard deviation of studied colour coordinates. All analysed colour coordinates of the strawberry jams presented significant differences with sugar addition (p < 0.05), but no significant changes were seen when microalgae was added (p > 0.05). However, L*, a*, b*, h°ab, and C*ab of plum jams were significantly affected by sugar and microalgae addition (p < 0.05). Apple jam’s L*, b*, and C*ab values were affected by sugar and microalgae addition, whereas the apple jams a* and h°ab values were only affected by sugar addition. In contrast, the peach jam’s L*, b*, and C*ab values were only affected by sugar addition and the peach jam’s a* and h°ab values were affected by sugar and microalgae addition. Using sugar instead of sweeteners mix in jam formulations increased a* values in the final product. Moreover, in all jams, except strawberry jams, this increased b* values and reduced L* values of the final product. This could be a consequence of Maillard reactions, which contributes to a dark colour (lower L*) as was observed in other studies [30]. Other authors also observed that kiwifruit puree treated thermally without sugar were more luminous than fresh samples [31]. The plum jam’s L* values (Fig. 2a) changed with microalgae addition, but the trend was opposite between sugar jams and no added sugar jams. Sugar plum jams were more luminous when microalgae were added (G) compared with its control (CG), however, no added sugar plum jams were less luminous when microalgae were added (SG) compared with its control (CSG). The same behaviour was observed in apple jams. A significant decrease of a* values (Fig. 2b) with the microalgae addition in plum and peach jams with sugar (p < 0.05) was observed, whereas these jams with the sweeteners mix and microalgae suffered a significant increase of a* values (p < 0.05). These a* variations were reflected in h* values, showing an h°ab increase with microalgae addition in jams with sugar and a h°ab decrease with microalgae addition in no added sugar jams (Fig. 2e). ΔE values were closer to 3 units (Fig. 2f), therefore these differences were not detected by the human eye [32]. Moreover, there were no significant differences between jams with sugar or the sweeteners mix (p > 0.05).
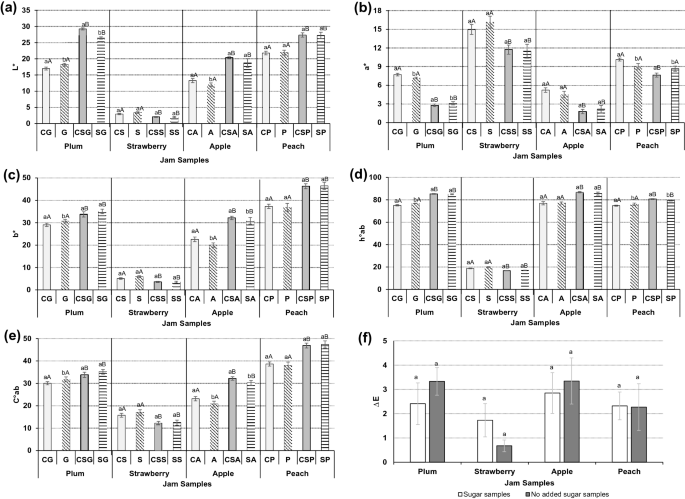
Color parameters a L*, b a*, c b*, d h°ab, e C*ab, and f ΔE of jams samples. Sugar plum jam (G) and its control (CG), no sugar added plum jam (SG) and its control (CSG). Sugar strawberry jam (S) and its control (CS), no sugar added strawberry jam (SS) and its control (CSS). Sugar apple jam (A) and its control (CA), no sugar added apple jam (SA) and its control (CSA). Sugar peach jam (P) and its control (CP), no sugar added peach jam (SP) and its control (CSP). For microalgae-enriched jam, the same superscript small letter within type of fruit indicates homogeneous groups established by ANOVA (p < 0.05) comparing each control formulation for both, sugar jams, and no sugar added jams. For sugar jams and no sugar added jams, the same superscript capital letter within type of fruit indicates homogeneous groups established by ANOVA (p < 0.05) comparing control jam samples and microalgae-enriched jam samples
According to colour results, using sugar or the sweeteners mix, and microalgae showed changes in colour coordinates, however, these differences were not perceptible.
Rheological and viscoelastic characterisation
Dynamic rheology
Rheological properties of jam are mainly affected by the amount and type of sugar added, proportion and type of gelling agent used, fruit pulp content, synergy with other ingredients, and process temperature [7]. Figure 3 shows the dynamic mechanical spectra of the jam samples as functions of frequency (Hz). Elastic modulus (G') was higher than the viscous modulus (G'') for all samples, and both parameters progressively increased throughout the studied frequency range. Furthermore, the loss angle (tan δ) values for all jam samples were greater than 0.1 (Table 2). This behaviour may be rheologically classified as a gel-like behaviour, characteristic of fruit jams [7, 29]. According to Fig. 4, complex viscosity (η*) was also frequency dependent since η* decreased as the frequency increased. These results suggest molecular interactions could form gel structure at low frequency but gave rise to a fragmented structure at a higher frequency [34].
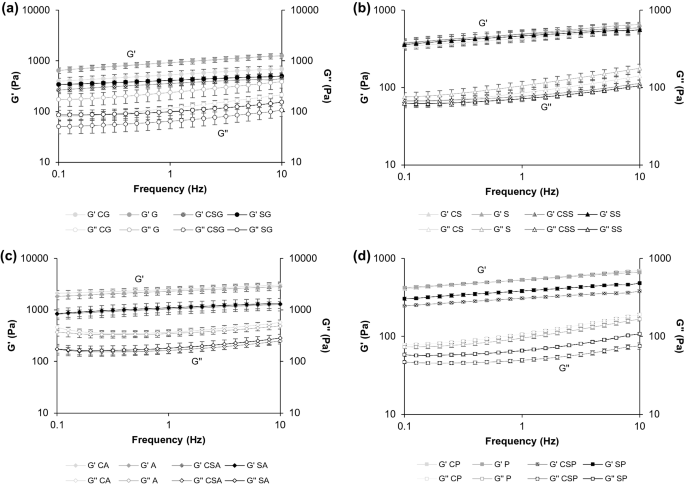
Frequency sweeps of jams. Elastic modulus (G') and viscous modulus (G'') of a plum jams, b strawberry jams, c apple jams, and d peach jams different formulations. Sugar plum jam (G) and its control (CG), no sugar added plum jam (SG) and its control (CSG). Sugar strawberry jam (S) and its control (CS), no sugar added strawberry jam (SS) and its control (CSS). Sugar apple jam (A) and its control (CA), no sugar added apple jam (SA) and its control (CSA). Sugar peach jam (P) and its control (CP), no sugar added peach jam (SP) and its control (CSP)
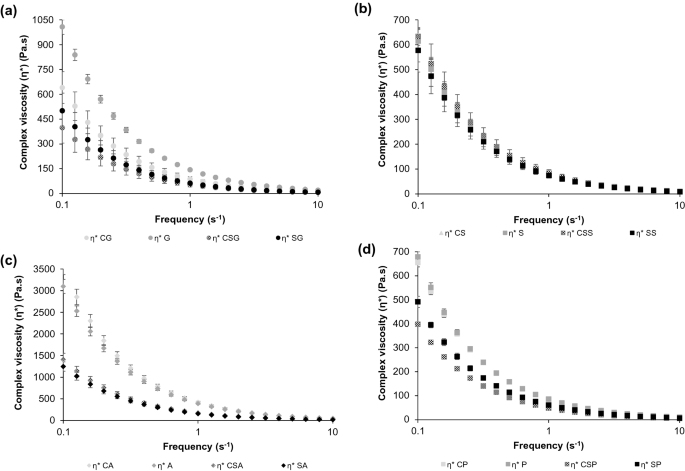
Complex viscosity (η*) of a plum jams, b strawberry jams, c apple jams, and d peach jams different formulations. Sugar plum jam (G) and its control (CG), no sugar added plum jam (SG) and its control (CSG). Sugar strawberry jam (S) and its control (CS), no sugar added strawberry jam (SS) and its control (CSS). Sugar apple jam (A) and its control (CA), no sugar added apple jam (SA) and its control (CSA). Sugar peach jam (P) and its control (CP), no sugar added peach jam (SP) and its control (CSP)
Evaluating the effect of adding sugar or sweeteners in the different jam formulation, G', G'', G*, and η* parameters showed significant differences (p < 0.05) between plum, apple, and peach jam samples; with and without sugar; and with and without microalgae addition (Table 2). This is because of the sugar and fructose syrup addition in the formulations, developing stronger gel-like behaviour, characterised by having greater SSC (Fig. 1). With apple jams, adding sugar in the formulations provoked an increase of the η* (Table 2 and Fig. 4c), suggesting that sugar had a thickening effect and increased internal cohesive forces [35]. Moreover, the gelation process during jam manufacturing is attributed to the alignment and stretching of the pectin polymer chains in sugar/fructose syrup and fruit pulp, resulting in more sites that become available for the formation of intermolecular hydrogen bonding [20]. In addition, the type of sugar affects the water availability in the pectin–sugar–pH and thus, hydrogen bonds possibly form between water and with the polymeric pectin chain, creating an interconnected three-dimensional gel network [2].
The apple jams presented higher values of G', G'', G*, and η* than the other fruit jam samples, showing no significant (p > 0.05) differences between control and microalgae biomass-extract samples, and for sugar jams and no added sugar jams (Table 2, Figs. 3c, and 4c). Therefore. although apple jams presented weak-gel characteristics, they were stronger than the other samples, having a greater ability to resist to the compression/deformation process [36,37,38,39]. This could be attributed to the higher concentration of pectin, a naturally occurring starch found in apples, showing higher complex viscosity values [33, 36]. Regarding the microalgae biomass-extract addition in the other formulations, significant differences (p < 0.05) were found between CG and G for plum jams, CSG and SG for plum jams, and CSP and SP for peach jams (Table 2). In these cases, jams containing microalgae biomass-extract in their formulations showed higher values for G', G'', G*, and η* than their corresponding control samples. This can be related to the high protein content of Spirulina, Chlorella, and Dunaliella [11] giving up a slight reinforcement of the structure [39].
Analysis of dynamic rheological data
The power law describes the rheological behaviour of the jam samples within the linear viscoelastic region because the frequency dispersions of the dynamic mechanical spectra (G′ and G″) of the jam samples are more or less straight lines with different gradients (Fig. 3) [40]. Therefore, each set of data can be fit using power law Eqs. 4 and 5 to quantitatively compare samples:
where, a is the low-frequency elastic modulus (Pa); b is the power law index for elastic modulus (dimensionless); c the is low-frequency viscous modulus (Pa); and d the is power law index for viscous modulus (dimensionless). Table 2 lists the elastic and viscous modulus power law model parameters for all the samples. Proper fitting of the model was confirmed by R2 values varying from 0.9833 to 0.9994 for the elastic power law model and, from 0.8459 to 0.9897 for the viscous power law model (Table 3).
Sugar, fructose syrup, and pectin added in the formulations seemed to have an influence on the rheological properties [28]. For apple jams, CA and A had the highest ‘a’ and ‘c’ values compare to CSA and SA, respectively. Likewise, for plum jams, CG and G compare to CSG and SG, respectively and, CP and P peach jams compare to CSP and SP peach jams, respectively, showing significant differences (p < 0.05) between sugar and no added sugar jams. Notably, sugar peach jams had more pectin content compare to no added sugar peach jams, intensifying the gelling characteristics of the fruit material [28]. Similar responses have been reported for different jams [30, 36]. However, strawberry jams showed no significant (p > 0.05) differences between sugar jams and no sugar added jams, and between the control and microalgae biomass-extract samples.
Parameters ‘a’ and ‘c’ also increased due to the microalgae biomass-extract addition in plum jam formulations for both, sugar and no added sugar jams, showing significant differences (p < 0.05). This behaviour was expected because plum jams contain the highest quantities of microalgae-extract mix in the formulations (Table 1) [42]. Likewise, microalgae biomass-extract peach jam formulations for both sugar and no added sugar jams showed significant differences (p < 0.05) between them. Apple and strawberry jams showed no significant (p > 0.05) differences between control and microalgae biomass-extract samples, for sugar jams and no added sugar jams.
Parameters ‘b’ and ‘d’, for all jam formulations, showed no clear trend considering microalgae addition and sugar or sweeteners addition. Nevertheless, these values were found as positive, further proving the weak gel-like structure of the jams [41].
Weak-gel model
Many foods, particularly fruit gels, can be considered viscoelastic gels, characterised by a three-dimensional network where weak interactions (hydrogen bonding or Van der Waals interactions) ensure the stability of the structure [7]. This approach, called a weak-gel model, was found suitable for gelled food systems like fruit jam [43] and it introduced the concept of power law relaxation modulus to describe their rheological behaviour, characterised by Eq. 6.
The three-dimensional structure characterising a gel is described in terms of ‘A’, a constant which can be interpreted as the ‘interaction strength’, and it is related to the overall stiffness or resistance to deformation (G*) within the linear viscoelastic region at an angular frequency of 1 rad/s. Furthermore, the coordination number ‘z’, which is the number of flow units interacting with each other to give the observed flow response [20]. A rheological characterisation based on ‘A’ and ‘z’ would be useful for distinguishing between fruit jams made with different formulations of microalgae biomass-extract with sugar and no sugar added in their formulations. These values are shown in Table 3. Apple jams, CA and A had higher interaction network strength values, showing significant differences (p < 0.05) between them. Similar ‘A’ values have been reported by other authors for commercial apple jams [37]. However, for CSA and SA, no significant (p > 0.05) differences between samples were found. Regarding sugar and fructose syrup as ingredients, significant differences (p < 0.05) were shown between plum, peach, and apple jams, for both sugar and no added sugar, with and without microalgae addition. In these cases, ‘A’ values for CG, G, CP, P, CA, and A were higher due to sugar, fructose syrup, and pectic added in the formulations. It has been established that the rheological properties of jam are mainly affected by added sugar, creating a complex interaction between it and other components such as pectin, strengthening the interaction of the ingredients in the network [7]. However, no significant differences (p > 0.05) were found for ‘A’ values among any type of strawberry jams. ‘A’ values were higher because of adding microalgae biomass-extract for G and SP, showing significant differences (p < 0.05) between them and their corresponding control jams, CG and CSP, respectively. This could be for the reinforcement of the structure due to the microalgae biomass-extract addition into their formulation [39].
SG and P containing microalgae biomass-extract showed ‘z’ values significantly higher than their control samples, CSG and CP, respectively, being dependent of the microalgae addition [11]. These data suggest that microalgae content prevails over the other ingredients regarding coordination number, especially for the plum jams that have a higher concentration of microalgae mix in the formulation (Table 1). However, the ‘z’ value did not show a clear behaviour considering the effect of microalgae biomass-extract addition for all the samples. The results of weak-gel model analysis suggest that the influence of the different ingredients in the food system depends not only on their concentration but also on the interactions in the gel structure [2].
Textural properties
In jam manufacturing, sugar and fructose syrup act as a dehydrating agent for the pectin molecules, permitting closer contact between the chain molecules [4]. Moreover, variation in ingredients or their concentration levels usually leads to changes in gel structure in jam often perceived by consumers through texture [5]. As Table 4 shows, incorporating them significantly increased (p < 0.05) jam firmness, consistency, cohesiveness, and index of viscosity of plum, apple, and peach jams, with and without sugar, with and without microalgae addition. However, for strawberry jams, there were only significant (p < 0.05) increases in the textural properties for samples with microalgae addition. This suggested a more stable pectin network structure formation with sugar and fructose syrup because they are more hygroscopic and hold water stronger than the sweeteners mix, suggesting a more sufficient water-binding capacity than sweeteners. Similar findings were observed by other authors [4, 30]. CG and G for plum jams, CA and A for apple jams, and CP and P for peach jams, showed higher values of consistency compared to the other jam samples, which could be sensory related to the product coverage in the mouth [30]. However, CP and CSP firmness values did not show significant (p > 0.05) differences between them.
Because of microalgae biomass-extract addition in jams formulations, significant differences (p > 0.05) were found between plum jams samples for both sugar jams and no added sugar jams, and for sugar peach jams; agreeing with the results for the viscoelastic properties. Nevertheless, strawberry and apple jams showed no significant (p > 0.05) differences between control and microalgae biomass-extract samples, for sugar jams and no added sugar jams; likewise, between CSP and SP peach jams.
Conclusions
aw, SSC, and pH values of jams have followed the regulations of sugar and no added sugar jams. The higher content of soluble solids of all the jams was for sugar jams, expected results since the conditions for the jams were previously set to give a product with that SSC. Therefore, rheological and textural parameters of sugar jams showed higher differences than no added sugar jams, due to the sugar and fructose syrup addition as ingredients and the type of fruit, reinforcing the gel-like character of the samples, as with apple jams. Parameters ‘b’ and ‘d’ for the analysis of dynamic rheological data, for all jam formulations, did not show a clear trend considering microalgae addition and sugar/sweeteners addition. Nevertheless, these values were found as positive, further proving the weak-gel structure of the jams. Moreover, rheological and textural parameters were higher because of adding microalgae biomass-extract for plum and peach jams, showing significant differences between them and their corresponding control samples. However, the coordination number did not show a clear behaviour considering the effect of microalgae biomass-extract addition for all the samples. The results for weak-gel model analysis suggest that the influence of the different ingredients in the food system depends not only on their concentration but also on the interactions in the gel structure.
Strawberry and apple jams showed no significant differences between control and microalgae biomass-extract samples, for all the studied parameters, for sugar jams and no added sugar jams. The results observed in this study suggest that the microalgae biomass-extract mix, sugar/glucose syrup; or their replacement by the sweeteners mix; and type of fruit influenced the rheological and textural properties of the jam samples. Considering colour results, colour differences were not perceptible by the human eye and the properties of sweeteners, as they did not have caloric intake compared to sugar addition, microalgae-enriched strawberry and apple jams showed the best results and fewer differences between samples.
Availability of data and material
Not applicable.
References
Loon Neoh T, Adachi S, Furuta T (2016) Introduction to food manufacturing engineering, 1st edn. Springer, Singapur
Peinado I, Rosa E, Heredia A, Andrés A (2012) Rheological characteristics of healthy sugar substituted spreadable strawberry product. J Food Eng 113:365–373. https://doi.org/10.1016/j.jfoodeng.2012.06.008
Blattný C (2004) Peaches and nectarines. Encycl Food Sci Nutr. https://doi.org/10.1016/b0-12-227055-x/00896-8
Jribi S, Ouhaibi M, Boukhris H et al (2020) Formulations of low-sugar strawberry jams: quality characterization and acute post-pandrial glycaemic response. J Food Meas Charact. https://doi.org/10.1007/s11694-020-00747-z
Basu S, Shivhare US (2010) Rheological, textural, micro-structural and sensory properties of mango jam. J Food Eng 100:357–365. https://doi.org/10.1016/j.jfoodeng.2010.04.022
Organization World Health (2018) Guideline: sugars intake for adults and children. World Heal Organ 57:1716–1722
Basu S, Shivhare US, Chakrabotry P (2017) Influence of sugar substitute in rheology of fruit gel. In: Ahmed J, Ptaszek, PBase S (eds) Advanced in food rheology and its applications. Duxford, USA, pp 355–373
Mooradian AD, Smith M, Tokuda M (2017) The role of artificial and natural sweeteners in reducing the consumption of table sugar: a narrative review. Clin Nutr ESPEN 18:1–8. https://doi.org/10.1016/j.clnesp.2017.01.004
Chakraborty R, Das A (2018) Artificial sweeteners. Elsevier
Benedek C, Bodor Z, Merrill VT et al (2020) Effect of sweeteners and storage on compositional and sensory properties of blackberry jams. Eur Food Res Technol 246:2187–2204. https://doi.org/10.1007/s00217-020-03564-2
Buono S, Langellotti AL, Martello A et al (2014) Functional ingredients from microalgae. Food Funct 5:1669–1685. https://doi.org/10.1039/c4fo00125g
Borowitzka MA (2018) Microalgae in medicine and human health: a historical perspective. Microalgae in health and disease prevention. Academic Press, Boca raton, pp 195–210
Uribe-Wandurraga ZN, Igual M, García-Segovia P, Martínez-Monzó J (2019) Effect of microalgae addition on mineral content, colour and mechanical properties of breadsticks. Food Funct 10:4685–4692. https://doi.org/10.1039/c9fo00286c
Uribe-Wandurraga ZN, Igual M, García-Segovia P, Martínez-Monzó J (2020) In vitro bioaccessibility of minerals from microalgae-enriched cookies. Food Funct 11:2186–2194. https://doi.org/10.1039/c9fo02603g
Uribe-Wandurraga ZN, Martínez-Sánchez I, Savall C et al (2020) Microalgae fortification of low-fat oil-in-water food emulsions: an evaluation of the physicochemical and rheological properties. J Food Sci Technol. https://doi.org/10.1007/s13197-020-04828-1
Gouveia L, Raymundo A, Batista AP et al (2006) Chlorella vulgaris and Haematococcus pluvialis biomass as colouring and antioxidant in food emulsions. Eur Food Res Technol 222:362–367. https://doi.org/10.1007/s00217-005-0105-z
Lafarga T (2019) Effect of microalgal biomass incorporation into foods: nutritional and sensorial attributes of the end products. Algal Res. https://doi.org/10.1016/j.algal.2019.101566
Dauthy ME (1995) Fruit specific preservation technologies. Fruit and vegetable processing, FAO AGRIC. Food and Agriculture Organization of the United Nations, Rome
Rao MA (2007) Rheology of fluid and semisolid foods: principles and applications, 2nd edn. Springer, Singapur
Basu S, Shivhare US, Singh TV, Beniwal VS (2011) Rheological, textural and spectral characteristics of sorbitol substituted mango jam. J Food Eng 105:503–512. https://doi.org/10.1016/j.jfoodeng.2011.03.014
Mohammadi-Moghaddam T, Firoozzare A, Daryadar S, Rahmani Z (2020) Black plum peel jam: physicochemical properties, sensory attributes, and antioxidant capacity. Int J Food Prop 23:1737–1747. https://doi.org/10.1080/10942912.2020.1830798
Belović M, Torbica A, Pajić-Lijaković I, Mastilović J (2017) Development of low calorie jams with increased content of natural dietary fibre made from tomato pomace. Food Chem 237:1226–1233. https://doi.org/10.1016/j.foodchem.2017.06.045
Schmidt SJ, Fontana AJ (2008) Water activity values of select food ingredients and products. In: Water activity in foods: fundamentals and applications, pp 573–591
Kopjar M, Piližota V, Tiban NN et al (2009) Strawberry jams: Influence of different pectins on colour and textural properties. Czech J Food Sci 27:20–28. https://doi.org/10.17221/95/2008-cjfs
Vilela A, Matos S, Abraão AS et al (2015) Sucrose replacement by sweeteners in strawberry, raspberry, and cherry jams: effect on the textural characteristics and sensorial profile—a chemometric approach. J Food Process 2015:1–14. https://doi.org/10.1155/2015/749740
Shinwari KJ, Rao PS (2018) Stability of bioactive compounds in fruit jam and jelly during processing and storage: a review. Trends Food Sci Technol 75:181–193. https://doi.org/10.1016/j.tifs.2018.02.002
CODEX (2009) Codex Standard 296: Standard for Jams, Jellies and Marmalades. FAO, Rome
Lopez A (2016) Jams, jellies, and related products. In: Featherstone SBT-ACC in C and RP. In: Fourteenth E (ed) A Complete course in canning and related processes, 14th edn. Woodhead Publishing, Florida, pp 313–349
Javanmard M, Endan J (2010) A survey on rheological properties of fruit jams. Int J Chem Eng Appl 1:31–37. https://doi.org/10.7763/ijcea.2010.v1.6
Igual M, García-Martínez E, del Mar Camacho M, Martínez-Navarrete N (2013) Physicochemical and sensorial properties of grapefruit jams as affected by processing. Food Bioprocess Technol 6:177–185. https://doi.org/10.1007/s11947-011-0696-2
Benlloch-Tinoco M, Igual M, Rodrigo D, Martínez-Navarrete N (2015) Superiority of microwaves over conventional heating to preserve shelf-life and quality of kiwifruit puree. Food Control 50:620–629. https://doi.org/10.1016/j.foodcont.2014.10.006
Bodart M, de Peñaranda R, Deneyer A, Flamant G (2008) Photometry and colorimetry characterisation of materials in daylighting evaluation tools. Build Environ 43:2046–2058. https://doi.org/10.1016/j.buildenv.2007.12.006
Igual M, Contreras C, Martínez-Navarrete N (2010) Non-conventional techniques to obtain grapefruit jam. Innov Food Sci Emerg Technol 11:335–341. https://doi.org/10.1016/j.jff.2013.01.019
Tan CP, Cui B, Lu YM et al (2014) Microstructure and rheology of apple jam as influenced by cross-linked acetylated starch. Stand News 66:780–787. https://doi.org/10.1002/star.201300256
Ploypetchara T, Gohtani S (2018) Effect of sugar on starch edible film properties: plasticized effect. J Food Sci Technol 55:3757–3766. https://doi.org/10.1007/s13197-018-3307-7
Liu Z, Bhandari B, Prakash S et al (2019) Linking rheology and printability of a multicomponent gel system of carrageenan-xanthan-starch in extrusion based additive manufacturing. Food Hydrocoll 87:413–424. https://doi.org/10.1016/j.foodhyd.2018.08.026
Figueroa LE, Genovese DB (2020) Structural and sensory analysis of compositionally optimized apple jellies enriched with dietary fibre compared to commercial apple jams. J Food Sci Technol 57:1661–1670. https://doi.org/10.1007/s13197-019-04199-2
Burey P, Bhandari BR, Rutgers RPG et al (2009) Confectionery gels: a review on formulation, rheological and structural aspects. Int J Food Prop 12:176–210. https://doi.org/10.1080/10942910802223404
Batista AP, Nunes MC, Raymundo A et al (2011) Microalgae biomass interaction in biopolymer gelled systems. Food Hydrocoll 25:817–825. https://doi.org/10.1016/j.foodhyd.2010.09.018
Steffe JF (1996) Viscoelasticity. Rheological methods in food process engineering, 2nd edn. Freeman Press, East Lansing, pp 294–348
Sagdic O, Toker OS, Polat B et al (2015) Bioactive and rheological properties of rose hip marmalade. J Food Sci Technol 52:6465–6474. https://doi.org/10.1007/s13197-015-1753-z
Matos J, Cardoso C, Bandarra NM, Afonso C (2017) Microalgae as healthy ingredients for functional food: a review. Food Funct 8:2672–2685. https://doi.org/10.1039/c7fo00409e
Gabriele D, De Cindio B, D’Antona P (2001) A weak gel model for foods. Rheol Acta 40:120–127. https://doi.org/10.1007/s003970000139
Acknowledgements
The authors want to thank the Ministerio de Ciencia, Innovación y Universidades, CDTI, and Fondo Europeo de Desarrollo Regional (FEDER) for their financial support throughout the ALGAVITAE project.
Funding
Open Access funding provided thanks to the CRUE-CSIC agreement with Springer Nature. Ministerio de Ciencia, Innovación y Universidades, CDTI, and Fondo Europeo de Desarrollo Regional (FEDER), ALGAVITAE project.
Author information
Authors and Affiliations
Contributions
Conceptualisation, C.S., P.G-S. and J. M-M.; methodology, Z.N.U-W., P.G.S., J.M.M.; formal analysis, M.B-V. and Z.N.U-W..; investigation, M.I., Z.N.U-W., J.M.M. and P.G-S.; resources, C.S..; data curation, M.I. and Z.N.U-W.; writing-original draft preparation and editing, M.I. and Z.N.U-W.; writing-review, P.G-S. and J. M- M; supervision, J.M-M.; project administration, P.G-S.; funding acquisition, C.S. All authors have read and agreed to the published version of the manuscript.
Corresponding author
Ethics declarations
Conflict of interest
The authors declare that they have no conflict of interest.
Additional information
Publisher's Note
Springer Nature remains neutral with regard to jurisdictional claims in published maps and institutional affiliations.
Rights and permissions
Open Access This article is licensed under a Creative Commons Attribution 4.0 International License, which permits use, sharing, adaptation, distribution and reproduction in any medium or format, as long as you give appropriate credit to the original author(s) and the source, provide a link to the Creative Commons licence, and indicate if changes were made. The images or other third party material in this article are included in the article's Creative Commons licence, unless indicated otherwise in a credit line to the material. If material is not included in the article's Creative Commons licence and your intended use is not permitted by statutory regulation or exceeds the permitted use, you will need to obtain permission directly from the copyright holder. To view a copy of this licence, visit http://creativecommons.org/licenses/by/4.0/.
About this article

Cite this article
Uribe-Wandurraga, Z.N., Bravo-Villar, M., Igual, M. et al. Sugar and no sugar added fruit microalgae-enriched jams: a study about their physicochemical, rheological, and textural properties. Eur Food Res Technol 247, 2565–2578 (2021). https://doi.org/10.1007/s00217-021-03819-6
Received:
Revised:
Accepted:
Published:
Issue Date:
DOI: https://doi.org/10.1007/s00217-021-03819-6