
Abstract
Molecular signaling through both estrogen and microRNAs are critical for breast cancer development and growth. The activity of estrogen is mediated by transcription factors, the estrogen receptors. Here we describe a method for robust characterization of estrogen-regulated microRNA profiles. The method details how to prepare cells for optimal estrogen response, directions for estrogen treatment, RNA extraction, microRNA large-scale profiling, and subsequent confirmations.
Access provided by CONRICYT – Journals CONACYT. Download protocol PDF
Key words
1 Introduction
MicroRNAs (miRNAs) play critical roles in cells due to their major impact on posttranscriptional gene regulation. In cancer, miRNAs can function as oncogenes or tumor suppressors and are therefore promising biomarkers. miRNAs are endogenously expressed 19–24 nucleotide short, single-stranded, noncoding RNAs. They are transcribed by RNA polymerase II into primary miRNA transcripts (pri-miRNA) and then processed in the nucleus by Drosha into short-hairpin precursor-miRNAs (pre-miRNA). Pre-miRNA is exported to the cytoplasm and further processed by Dicer into mature miRNA, separated into single-stranded RNA that together with Argonaute proteins form RNA-induced silencing complexes (RISC). Within the RISC complex, the miRNAs can hybridize to the 3′-untranslated region (3′-UTR) of a target mRNA, leading to posttranscriptional regulation by blocking translation or degrading the target mRNA [1].
The hormone estrogen regulates numerous physiological and pathological processes, some of its most prominent functions being within the regulation of mammary gland development and breast cancer progression. Its activity is mediated through binding to the estrogen receptors ERα (ESR1) and ERβ (ESR2). The activated ERs can bind to DNA and function as transcription factors, regulating gene expression. ERα is upregulated in the majority of breast cancers and drives their proliferation [2]. These ERα-positive tumors depend on estrogen for growth, which has made ERα a main target for breast cancer treatment. About half of ERα-positive tumors, however, eventually develop resistance to this treatment, and understanding the underlying mechanism of ERα is important to overcome resistance, improve treatment outcomes, and understand how breast cancer develops. Whereas ERα’s regulation of protein-coding genes is well established, its regulation of the noncoding miRNAs is less explored [3].
Due to the critical roles that both estrogen and miRNAs play in breast tumor development and progression, identifying miRNAs associated with normal or disrupted estrogen signaling is important. Initial studies aiming to elucidate ERα regulation of miRNA in breast cancers cell lines have yielded conflicting results, even when the same cell line was analyzed [3–6]. This may be a result of varying treatments, biological variation, the use of different techniques or the fact that the small sizes of miRNAs make them challenging to analyze. Here we describe a protocol that controls for variations and method artifacts. The main advantages of the miRNA assay approach described in this chapter is that it enables a fast screening of mature miRNAs in numerous samples, even with limited sample amounts. The lay-out, including the specific conditions for cell culture and estrogen treatment, biological and technical replicates, and large-scale screening followed by in-depth confirmations using separate techniques (Fig. 1), ensures a robust detection of miRNA regulations and reduces false positives and other artifacts. However, mutated or unknown miRNAs, or regulation at the primary and precursor transcript level, will not be detected by these methods.


An overview of the approach employed for detection of hormonal regulation of miRNA in breast cancer cells. The process begins with cell culture and treatment, Fig. 1 (continued) followed by RNA extraction and quality control, before large-scale miRNA profiling is performed to identify possibly differentially expressed miRNAs. Finally, differentially expressed miRNAs are confirmed and validated using qPCR and time-series analysis
In our study of estrogen-regulated miRNAs in breast cancer [7], we used two cells line models of the Luminal A (ERα-positive, progesterone hormone receptor (PR/PGR)-positive, Her2 (ERBB2)-negative) subtype: T47D and MCF7. Each cell line was analyzed in replicated cell cultures using different passages, each in technical replicates of treatment. This allowed for robust detection of reproducible ERα-regulated miRNAs. We compared the relative miRNA expression levels using both miRNA microarray and low-density TaqMan arrays (TLDA) and validated the results with specific quantitative real-time polymerase chain reaction (qPCR) using both SYBR Green and TaqMan chemistries (schematically illustrated in Fig. 1). miRNA regulations were then further analyzed in time-series to define their exact regulation over time, which can help differentiate random or circadian variations from estrogen-impacted regulation, as well as differentiate primary effects from secondary effects. Bioinformatical comparisons with chromatin-binding studies of ERα can further aid in the establishment of direct transcriptional regulation. Our assay resulted in a reliable assessment of miRNA regulation in which we established that while protein-coding transcripts were readily regulated by 24-h E2 treatment, mature miRNAs were not [7]. However, it is possible that miRNAs are regulated by estrogen at other time-points, as demonstrated in our time-series analysis of selected miRNAs [7], or in other cell types. The details need to be further explored and the protocol presented here provides a robust way to study hormonal regulation of mature miRNAs in breast cancer cell lines. A video demonstration of the protocol is available [8].
2 Materials
2.1 Select Cell Model
To identify which miRNAs are regulated by estrogen, selecting a well-defined model of ERα activity is a first important step. Several cell lines have been generated from human ERα-positive breast cancer tumors that are dependent on estrogen similar to the majority of clinical breast cancers. The Luminal A breast cancer subtype cell lines used in this study, T47D and MCF7 (American Type Culture Collection, ATCC), exhibit upregulated expression of nuclear receptors ERα and PR, and lack expression of membrane receptor Her2, along with expression of estrogen-responsive and luminal-epithelial differentiation genes [9–12]. Their ERα activities have been well characterized, both functionally and transcriptionally [13, 14]. Other cell lines can also be used (seeNote 1 ).
2.2 Cell Culture Media and Treatment
-
1.
T47D cell line culture media: Mix 500 mL Dulbecco’s modified Eagle’s low-glucose medium (DMEM) with 500 mL F12 [DMEM/F12 (1:1)] in an autoclaved 1 L bottle. Add 50 mL of fetal bovine serum (BSA), to yield 5 % FBS, and 10 mL of penicillin streptomycin for 1 % pen-strep. Mix contents completely. Store at 4 °C.
-
2.
Reduced-serum culture media: replace DMEM with 500 mL phenol red-free DMEM, and replace FBS with 50 mL of dextran-coated charcoal-treated (DCC) FBS for 5 % DCC-FBS, or with 5 mL DCC-FBS for 0.5 % DCC-FBS. Mix contents completely. Store at 4 °C.
-
3.
MCF7 cell line culture media: Mix 500 mL DMEM with 25 mL of the FBS (5 % FBS) and 5 mL of penicillin streptomycin (1 % pen-strep). Mix contents completely. Store at 4 °C.
-
4.
For reduced-serum culture media: replace DMEM with 500 mL phenol red-free DMEM with 5 mL of 100× l-glutamine (200 mM final concentration). Replace FBS with 25 mL of DCC-FBS (Sigma-Aldrich) for 5 % DCC-FBS, or with 2.5 mL DCC-FBS for 0.5 % DCC-FBS. Mix contents completely. Store at 4 °C.
-
5.
Phosphate-buffered saline (PBS) solution: Fill a 1 L autoclaved glass bottle with highly purified water (resistivity 18.2 MΩ). Add one PBS tablet (Medicago) and shake occasionally until tablet has dissolved. Autoclave PBS solution and store at room temperature.
-
6.
17β-estradiol (E2) stock: Prepare a 100 mM stock solution of E2 by dissolving 2.72 mg of E2 (1,3,5[10]-estratriene-3,17β-diol) in 100 μL vehicle (ethanol or DMSO) in a sterile 1.5 mL microcentrifuge tube, and mix contents gently. Centrifuge briefly and make serial dilutions (1:10) to yield 10, 1, and 0.1 mM stock concentrations using the vehicle. Store all stock solutions and solvents at −20 °C.
-
7.
ICI stock: Prepare a 100 mM stock solution of ICI by dissolving 6.07 mg of ICI 182,780 in 100 μL vehicle (ethanol or DMSO) in a sterile 1.5 mL microcentrifuge tube, and mix contents gently. Centrifuge briefly and make serial dilutions (1:10) to yield 10, 1, and 0.1 mM stock concentrations using the vehicle. Store all stock solutions and solvents at −20 °C.
-
8.
Trypsin–EDTA (0.05 %), phenol red (Life Technologies). Store stock at −20 °C. Aliquots can be prepared and stored at −20 °C. The aliquot in use should be stored at 4 °C.
-
9.
Laminar flow hood and CO2 incubator for cell culture, sterile serological and Pasteur pipets, hemocytometer or automated cell counter, rubber scrapers.
2.3 RNA Extraction, cDNA Synthesis and qPCR for mRNA Reagents
-
1.
TRIzol.
-
2.
Chloroform.
-
3.
miRNeasy Mini Kit with DNase I for DNA degradation (Qiagen) or equivalent.
-
4.
Agilent RNA 6000 Nano Assay (Agilent, Santa Clara, CA).
-
5.
RNase-free water.
-
6.
Random hexamer primers.
-
7.
Superscript III cDNA synthesis kit (Life Technologies) or equivalent.
-
8.
Gene-specific primers.
-
9.
SYBR Green PCR master mix.
-
10.
NanoDrop 1000 Spectrophotometer (Thermoscientific).
-
11.
Heat blocks, water baths, microcentrifuge, real-time PCR machine and plates.
2.4 Low-Density Array Analysis
-
1.
TaqMan miRNA RT kit (Life Technologies).
-
2.
10× Megaplex RT primers (Life Technologies).
-
3.
TaqMan 2× Universal PCR Master Mix-No AmpErase UNG (Life Technologies).
-
4.
TaqMan Low-Density Array (TLDA) plates (Life Technologies).
2.5 miRNA Confirmatory SYBR Green qPCR
-
1.
NCode miRNA First-Strand cDNA Synthesis and qRT-PCR Kit (Life Technologies).
-
2.
miRNA-specific primers.
2.6 miRNA Confirmatory TaqMan qPCR
-
1.
TaqMan MicroRNA Reverse Transcriptase Kit (Life Technologies).
-
2.
TaqMan 2× Universal PCR Master Mix-No AmpErase UNG (Life Technologies).
-
3.
20× TaqMan real-time assay primers.
3 Methods
This method details how to define estrogen-induced miRNA regulation, using estrogen-deprived culture conditions, treatment, the μParaflo-microfluidic microarray and/or the qPCR-based TLDA arrays (Fig. 1). The resulting profiles require validation and we include protocols for validation, using specific qPCR assays applying both SYBR Green-based and TaqMan-based chemistry, and time-series to identify regulation over time (seeNote 2 ).
3.1 Cell Culture and Treatment
E2 is the dominant physiological form of estrogen in females, and the concentrations and time-points for optimal transcriptional activation of ERα have been characterized in multiple studies. In this protocol we use 10 nM E2 treatment for 24 h in T47D and MCF7 cells to study a near maximal ERα activity in breast cancer cells (seeNote 3 ). In addition, time-dependent miRNA regulation can be specifically analyzed in a time interval of, for example, 1–72 h. Each ligand treatment should be performed in duplicate or triplicate plates for technical replicates. Repeat cell culture procedure and treatment using a different passage of the same cell line, and repeat the procedure with a different cell line to replicate your findings. All cell culture techniques should be performed under sterile conditions in a laminar flow hood.
-
1.
Cell culture start-up: Warm the media to 37 °C in a sterile warm water bath and thaw a frozen vial of cells. Clean the outside of vial and media bottle with 70 % ethanol, and then place both vial and bottle in sterile laminar flow hood. Add 12–15 mL of appropriate media into a labeled sterile T-75 flask using a sterile serological pipet and ensure that the surface is completely covered with media. Add the cells and mix gently. Place flask in a 37 °C incubator, supplied with 5 % CO2 and incubate for 48 h. Change the media when needed, and allow cells to grow to 80–90 % confluence before preparing cells for the experiment.
-
2.
Estrogen deprivation: Prepare cells before treatment by estrogen deprivation. In sterile hood remove media from flask using a sterile pasteur pipet connected to a vacuum. Gently wash attached cells twice with PBS. Add 1 mL of warm trypsin–EDTA to the flask, and place the flask in the incubator for 2 min for cells to detach. Add 3–4 mL of warm media to the flask and triturate the detached cells by taking up the cells in the 5 mL serological pipet and releasing the cells with the tip of the pipet placed against the bottom of the flask to increase pressure to break the cells apart into single cells. Count the cells using a hemocytometer or an automated cell counter such as the Countess Automated Cell Counter (Life Technologies), according to manufacturer’s protocol. Label 100 mm plates (as needed) and add approximately 10 mL media to each plate. Plate approximately 2.0 × 10⁶ cells per plate and distribute the cells by gently swirling the plates. Incubate cells for 24–48 h until approximately 80 % confluent (if cells are too confluent they will not respond well to E2). At 80 % confluency, wash cells twice with PBS, then add 5 % DCC-FBS media. Incubate cells for 24 h, wash again with PBS twice, add 0.5 % DCC-FBS media and incubate for additional 48 h. At this point, the cells are deprived of estrogen and the receptor largely inactive.
-
3.
Cell treatment: Prepare one 15-mL conical tube for each plate and add 1 μL of the 0.1 mM ligand stock (E2 or ICI) or of the vehicle control to 10 mL of 0.5 % DCC-FBS media, for a final concentration of 10 nM. Mix contents in tube gently. Wash the prepared cells twice with PBS, remove as much of the PBS as possible and add the prepared ligand-media mix to the cells in the plate. Incubate cells for the chosen time point (0–72 h).
3.2 RNA Extraction and Quality Control
Extract both the mRNA and miRNA populations. Before analyzing for regulated miRNA profiles, you want to ensure that the estrogen treatment was efficient. This can be ascertained by measuring the regulation of well-characterized ERα-target genes with qRT-PCR. The target genes are cell type specific, but for MCF7 and T47D cells, pS2 (trefoil factor 1, TFF1) is an appropriate control.
-
1.
Cell lysis: Wash cells twice with PBS, remove as much PBS as possible and add 1–2 mL TRIzol to each plate (seeNote 4 ). Ensure that the volume of cells is no more than 10 % of the volume of TRIzol, and that the plate is covered with TRIzol. Allow to sit for 1 min, then scrape cells using a rubber scraper and transfer to a microcentrifuge tube. Cells can be stored in TRIzol at −80 °C.
-
2.
RNA extraction: Extract and purify total RNA from each treatment using the miRNeasy Mini Kit (Qiagen) or equivalent kit including DNase I DNA degradation following the manufacturer’s “Qiazol/TRIzol-spin column protocol for animal cells” instructions (seeNote 4 ). CAUTION: TRIzol is toxic by contact with skin or eyes, by inhalation or if swallowed. Wear suitable protective clothing, gloves, and eye/face protection and use fume hood. After extraction, elute the RNA in 60 μL RNase-free water. Aliqout 1–2 μL RNA for quantification analysis and store remaining RNA at −80 °C. Measure the RNA concentrations using the NanoDrop 1000 Spectrophotometer according to manufacturer’s protocol. Use approximately 100 ng RNA of each sample to analyze the RNA integrity using the Agilent RNA 6000 Nano Assay and ensure that the RNA integrity number (RIN) is at least 8.
-
3.
cDNA synthesis: Transfer 500 ng or 1 μg of the total RNA to a new 1.5 mL microcentrifuge tube, and bring the volume to 10 μL with RNAse-free water. Add 2 μL of 50 μM random hexamer primers, heat to 70 °C for 10 min, and transfer the tubes to ice for 5 min. Make a master mix of 4 μL of 5× first strand buffer, 1 μL of 0.1 M DTT, 1 μL of 10 mM dNTPs, 0.5 μL of superscript III (from the Superscript III cDNA synthesis kit), and 1.5 μL RNase-free water, per sample, and add 8 μL of the master mix to each prepared RNA sample for a final volume of 20 μL. Place tubes at 25 °C for 10 min, followed by 46 °C for 1 h and 70 °C for 15 min (heat blocks, water bath or a PCR machine). Dilute the resulting cDNA to a 5 ng/μL stock (calculated using total RNA input) by adding water and store at −20 °C.
-
4.
qPCR for mRNA analysis: Obtain qPCR primers for genes of interest (e.g., pS2) and reference/housekeeping genes (36B4, ARHGDIA, 18S, or other). Use triplicate reactions for each sample and each gene (technical replicates) in 96-well plates. For each qPCR reaction, add 10 ng cDNA (2 μL from stock concentration from Subheading 3.2, step 3), 1 pmol of relevant forward and reverse primers, and 5 μL of 2× SYBR green PCR master mix for a final reaction volume of 10 μL. Run the reaction in a real-time PCR machine. Make sure to perform melting-curve analysis to confirm the amplification of one specific fragment.
-
5.
Analyze qPCR data using the ΔΔCT formula: ΔCT = CT (target gene) − CT (reference gene). Calculate ΔΔCT = ΔCT(treated/test sample) − ΔCT(control/calibrator sample). The calibrator sample is the vehicle-treated sample. Convert to fold-change (FC) values of each sample by: FC = 2−ΔΔCT. The fold-change value of each sample gives the relative expression of the gene in the E2-treated cells compared to in the vehicle-treated cells. Then, calculate the total standard deviation (SD) for each sample (using the STD DEV function on the CT values in excel followed by Total SD = (SD2(target) + SD2(reference))1/2). Student’s t-test can be used for statistical analysis using two-tailed distribution and two-sample unequal variance parameters, and considered significant if p < 0.05. Confirm that the treatment resulted in significant regulation, at least twofold, of known targets before proceeding with miRNA profiling.
3.3 miRNA Profiling Analysis
-
1.
miRNA microarray: Take 5 μg of isolated total RNA from cells treated with either vehicle or ligand, and place in a microcentrifuge tube. Adjust volume in tube to 20 μL. Each comparison should be performed in duplicates or triplicates. Send samples on dry ice to appropriate microarray facility if no in-house microarray facility is available. One method to measure miRNA microarray expression profiles is by μParaflo Microfluidic Biochip Technology [15]. This miRNA microarray contains 894 mature miRNAs and 50 control probes in quadruplets [7]. Perform hybridizations in duplicates in a dye-swap procedure. Results should show differentially expressed miRNAs, if any are changed (seeNote 5 ).
-
2.
qPCR-based TLDA: Each treatment should be analyzed in duplicates or triplicates. Place 700 ng of total RNA in a microcentrifuge tube for miRNA cDNA synthesis, and adjust volume in tube to 3 μL. Follow instructions from the Megaplex™ Pools protocol (Life Technologies) using the TaqMan miRNA RT kit with 10× Megaplex RT primers instead of the RT primers from the kit. Total volume for each Megaplex reaction should be 7.5 μL. Run the reaction in a thermocycler, according to the Megaplex Pools protocol. The resulting cDNA can be stored at −20 °C for at least 1 week. Place 6 μL of cDNA in a 1.5 mL microcentrifuge tube, add 450 μL of the TaqMan 2× Universal PCR Master Mix-No AmpErase UNG and 444 μL RNase-free water. Invert the tube about six times to mix contents, and centrifuge briefly. Load 100 μL into each of the eight “Fill ports” of a room-temperature 384-well TLDA plate in which primers and controls are pre-loaded (seeNote 6 ). Centrifuge the array plate and run the reactions in a real time PCR system according to the TLDA protocol. Analyze the results using the ΔΔCT formula (Subheading 3.2, step 5).
3.4 Confirmatory qPCR Analysis of Regulated miRNAs
After miRNA expression profiles are acquired as described above, it is crucial to confirm their regulation with independent methods using separate SYBR Green or TaqMan qPCR analysis (seeNote 7 ).
-
1.
For SYBR Green qPCR analysis: Perform miRNA-cDNA synthesis by placing 1 μg of total RNA in a 1.5 mL centrifuge tube, followed by polyA tailing and cDNA synthesis using the NCode miRNA First-Strand cDNA Synthesis and qRT-PCR Kit and protocol. Dilute the cDNA in a 1:10 ratio, and store at −20 °C. For each miRNA qPCR reaction well, add 16 ng of poly-A cDNA, 2 pmol of the specific forward primer (equals the sequence of the mature miRNA as obtained from mirbase.org [16], with “U” converted to “T”) and 2 pmol of the universal primer from the NCode miRNA qRT-PCR Kit, and 5 μL of 2× SYBR Green PCR master mix for a final reaction volume of 10 μL per sample. Ensure that there are triplicate wells for each sample for each miRNA (for technical replicates) and include analysis of one or two short RNA reference genes (for example U6 snRNA and a non-regulated miRNA). Run reactions and analyze as in Subheading 3.2, step 5.
-
2.
TaqMan qPCR analysis: Place 10 ng of total RNA in a 0.2 mL microcentrifuge tube and adjust volume to 5 μL. Perform the reverse transcription (RT) using the TaqMan MicroRNA Reverse Transcriptase Kit (Life Technologies) and protocol [17]. Final reaction volume should be 15 μL. After the RT reaction, dilute the sample cDNA in a 1:5 ratio, and store all cDNA in the dark at −20 °C. For each miRNA qPCR reaction use 1.3 μL of the cDNA, add 10 μL of TaqMan 2× Universal PCR Master Mix-No AmpErase UNG, 7.7 μL of RNase-free water, 1 μL of 20× TaqMan real-time assay primer (specific for each miRNA) for a final volume of 20 μL. Mix contents gently, and centrifuge briefly. Use technical triplicates and include a short RNA reference gene (for example U6 snRNA). On a 7500 Fast Real-Time PCR System or equivalent qPCR machine, assign the reporter (FAM) and quencher (NFQ-MGB) for each miRNA (target) of interest, enter reaction volume, select the comparative threshold cycle (ΔΔCt) method, and define sample wells. Follow the instructions from the TaqMan microRNA assay protocol and analyze the run as in Subheading 3.2, step 5.
4 Notes
-
1.
When analyzing other cell lines, ensure that an estrogen-responsive estrogen receptor of interest is expressed (ERα, ERβ or the membrane bound GPER1) at mRNA and protein level. If the experiment seeks to explore a receptor not expressed in the cells, it may be exogenously added (transiently or stably transfected). The receptor activity and function can be cell-type specific, but before proceeding to miRNA profiling, ensure that the receptor binds and responds to estrogen (e.g., ERE-luciferase transactivation assay or ligand-binding assay), and that characterized protein-coding target genes are regulated upon ligand treatment. In addition to E2, other endogenous, phytoestrogens or xenoestrogens, or various selective estrogen receptor modulators (SERMs) can be used.
-
2.
Because of the small size of the miRNA, the fact that the mature miRNA sequence is found also in the pri-miRNA and the pre-miRNA, and because of heterogeneity in their GC content, miRNA expression profiling is more challenging than that for protein-coding RNAs [18]. Therefore, established techniques need special adaptation, which generates different risks of introducing artifacts. For genome-wide miRNA screening, there are three common miRNA profiling platforms to choose from at this time: miRNA-specific microarrays, low-density qPCR arrays, and next-generation sequencing. An overview of the microarray and qPCR approaches is presented in Fig. 1 and the nucleic acid modifications required for these techniques are visualized in Fig. 2. Next-generation sequencing, not described in this chapter, is the only technique that allows for the discovery of novel, mutated or edited miRNAs [19]. This technique, however, requires multiple steps to enrich small RNAs, add linkers and purify the fractions to produce a small RNA library, with subsequent enhanced risks of modulating their relative expression levels between samples. Given the various techniques for miRNA profiling, the most appropriate technique depends on the applications. Microarray gives the opportunity to observe the relative expression levels of a large number of genes simultaneously, is fast and suitable for screening of large number of samples, but can only analyze the sequences present on the microarray and will, therefore, not detect changes in unknown or mutated miRNAs. Microarrays are most suitable when material is relatively abundant and the interest is to define differential expression of already known miRNAs. Low-density qPCR arrays are beneficial when a limited amount of sample is available and a high sensitivity of low-expressed miRNAs is required. Sequencing has the main advantage of detecting unknown or mutated miRNAs. All technologies can provide false negatives. The normalization process presents a challenge when analyzing the relatively few miRNA genes, which are counted in thousands compared to the tens of thousands of mRNA transcripts. For the low-density qPCR, performed in 384-well plates with no in-plate replicates, multiple plates need to be analyzed for each sample and this makes the analysis costly. Also, in our hands, more false negative results were obtained using the TLDA analysis compared to the microarray. Given that the mature miRNA sequence is present in the pri-miRNA and the pre-miRNA sequences, it is of interest to further differentiate between these transcripts using specific PCR techniques [20]. TaqMan probes are available also for pre-miRNAs, and specific primers can be designed to exclude different mature or precursor variants using SYBR Green qPCR technology.
Fig. 2 
Schematic illustration of the nucleic acid manipulations used for each miRNA detection technique. (a) A miRNA microarray has thousands of oligonucleotide probes designed to hybridize to particular miRNA sequences. The sample preparation for the μParaflo microarrays used in this study first enriches for short RNAs, followed by polyadenylation and linker ligations, before hybridization to the array probes and introducing fluorescent Cy5 and Cy3 capture-probe labeling onto the miRNAs. (b) TaqMan qPCR technology used in the TLDA technology, allows detection of transcript levels in relative amount. The miRNA template first requires conversion into cDNA, here by using a specific looped primer for each miRNA, which also ensures the analysis of only mature miRNA. This generates a cDNA template long enough to fit a miRNA-specific forward primer (complementary to the miRNA sequence), a universal reverse primer (complementary to the looped sequence), and a TaqMan probe. In this low-density setting, hundreds of miRNAs can be detected in parallel using one or two 384-well plates with individual primer pairs in each well [19]. This profiling requires less material (700 ng per sample and replicate), and allows for the detection and quantification of most known miRNAs. (c) SYBR Green technology, here used for validation of miRNA expression, includes polyadenylation of the miRNA sample, followed by cDNA synthesis with an oligo-dT primer that also harbors a universal primer sequence handle at its 5′ end, and finally, amplification including a universal primer (complementary to the primer sequence introduced through in the oligo-dT primer) and a miRNA-specific forward primer
-
3.
Culturing the cells to provide the optimal condition for hormone action is very important. The confluency of cells influences cell-cell contact and behaviors such as cell-cell signaling and proliferation, and affects the response of cells to estrogen. Cells were therefore allowed to be 80 % confluent (Fig. 3a) and well attached to avoid cell contact inhibition and allow adherent growth and cell-cell signaling, but still generate abundant RNA output. Further, as phenol red media and serum can have estrogenic activity [21, 22], this protocol utilizes phenol red-free media and DCC-treated serum (that has been stripped of most of its hormone, cytokines, and growth factors) along with serum-starvation, to ensure that all hormonal and growth factor effects have been reduced to a minimum. The time of exposure of the cells and the concentration of the hormone is also of great importance. ERa in breast cancer cells are readily activated by 1–10 nM [23], whereas higher doses would be non-physiological. Some other ligands, such as phytoestrogens or bisphenol A (BPA), would require higher concentrations to generate equivalent ERα activation at around 1 μM [23]. For estrogen-associated regulation of genes, we have previously shown that 24-h exposure produces significant response of direct target genes in breast cancer cells [7, 14]. Since miRNAs are transcribed by RNA polymerase II, like mRNAs, it is conceivable that this is a suitable time point to detect direct regulation also of miRNAs, but other time points should be explored.
Fig. 3 
Cell confluence and RNA extraction quality examples. (a) Cultured cells to illustrate the 80 % confluency recommended before treatment with ligand. (b) Graphical representation of RNA concentration and purity after extraction. Each graph represents a sample and a successful extraction process yields pure RNA (top panel). A poorly extracted RNA shows no clear absorption peak at 260 nm (bottom panel). Data are derived from NanoDrop 1000 Spectrophotometer. (Figure replicated from ref. [8] with permission)
-
4.
Extracting high-quality miRNAs requires specific considerations compared to that of longer RNAs. Because of their short sizes, miRNAs are not well retained in the total RNA preparation when regular TRIzol/chloroform/isopropanol RNA precipitations are performed, or when standard column purification kits are used. However, by increasing the volume of isopropanol, lowering the temperature before centrifugation (−80 °C) and omitting the washing in 70 % ethanol, the retaining of miRNAs can be enhanced during TRIzol/chloroform/isopropanol RNA precipitations. Or, as in this protocol, specific miRNA columns and buffers can be used. It is necessary to perform RNA extraction during RNase-free conditions and to check the quality of the RNA before proceeding with experiments. The number of cells, the extraction method, and the GC content of the miRNA can affect the yield and quality of both mRNAs and miRNAs [24]. After extraction, spectrophotometric analysis of the RNA provides information of the yield of the total RNA (containing both mRNAs and miRNAs), and provides a graphic representation of results as seen in Fig. 3b, and this allows for the observation of the purity of the sample. Poor yield of RNA would produce no specific absorption at 260 nm (Fig. 3b, bottom panel). Further, sizing quantitation analysis providing a RIN of between 8 and 10, with distinct peaks for 18S and 28S rRNA visible in the graphical representation of the RNA as exemplified in Fig. 4 (middle panel), ensures that the RNA is of sufficient quality. A degraded RNA would have a lower RIN, with less clear peaks and a reduced relative amount of the 18S and 28S rRNA (Fig. 4, bottom panel). The fraction of small RNAs can be further characterized using the Agilent Small RNA Kit. Once the quality of the RNA has been assessed, the experiment can proceed.
Fig. 4 
RNA quality control. Results from RNA integrity analysis showing graphical representation for the ladder (top), a good quality RNA (middle) and a degraded RNA sample (bottom). Data are derived from Agilent RNA 6000 NanoAssay analysis. (Figure replicated from ref. [8] with permission)
-
5.
The miRNA microarray results are usually graphically represented by heat maps, as illustrated in Fig. 5a. The red indicates miRNAs upregulated in the E2-treated sample (higher expression), while the green indicates downregulated miRNA (lower expression). miRNA selected for confirmation should be significantly regulated, usually indicated by a p-value less than 0.05 although p-value up to 0.1 can also be considered for further confirmatory analysis using qPCR.
Fig. 5 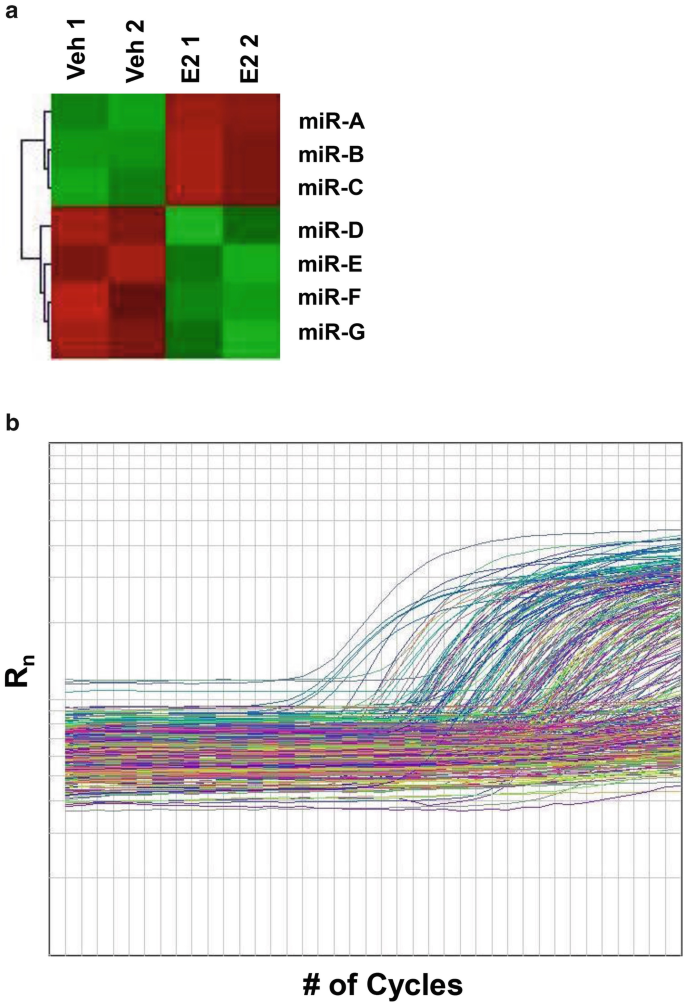
An illustration of miRNA profiling results. (a) A heat map representation of miRNA microarray results for differentially expressed miRNAs. miR-A, B, C are upregulated in the E2 treated-sample as indicated in red, while miR-D, E, F, G are downregulated as indicated in green. (b) Amplification plots for each miRNA from the TLDA results. miRNA amplification can be noted by the increase in fluorescence as indicated by the Rn value. (Figure replicated from ref. [8] with permission)
-
6.
The TLDA array uses two 384-well plates (cards) in which pool A contains better characterized and more highly expressed miRNAs than pool B. Depending on the purpose of the study, either one or both cards can be chosen. The relative level of each miRNA is determined and one miRNA is analyzed per well (Fig. 5b). A higher Ct-value indicates lesser miRNA expression. Much like the miRNA microarray, results attained from the TLDA need to be further validated to ensure accuracy.
-
7.
The miRNAs that the large-scale screening has indicated as being regulated need further validation in order to distinguish them from false positives. qPCR is a gold standard for validation of differential expression. The accuracy of the qPCR, however, depends on several parameters including RNA extraction, RNA integrity (quality), cDNA synthesis, primer design, detection method (chemistry), and the reference gene for data normalization [7, 18, 25]. The options for primer design for miRNA analysis are very limited. The short miRNA sequence length does not give room for much alternative primer design and only one primer can be harbored in this short sequence, hence, the need for alternative manipulations as illustrated in Fig. 2. The SYBR Green-based detection chemistry is different from the TaqMan chemistry used in the TLDA profiling and is suitable for confirmation purposes. It can be less specific than the TaqMan as it detects all amplified products, but performing a melting-curve analysis can assess the homogeneity of the amplicon. Figure 6a (left panel) shows the melting-curve analysis of an miRNA, in which a clearly defined uniform peak can be seen. Multiple peaks would be observed if the primer is nonspecific or if significant amounts of primer-dimer are formed (Fig. 6a, right panel). Amplification plots of each target miRNA can be observed, as exemplified in Fig. 6b. Although the TaqMan chemistry only detects the amplification of the target miRNA, the option to control for multiple amplification products using the melting-curve analysis is not available with this chemistry, and while not detected it can still occur and influence the amplification efficacy of the target. We noted that the SYBR Green and TaqMan qPCR assays could generate slightly different results for some miRNAs in our study. Further, for both qPCR assays, normalization to a reference gene is required to determine the relative expression of genes between two samples. The reference gene, also referred to as housekeeping gene, should be a gene whose expression is not changed and which is expressed at similar levels as the gene of interest and uses the same procedure for its analysis. As there is no perfect reference gene, it is recommended to use at least two different, well-validated reference genes. For miRNA analysis, there is still a debate on a well-defined reference gene. So far, the U6 snRNA is widely used for small RNA analysis. U6 snRNA is a ~110-nucleotide-long, noncoding small nuclear RNA that functions in nuclear pre-mRNA splicing [26]. As observed in Fig. 6c (bottom), U6 expression levels are about the same across all samples shown, thus allowing for calculations of the variable levels of miRNA. A graphic representation of a miRNA qPCR result for a comparison between the vehicle and E2-treated cells that has been normalized to the reference U6 can be observed in Fig. 6d. This illustrates an miRNA that was detected as non-regulated after 24 h-E2 treatment, but which harbors ER chromatin-binding sites close to its genomic location, and time-series analysis identified significant regulation 72 h after treatment. Other miRNAs, which the large-scale screening indicated as unchanged, could also be evaluated for reference gene purposes. Technical replicates are important to validate the robustness of the amplification method and the process employed. Biological replicates are required for a representation of the general biological variation, including variable response to ligand treatment, and to show that effects seen in a cell are reproducible. Based on our experience, variations in miRNA expression between cell cultures of the same cell line can occur. Usually these differences are less than 1.3-fold, and the average of values and corresponding standard deviation identifies the natural and technological variation. This variation could result from various factors including varying cell density and the fact that cell functions could change from passage to passage. To identify statistically regulation resulting from ligand treatment, a widely accepted significance is a p-value less than 0.05. Here, a student’s t-test on the biological and technical replicates using the two-tailed distribution and two-sample unequal variance parameters has been used. Other t-test parameters exist, and the choice depends on the experimental design [27].
Fig. 6 
qPCR analysis of miRNA regulations. (a) Melting-curve analysis for miRNA amplicon detection using SYBR Green, showing the emitted fluorescence (Rn) as a function of the temperature. The graph to the left shows only one amplified product, as indicated by complete homogeneity of the melting temperature of the samples. The graph to the right shows the amplification of multiple fragments as indicated by multiple melting Fig. 6 (continued) temperature peaks. (b) Amplification plots, indicated by ΔRn (Rn minus the baseline) for each amplification cycle for several samples for one miRNA. This can be either from SYBR Green or TaqMan detection methods. (c) Bar graph representation of suitable reference genes for mRNA analysis ARHGDIA (top), and for miRNA analysis snRNA U6 (bottom), illustrating no significant differences between samples when plotted against input cDNA. (d) miRNA qPCR results to illustrate comparison of relative expression levels of miR-135a over a time course of E2 treatment. Note that also vehicle-treated levels vary over time, making conclusion of (non-substantial) E2-dependent regulation challenging. Values are usually illustrated as the average of separate experiments (biological duplicates or triplicates) ± SD. Student’s t-test is used to demonstrate significance: *p < 0.05. (Figure replicated from ref. [8] with permission)


References
Bartel DP (2004) MicroRNAs: genomics, biogenesis, mechanism, and function. Cell 116:281–297
Williams C, Lin CY (2013) Oestrogen receptors in breast cancer: basic mechanisms and clinical implications. Ecancermedicalscience 7:370
Klinge CM (2012) miRNAs and estrogen action. Trends Endocrinol Metab 23:223–233
Wickramasinghe NS, Manavalan TT, Dougherty SM et al (2009) Estradiol downregulates miR-21 expression and increases miR-21 target gene expression in MCF-7 breast cancer cells. Nucleic Acids Res 37:2584–2595
Bhat-Nakshatri P, Wang G, Collins NR et al (2009) Estradiol-regulated microRNAs control estradiol response in breast cancer cells. Nucleic Acids Res 37:4850–4861
Gupta A, Caffrey E, Callagy G et al (2012) Oestrogen-dependent regulation of miRNA biogenesis: many ways to skin the cat. Biochem Soc Trans 40:752–758
Katchy A, Edvardsson K, Aydogdu E et al (2012) Estradiol-activated estrogen receptor alpha does not regulate mature microRNAs in T47D breast cancer cells. J Steroid Biochem Mol Biol 128:145–153
Katchy A, Williams C (2014) Profiling of estrogen-regulated microRNAs in breast cancer cells. J Vis Exp 84:e51285
Kao J, Salari K, Bocanegra M et al (2009) Molecular profiling of breast cancer cell lines defines relevant tumor models and provides a resource for cancer gene discovery. PLoS One 4:e6146
Lacroix M, Leclercq G (2004) Relevance of breast cancer cell lines as models for breast tumours: an update. Breast Cancer Res Treat 83:249–289
Ross DT, Perou CM (2001) A comparison of gene expression signatures from breast tumors and breast tissue derived cell lines. Dis Markers 17:99–109
Neve RM, Chin K, Fridlyand J et al (2006) A collection of breast cancer cell lines for the study of functionally distinct cancer subtypes. Cancer Cell 10:515–527
Frasor J, Danes JM, Komm B et al (2003) Profiling of estrogen up- and down-regulated gene expression in human breast cancer cells: insights into gene networks and pathways underlying estrogenic control of proliferation and cell phenotype. Endocrinology 144:4562–4574
Williams C, Edvardsson K, Lewandowski SA et al (2008) A genome-wide study of the repressive effects of estrogen receptor beta on estrogen receptor alpha signaling in breast cancer cells. Oncogene 27:1019–1032
Zhou X, Zhu Q, Eicken C et al (2012) MicroRNA profiling using microParaflo microfluidic array technology. Methods Mol Biol 822:153–182
Griffiths-Jones S, Grocock RJ, van Dongen S et al (2006) miRBase: microRNA sequences, targets and gene nomenclature. Nucleic Acids Res 34:D140–D144
Chen C, Ridzon DA, Broomer AJ et al (2005) Real-time quantification of microRNAs by stem-loop RT-PCR. Nucleic Acids Res 33:e179
Benes V, Castoldi M (2010) Expression profiling of microRNA using real-time quantitative PCR, how to use it and what is available. Methods 50:244–249
Baker M (2010) MicroRNA profiling: separating signal from noise. Nat Methods 7:687–692
Schmittgen TD, Jiang J, Liu Q et al (2004) A high-throughput method to monitor the expression of microRNA precursors. Nucleic Acids Res 32:e43
Wesierska-Gadek J, Schreiner T, Maurer M et al (2007) Phenol red in the culture medium strongly affects the susceptibility of human MCF-7 cells to roscovitine. Cell Mol Biol Lett 12:280–293
Welshons WV, Wolf MF, Murphy CS et al (1988) Estrogenic activity of phenol red. Mol Cell Endocrinol 57:169–178
Katchy A, Pinto C, Jonsson J et al (2014) Co-exposure to phytoestrogens and bisphenol A mimics estrogenic effects in an additive manner. Toxicol Sci 138:21–35
Kim YK, Yeo J, Kim B et al (2012) Short structured RNAs with low GC content are selectively lost during extraction from a small number of cells. Mol Cell 46:893–895
Setiawan AN, Lokman PM (2010) The use of reference gene selection programs to study the silvering transformation in a freshwater eel Anguilla australis: a cautionary tale. BMC Mol Biol 11:75
Yu YT, Maroney PA, Darzynkiwicz E et al (1995) U6 snRNA function in nuclear pre-mRNA splicing: a phosphorothioate interference analysis of the U6 phosphate backbone. RNA 1:46–54
Yuan JS, Reed A, Chen F et al (2006) Statistical analysis of real-time PCR data. BMC Bioinformatics 7:85
Acknowledgements
This work was supported by NIH grant CA172437 and by co-funding from Marie Curie Actions FP7-PEOPLE-2011-COFUND (GROWTH 291795) via the VINNOVA programme Mobility for Growth.
Author information
Authors and Affiliations
Corresponding author
Editor information
Editors and Affiliations
Rights and permissions
Copyright information
© 2016 Springer Science+Business Media New York
About this protocol
Cite this protocol
Katchy, A., Williams, C. (2016). Expression Profiles of Estrogen-Regulated MicroRNAs in Breast Cancer Cells. In: Eyster, K.M. (eds) Estrogen Receptors. Methods in Molecular Biology, vol 1366. Humana Press, New York, NY. https://doi.org/10.1007/978-1-4939-3127-9_30
Download citation
DOI: https://doi.org/10.1007/978-1-4939-3127-9_30
Publisher Name: Humana Press, New York, NY
Print ISBN: 978-1-4939-3126-2
Online ISBN: 978-1-4939-3127-9
eBook Packages: Springer Protocols