
Abstract
In many of the lesser developed areas of the world, regional development planning is increasingly important for meeting the needs of current and future inhabitants. Expansion of economic capability, infrastructure, and residential capacity requires significant investment, and so efforts to limit the negative effect of landslides and other natural hazards on these investments are crucial. Many of the newer approaches to identifying and mapping relative landslide susceptibility within a developing area are hindered by insufficient data in the places where it is most needed. An approach called matrix assessment was specifically designed for regional development planning where data may be limited. Its application produces a landslide-susceptibility map suitable for use with other planning data in a Geographical Information System (GIS) environment. Its development also encourages collecting basic landslide inventory data suitable for site-specific studies and for refining landslide hazard assessments in the future. This paper illustrates how matrix assessment methodology was applied to produce a landslide-susceptibility map for the Commonwealth of Dominica, an island nation in the eastern Caribbean, and how with a follow up study the relative landslide-susceptibility mapping was validated. A second Caribbean application on Jamaica demonstrates how this methodology can be applied in a more geologically complex setting. A validated approach to mapping landslide susceptibility which does not require extensive input data offers a significant benefit to planning in lesser developed parts of the world.
1 Introduction
Landslides are natural hazards that continue to take a toll in human life and economic loss worldwide. Under present day conditions, this toll is likely to grow over time (Aleotti and Chowdhury 1999; Larsen 2008). This conclusion may initially seem unduly pessimistic in light of the research for analyzing, defining, and mapping landslide hazard published during the last decade (Aleotti and Chowdhury 1999; Guzzetti et al. 1999; Clerici et al. 2002; Baum et al. 2005; Catani et al. 2005; Romeo et al. 2006; Lee et al. 2007; Thiery et al. 2007; Capparelli and Tiranti 2010; Hromadka et al. 2010). A lack of optimism in the face of noteworthy scientific and technological advances seems justified by the recognition of several important realities. First, projected global population growth over roughly the next 50 years will increase by 58 % in the less developed regions (UNDESA 2004), bringing to the regions increased development. Among the less developed regions are parts of Southeast Asia, the islands of the Caribbean and Pacific Oceans, Africa, and Central and South America, within which landslide activity has occurred and will in the future (Nadim et al. 2006). Second, the many new and improved methods seen in the literature commonly require data and resources that are not as readily available in lesser developed regions of the world as they are in Europe, North America, Australia, New Zealand, and a number of industrialized countries in Asia. The problem of data scarcity is compounded by the fact that many developing countries are hard pressed to fund efforts to improve the situation (Guinau et al. 2005). A third drawback to using some of the newer methodologies is the shortage of trained specialists to apply them and the difficulty for non-specialists in the field of statistics, like land planners, to fully understand their resulting map products (Guinau et al. 2005; Clerici et al. 2002). Thus, for many people, landslides will pose a growing threat to their personal welfare, their homes, their sources of water and energy, as well as to their means of transportation and economic livelihood.
Landslide hazard information is needed in data-scarce regions to mitigate the prevailing threat globally and to sustain current populations and their infrastructure (Larsen 2008). To be effective, landslide information needs to be incorporated into the economic and physical planning processing. Commonly, the planning process involves a broad spectrum of land and resource allocation at the regional level, a more specific planning for general design and feasibility at the local or community level, and project design and implementation planning at the site-specific or project level (De Graff and Romesburg 1980; Fell et al. 2008). Knowing the differing predisposition for future landslides within an area is crucial for decisions made at the regional development planning level.
Differentiating the propensity for landslide occurrence in an area is the very definition of landslide susceptibility (Hervás and Bobrowsky 2009). Landslide susceptibility is limited to defining the spatial likelihood of landslides. It is the static potentiality of any particular point in the landscape to respond to dynamic triggering mechanisms by yielding a landslide. Landslide-susceptibility maps are predicated on the assumptions that (1) future landslides are more likely to occur at locations where landslides occurred in the past and (2) there are static factors within the landscape, including geology and topography, which cause the landscape to respond in this manner (Fell et al. 2008; Chung and Fabbri 2003).
In this paper, we describe a methodology, called matrix assessment, for defining landslide susceptibility and describe its application to two Caribbean island nations. The methodology can produce landslide-susceptibility maps suitable for regional planning needs with a minimum of data. The methodology also uses a statistical technique that is sufficiently intuitive that it communicates results effectively to land planners. The application of the method in the context of improving use of natural hazards data, including landslides, in the regional development planning of countries with limited available data illustrates its suitability. One application includes a validation study of the landslide-susceptibility map produced. The other illustrates how the methodology can be applied in a relatively complex geologic environment. We then examine the benefits and limitations of using the matrix assessment methodology in light of the options for gaining landslide hazard information in data-scarce regions.
2 Matrix assessment: a methodology suitable for data-scarce regions
The Organization of American States (OAS 1990, 1991) undertook a project to integrate natural hazard information into regional development efforts for Central and South America and the Caribbean. For landslide hazard assessment, a methodology suitable for use in data-scarce areas was provided (De Graff et al. 1991). This methodology was termed matrix assessment in its initial publication (De Graff and Romesburg 1980). While some of the following information is presented in documents published by the Organization of American States, other important information on its application are in internal reports and documents that are not widely available. This paper draws upon all these sources to provide a comprehensive description of the methodology as applied to regional development planning through its use in two representative countries. While the data were collected between 1984 and 1999, they remain valid for use because the landslide processes operating at the time remain unchanged from those operating there today.
Matrix assessment has its origin in an effort to characterize the biological and physical components across the landscape of National Forests in the western United States (De Graff 1977; De Graff and Romesburg 1980). This effort anticipated that associated mapping and analysis would make use of Geographical Information System (GIS) technology. Landslide hazard is a concern for land management planning on these public lands where there are often areas with incomplete or generalized geologic information. While national forests are commonly rural in nature, population growth has created pressure for more roads, recreational facilities, and energy-related facilities. With this pressure came the necessary goal of managing all aspects of these rural public lands effectively, including taking measures to limit or mitigate landslide hazard. Because regional development planning in Latin America and the Caribbean share many of the same data limitations and land management concerns as National Forests, the OAS saw the matrix assessment approach as applicable to their efforts to promote incorporation of landslide hazard information into development planning (OAS 1991).
Matrix assessment is designed to maximize the likelihood that its results are not dependant on the operator executing the methodology. Scientific objectivity requires that others carrying out the same methodology with the same data should be able to replicate the same result. This is achieved largely by using a statistical method, a nonhierarchical cluster analysis in defining the relative susceptibility. This quantitative approach is beneficial in a number of ways. First and foremost, it is a robust statistical methodology that does not require assumptions of randomness for the phenomena under analysis or require other mathematical assumptions that might be difficult to satisfy in the context of landslide phenomena. Moreover, this statistical treatment of landslide and terrain data should lessen the uncertainty introduced from landslide inventory maps (Carrara et al. 1992; Ardizzone et al. 2002). This uncertainty arises from the recognition that landslide inventory maps produced by different individuals or groups, even when they have similar skills and experience levels, can yield differing results for the same area (Carrara et al. 1992; Ardizzone et al. 2002; Wills and McCrink 2002). The role for the geologist in matrix assessment is the following: (1) provide expert knowledge about landslides to determine specific environmental factors to use in the assessment, (2) ensure the best landslide inventory is used, and (3) interpret the landslide-susceptibility map results in a meaningful way to planners, engineers, and others incorporating hazard information in planning efforts. For actual reduction in landslide losses due to landslides, this third point is as important at the first two (De Graff 2012).
The statistical core for matrix assessment is a non-hierarchical cluster analysis using a k-means algorithm. Cluster analysis refers to a number of techniques used to form clusters on the basis of the distance or similarity between groups defined by a number of variables (Romesburg 1984, 2010). The point of cluster analysis is to resolve a set of landslide-related data into an intrinsic grouping (Melchiorre et al. 2008). In the case of matrix assessment, the purpose is to group the conditioning factors associated with past landslide activity within an area into three groups in relation to the proportion of past landslides associated with those factors (De Graff and Romesburg 1980). These three groups and the one for all factor groups unassociated with landslides then describe the relative susceptibility distributed over the mapped area. In comparison to some other statistical methods applied to produce landslide-susceptibility maps, such as weights of evidence, logistic regression, artificial neural networks, logistic regression, and other multivariate models, matrix assessment requires fewer variables. Consequently, the scarcity of data in a developing country is less of an impediment to producing a landslide-susceptibility maps using the matrix assessment method. This also means the cost of producing the landslide-susceptibility map is less; a not inconsequential issue in many developing countries. Matrix assessment is sufficiently intuitive that non-statistical specialists such as planners and decision-makers can readily understand information expressed by the resulting maps.
In general application, matrix assessment has five steps, as described below;
Step 1.
Define the area to which the assessment is being applied, and compile a map of landslides within the area (De Graff et al. 1991). The compilation of the landslide inventory is widely recognized as crucial to defining landslide hazard (Galli et al. 2008; van Westen et al. 2008; Fell et al. 2008). Matrix assessment cannot be undertaken for an area unless an adequate landslide inventory map is available or can be prepared. The quality of a resulting landslide-susceptibility map is strongly influenced by the quality, reliability, and completeness of the landslide inventory. An adequate landslide database in data-scare regions is rarely available. Therefore, aerial photography or satellite imagery must be interpreted to produce a landslide inventory map (Soeters and van Westen 1996; van Westen et al. 2006). This map should have adequate field checking of identified landslides to ensure its reliability and completeness for use in the matrix assessment. These efforts are sufficient to produce a basic landslide inventory map (Fell et al. 2008). It is beneficial for field checking to include collecting detailed information, such as landslide type, surface dimensions, activity state and internal morphology, for individual landslides (Wieczorek 1984; McCalpin 1984; Keaton and De Graff 1996).
Step 2.
Compile geomorphic, topographic, geologic, and hydrologic maps reflecting suitable environmental factors contributing to landslide occurrence (De Graff et al. 1991; Soeters and van Westen 1996). This reflects the widespread recognition that occurrence of future landslides is most likely related to the same environmental factors in the landscape that produced past landslides. These static factors are sometimes referred to as conditioning or preparatory factors (Hervás and Bobrowsky 2009).
In most of Southeast Asia, the islands of the Caribbean and Pacific Ocean and in Central and South America, the contributing environmental factors that are consistently available or easily obtainable are limited to bedrock lithology and slope angle classes. These two factors, among a number of environmental factors, have long been associated with landslide occurrence and assessment of landslide susceptibility (Brabb et al. 1972; De Graff 1978), and they are the minimum for carrying out a matrix assessment. Just as the landslide inventory map must be complete for the area under assessment, other factors must provide complete coverage of the area under assessment.
Below, for illustrating the methodology, the minimum environmental factors will be assumed. A map showing bedrock lithology can typically be generalized from current geologic maps; maps of slope angle classes can be derived from digital elevation models. They are the minimum environmental data needed for carrying out a matrix assessment. The area for each discrete combination of bedrock lithology and slope angle class is computed from this mapped data (Fig. 1).

Diagram illustrating the matrix assessment approach using two terrain factors bedrock type, divided into five classes A–E, and slope angle, divided into five classes M–Q. The third “other” factor divided into classes X–Z is shown to represent how additional factors may be used. Representative bedrock and slope combination (1) Bedrock C-Slope M and (2) Bedrock E-Slope Q are typical mapping units. When the area for each representative combination from the landslide inventory shown in the landslide matrix (A) is divided by the area present within the study area shown in the factor matrix (B), it yields proportional values shown in the landslide-susceptibility matrix (C). Those proportions are grouped using k-means cluster analysis (D). Landslide susceptibility map polygons (E) where bedrock and slope combination 1 is present are designated as extreme and those polygons with bedrock and slope combination 2 are designated as moderate
Step 3.
Compute the area of landslides within each discrete combination of bedrock lithology and slope angle class (De Graff et al. 1991). There will likely be many bedrock lithology and slope angle classes for which no landslide area exists. These combinations are assigned a value of “0” denoting their absence of existing landslides (Fig. 1). Where landslides are present for a particular combination of bedrock and slope angle, the total area of mapped landslides computed for their combination is divided by the total area of that combination within the study area. The result is a proportional value (p i ) greater than 0 and up to 1.0 (1.0 means that the entire area of a given combination is mapped as landslides). This is done for every combination of bedrock and slope angle where landslides have occurred (Fig. 1). Converting the area data into proportional values effectively normalizes the area data, with the higher proportional values representing the combinations with greater landslide susceptibility and the lower values representing a lesser susceptibility.
Step 4.
Determine three of four classes of relative landslide susceptibility—moderate, high, and extreme. The fourth class—low susceptibility—is defined by all the combinations assigned a value of “0.” At this point, the importance of having a complete landslide inventory for the assessed area should be evident. If the landslide inventory used were incomplete, it is likely some of the combinations assigned a “0” value would be misclassified as having low landslide susceptibility. In actuality, their susceptibility is unknown.
For the combinations with values greater than “0,” a k-means cluster analysis is performed on the n values of p i , using a k-means clustering program in one of the widely available software packages, such as SPSS, SAS, CLUSTAN, and STATISTICA. This is done by entering the n values of pi into the program and instructing it to group them in k = 3 clusters. The program’s algorithm starts by randomly assigning each pi value to one or another of three trial clusters, labeled 1, 2, and 3. For each trial cluster, the program computes the mean of the pi values in it, and computes the sum-of-squares of the p i values about the mean, labeled S1, S2, and S3, and sums the three to get ΣS, the value of the total sum of squares. From this starting point, the program produces a succession of trial clusters using an iterative algorithm of intelligent trial and error. This reduces the value of ΣS at each stage of the iterative process until the algorithm is unable to find a set of three trial cluster that can reduce it further. The three clusters of p i values at this point establish the final clusters that determine the three classes of relative landslide susceptibility (Fig. 1).
Step 5.
Produce the landslide-susceptibility map by aggregating the bedrock and slope angle combinations defining the various groups into their respective susceptibility class (De Graff et al. 1991). This transformation is readily accomplished through GIS technology. There are commonly bedrock and slope angle classes that have no landslides associated with them; these combinations define the low susceptibility class. Among the three clusters defined by the nonhierarchical cluster analysis, the bedrock and slope angle combinations found in the cluster with the smallest nonzero proportions define the moderate susceptibility class. The combinations in the intermediate cluster of proportions define the high susceptibility class. The combinations with the highest proportions define the extreme susceptibility class. With each discrete bedrock and slope angle combination redefined by its susceptibility class, the map is redefined by polygons reflecting these classes (Fig. 1).
The resulting map displays four landslide susceptibility classes: low, moderate, high, and extreme (De Graff et al. 1991). The choice of four susceptibility classes is not totally arbitrary; it reflects a matter of the expected perception of potential users of the map (De Graff and Romesburg 1980). This is an important point for future implementation because the maps are expected to communicate this information to planners, managers, and other nontechnical users (Highland and Bobrowsky 2008). Social psychology has demonstrated the desirability of using terms that indicate the direction and distance between opposing poles (Osgood et al. 1957). In this case, the opposing poles of low and extreme susceptibility have moderate and high susceptibilities being intermediate between them. The k-means cluster analysis could define more than three classes but this seeming refinement of relative susceptibility may or may not be meaningful to the ultimate users of the final map product.
On the map, low susceptibility is represented by all the bedrock and slope class combinations for which no landslide area was present. Moderate, high, and extreme susceptibility are defined by the respective bedrock lithology and slope angle combinations for the three groups of proportions defined by the nonhierarchical cluster analysis. This is a rank scale representing a quantitative measure of relative landslide susceptibility. It is worth noting that the data used to define the different levels of landslide susceptibility are easily related to the underlying factors used in the matrix assessment. Consequently, it is relatively simple to examine what factor combinations are associated with the greatest landslide susceptibility and then develop testable hypotheses for why this might be. In this manner, matrix assessment serves as a starting point for more detailed studies for the community and site-specific planning.
3 Validation of a landslide-susceptibility map for Dominica, West Indies
3.1 Developing the landslide-susceptibility map
One of the first landslide-susceptibility maps produced for the OAS Caribbean Disaster Mitigation Project using the matrix assessment approach was for the Commonwealth of Dominica in the eastern Caribbean (De Graff 1987). Dominica is a 754-km2 island nation at the north end of the Windward Islands (Fig. 2). It owes its origin to volcanic activity from the Miocene through the Pleistocene from nine volcanic centers forming a central ridge (Roobol and Smith 2004). The higher points on Dominica are located along this north–south ridge, with Morne Diablotins highest at 1,447 m above sea level (Commonwealth of Dominica, 2001). The island is 47 km in length along its roughly north–south axis and 29 km at its widest point. The dramatic increase in elevation over the short distance from the shoreline to the central peaks of the island produces widespread steep slopes. More than 60 % of the slopes on the island are steeper than 30 % gradient (World Bank 2004).

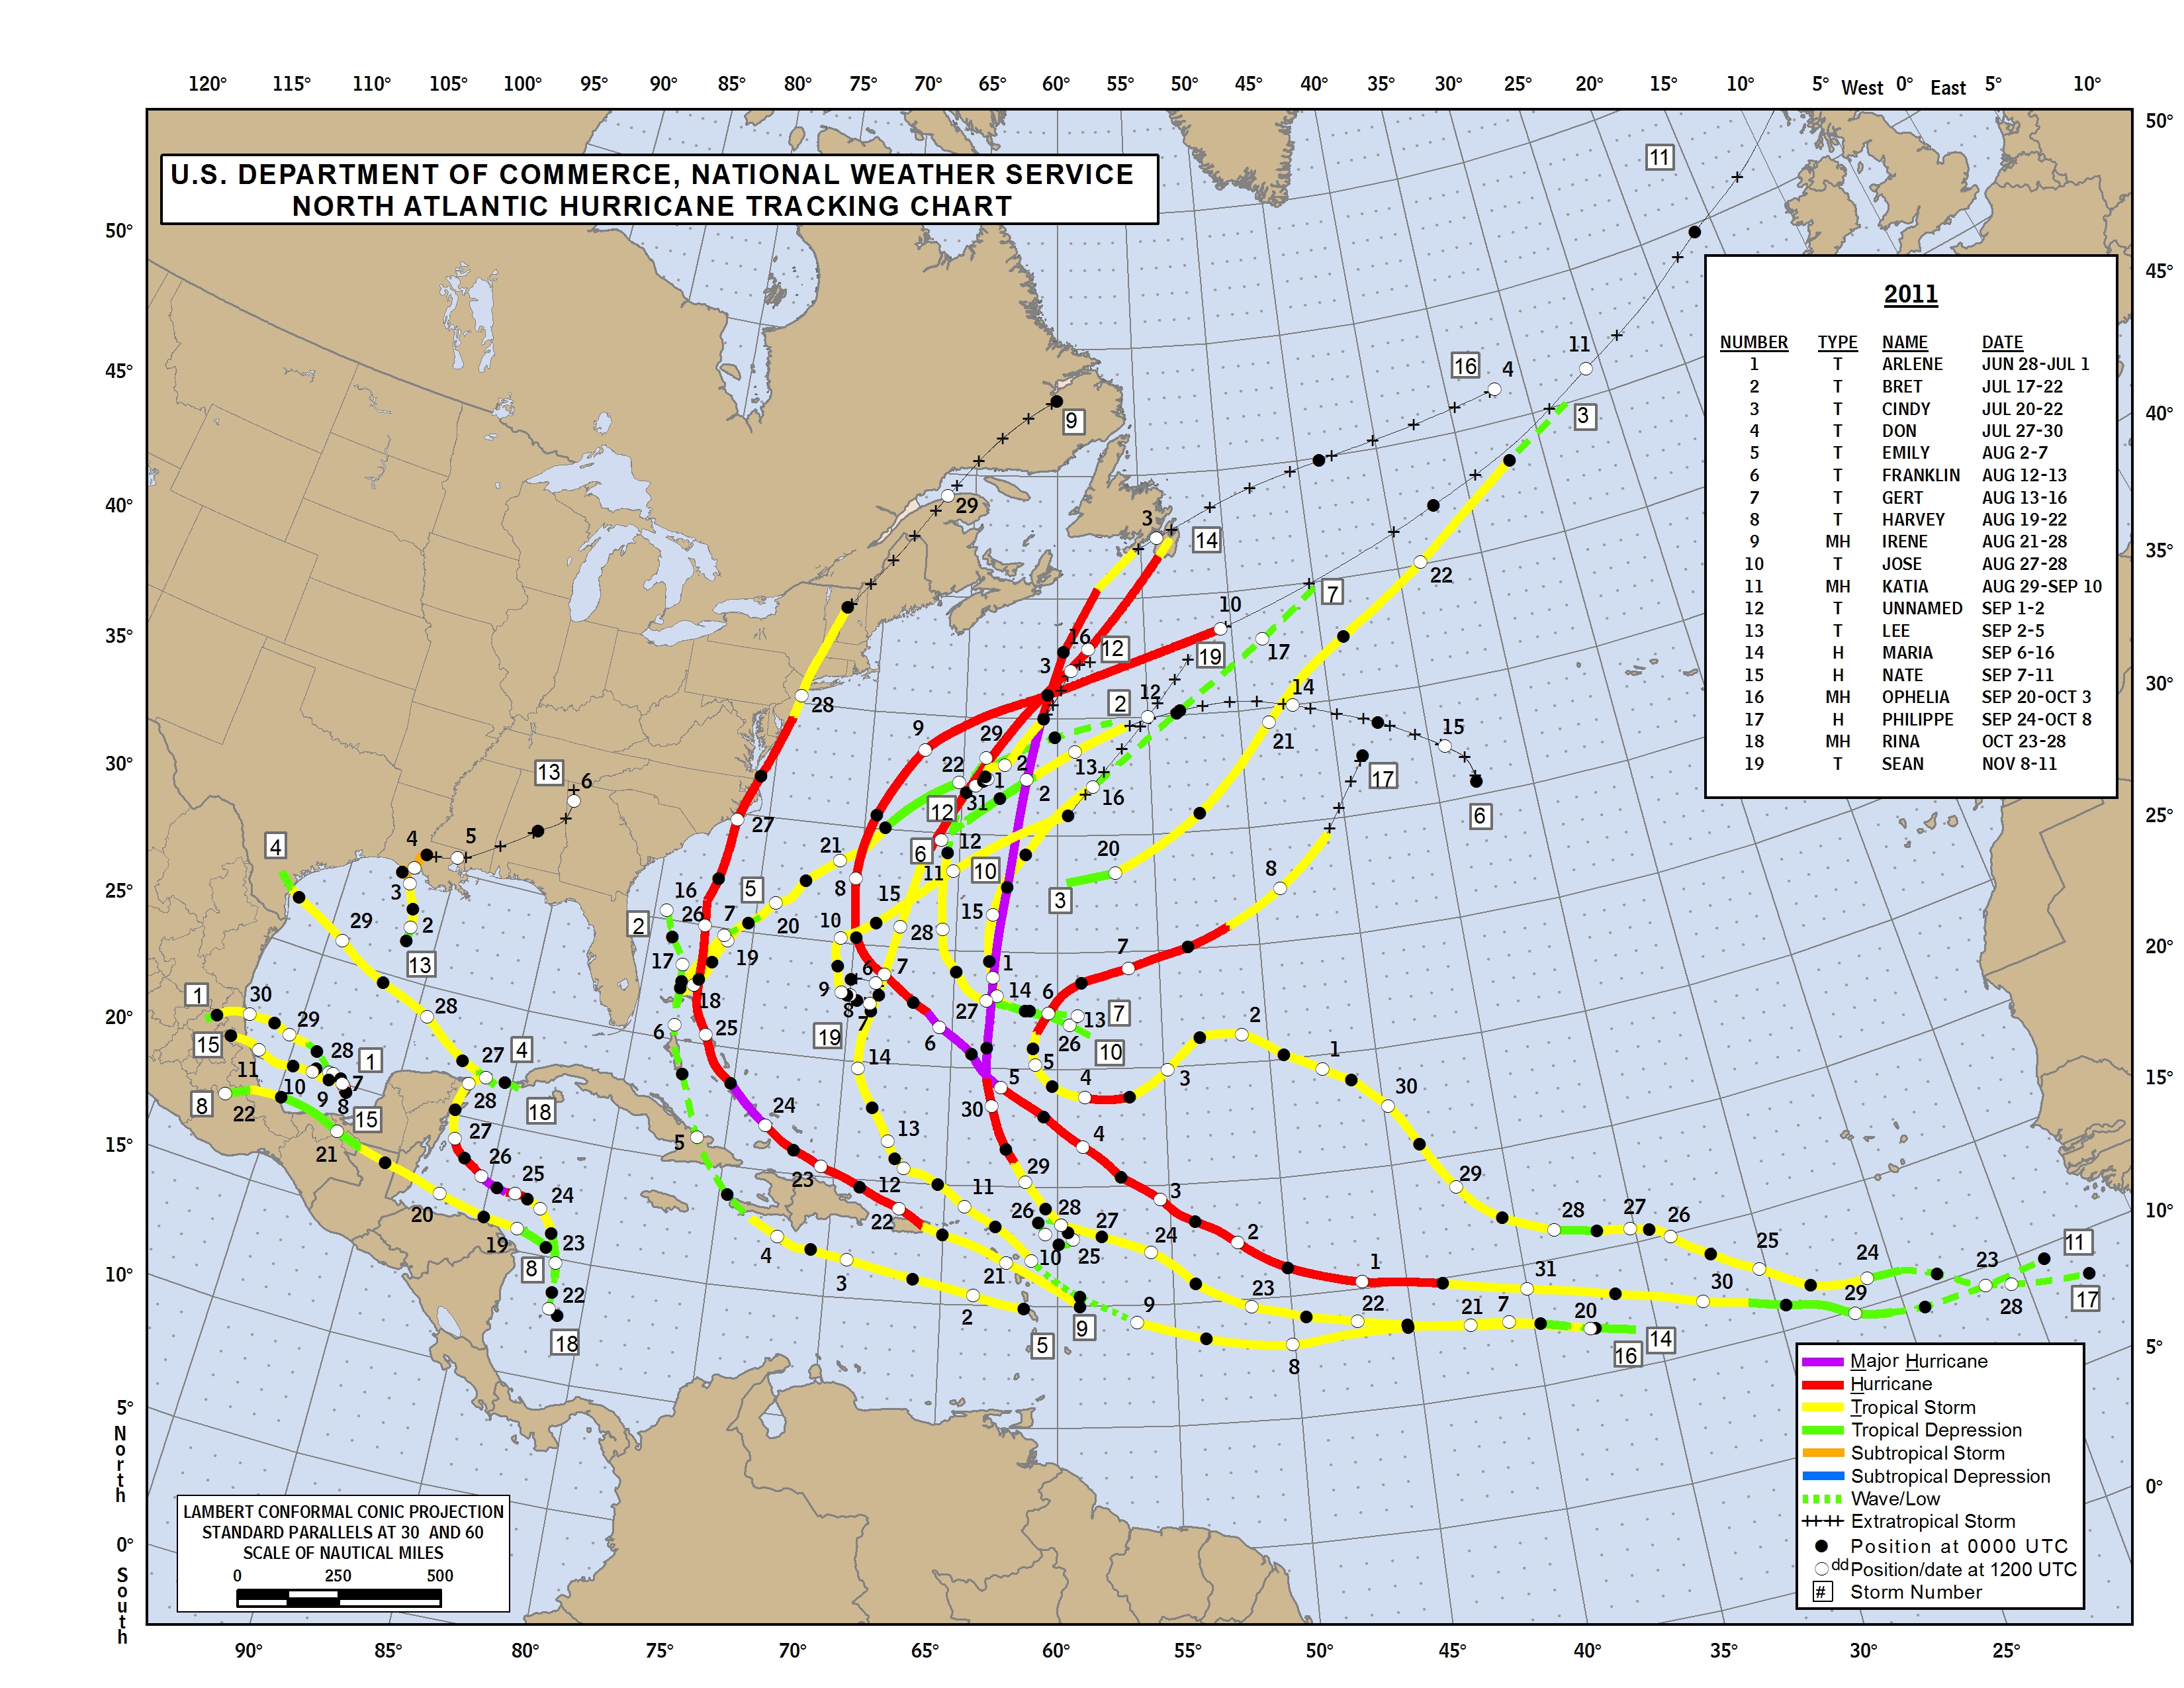
Map of the Caribbean Sea showing hurricane tracks in 2011 (colored lines) in relation to Jamaica and Dominica. Purple, major hurricane; red, hurricane; yellow, tropical storm; green, tropical depression. Numbers in white boxes identify named hurricanes; black numbers along tracks are dates. Jamaica and Dominica were spared hurricane-induced landslides in 2011 because most hurricanes tracked to the north. Source: http://www.nhc.noaa.gov/tracks/2011atl.jpg
Dominica is part of the Caribbean where hurricanes and tropical storms are likely between June and November each year. In the recent past, the tracks of these storms have passed directly over the island or very nearby (Fig. 2; Commonwealth of Dominica 2001). In addition to these major storms, the interior highlands receive abundant rainfall due to orographic uplift. As a consequence, more than 80 % of the island receives at least 2,500 mm of rainfall per year, with the central peaks receiving up to 7,500 mm per year (World Bank 2004).
With an island landscape of steep slopes underlain by predominantly clay-rich soils and volcanic bedrock, it is hardly surprising that the abundant rainfall, especially during intense storms, can result in landslide occurrence (De Graff et al. 1989, 2010). Dominica is notable for the number of landslide fatalities and injuries sustained in recent time (De Graff et al. 1989).
Based on this history, the OAS initiated an effort to produce a landslide-susceptibility map for use by the Commonwealth’s Central Planning Unit. A landslide inventory was completed in January 1987 (De Graff 1987). Landslides were initially identified by interpretation of high-quality 1:20,000-scale monochromatic, vertical aerial photographs taken in 1984. The inventory mapping was done by a geologist experienced in aerial photo-interpretation involving mapping of landslides. Ground verification of this initial landslide inventory mapping took place over several weeks with traverses along all major and some feeder roads across the island. Due to a significant area that lacked roads, trails were traversed to provide field access to those areas. All identified landslides were delineated on 1:25,000-scale topographic maps. In addition to ground verifying the landslides identified through aerial photo-interpretation, field efforts also enabled identification of landslides that had occurred in the three years after the aerial photographs were taken. Only features recognized by their physical characteristics as either being certain or probable landslides were included in the final inventory (Keaton and De Graff 1996). A total of 980 individual landslides averaging 4.0 hectares in size were mapped by this landslide inventory. The average landslide density of Dominica based on this effort was 1.2 landslides per km2 representing landslide disturbance to approximately 2 % of the island (De Graff et al. 1989). Shallow debris flows and slides derived from hill slope regolith and colluvium were the predominant landslide types (Fig. 3). Consequently, the assessment was essentially determining susceptibility to these landslide types.

A recent debris slide in Dominica, located within the protected Forest Reserve lands in the headwaters of the east-flowing Rosalie River. This typical landslide is visible from a vantage point near in the headwaters of the Roseau River south of Morne Trois Pitons
A slope map was prepared for the island using four slope steepness classes: less than 12.5, 12.5–25, 25–50, and greater than 50 %. This slope steepness map was overlain with the bedrock map (1:50,000 scale) to develop the combined bedrock and slope steepness units, and their respective computed area. So, this application of matrix assessment was limited to two factors, which was a consequence of the limited suitable data obtainable at that time. The landslide inventory map was compared to this map of combined bedrock and slope steepness, and the total area of landslide present in each combination was computed. This analysis also identified all bedrock and slope steepness combinations for which no landslides had been identified.
When this work was undertaken, k-means cluster analysis in statistical analysis packages such as SPSS was not widely available. Instead, the process described in De Graff et al. (1991) was applied to the proportional values p i to define the zones of relative landslide susceptibility. The process employs a sum-of-squares measure for clustering akin to the k-means cluster analysis described earlier. By essentially redefining each bedrock and slope steepness class in terms of its relative landslide susceptibility, a map showing susceptibility units was produced and provided to the Commonwealth of Dominica’s Central Planning Unit (De Graff 1987; Fig. 4). Due to the lack of GIS capacity at the time the map was being produced, the entire process was done with physical map overlays to develop the final landslide-susceptibility map. This map was later digitized to facilitate its use in analyses performed in a GIS environment. This allowed the relative landslide susceptibility of areas to be one of the factors considered during planning for housing development, road and utility corridors, and other development projects.

The landslide susceptibility map produced for the Central Planning Unit of the Commonwealth of Dominica, W.I. using the matrix assessment approach in 1987. The four polygons classified as having extreme landslide-susceptibility are located within the southwest quadrant of the island. The landslide forming the Matthieu landslide-dam in 1997 (De Graff et al. 2010) took place at the boundary between polygons designated as having moderate and high landslide susceptibility
3.2 Validating the landslide-susceptibility map
In 2006, Guzzetti et al. published their examination of major international journals covering the period from 2000 to 2005. They found at least 40 papers discussing landslide susceptibility, with the majority presenting a statistically based susceptibility model. They concluded that these papers provided little or no information on the quality of the proposed model and contend that any attempt to determine landslide susceptibility for a particular area requires validation. There are two commonly employed ways for validating a landslide susceptibility model or method: use the same landslide data used to develop the landslide susceptibility, or use an independent set of landslide data collected from a later event or set of events (Guzzetti et al. 2006). The latter allows for determining the validity of the landslide-susceptibility map to forecast the location of new or reactivated landslides. This latter approach to validation was applied to the landslide-susceptibility map for Dominica.
Every year, Dominica experiences a number of intense storms that may or may not be named storms, and in May 1990, the OAS initiated a validation study of the 1987 landslide-susceptibility map because a number of significant storms had affected Dominica during the rainy seasons of 1987, 1988, and 1989. Among the named storms that had some effect on Dominica during this period were Hurricane Emily (Sept 1987), Tropical Storm Chris (Aug 1988), Hurricane Gilbert (Sept 1988), and Hurricane Hugo (Sept 1989) (Case and Gerrish 1988; Lawrence and Gross 1989; Case and Mayfield 1990).
Because no new aerial photography was available for inventorying the post-January 1987 landslides, new or reactivated landslides were mapped based on 2 weeks of field work by the same geologist who carried out the original inventory. All major roads and many feeder roads were traversed. Access included some feeder roads constructed since the 1987 landslide survey. Trails were again traversed. Post-1987 landslides were identified based on having a “fresh” appearance reflected in clearly visible landslide morphology and exposed bare ground or recent re-vegetation in the scar. The contrast between the brown, exposed soil visible in landslide features compared to the green, undisturbed vegetation adjacent to it contributed to the certainty of recent occurrence (De Graff 1990) (Fig. 3).
A total of 152 new or reactivated landslides were identified during this 1990 field investigation, and an additional 31 landslides along major roads were found. Many of these landslides were associated with the passage of Hurricane Hugo. Only the 152 landslides occurring outside the influence of roads were used in the validation. The landslide susceptibilities associated with them were 65 landslides in areas designated as high susceptibility, 84 landslides in areas designated as moderate susceptibility, and 3 landslides in areas designated as low susceptibility. None were in areas designated as having extreme landslide susceptibility. In the areas designated as low susceptibility, the incidence of landslides was 1 per 3,467 hectares; in the areas of moderate susceptibility, 1 per 609 hectares; and in the areas of high susceptibility, 1 per 206 hectares. The increasingly greater incidence rates with increasing landslide susceptibility suggest that the designations were reliably determined.
A second test was performed to ensure that the distribution of new and reactivated landslides is not simply proportional to the area of the different landslide susceptibility category. A goodness-of-fit test was performed to evaluate the hypothesis that the number of landslides per each designated landslide susceptibility class is proportional to the area of the category. For this, a computerized analysis called CHITEST (Romesburg and Marchall 1985) was employed that uses Monte-Carlo methods to test the null hypothesis that the row and column factors of an r-by-k contingency table are independent and has the advantage of being valid even when expected frequencies are small. The analysis showed the hypothesis was rejected at a p < 0.0001.
Identification of areas with differing landslide susceptibility on Dominica was based on factors influencing the physical process by which landslides occur. The increasing incidence of landslides with progressively higher susceptibility categories indicates that the map produced using this methodology reliably identifies areas with differing susceptibility. The statistical test assures us that the results are unlikely due to chance but is most probably from factors known to control the physical process of landslides occurrence. Thus, the validity of the matrix assessment approach is demonstrated for producing a map of relative landslide susceptibility that forecasts the location of new or reactivated landslides.
4 Kingston, Jamaica: an application of matrix assessment to a geologically complex area
4.1 Geologic setting of Jamaica and the Kingston Metropolitan area
As an outgrowth of the OAS effort to include natural hazard information in regional development planning, the Caribbean Disaster Mitigation Project (CDMP) was initiated in 1993 with support from the US Agency for International Development’s Office of Foreign Disaster Assistance. One element incorporated into this multi-hazard project was preparation of landslide-susceptibility maps for the Kingston Metropolitan area (KMA) using the matrix assessment approach.
Jamaica is a 10,991-km2 island nation located in the Caribbean south of Cuba and west of the island of Hispaniola (Ahmad et al. 1999) (Fig. 2). The island lies within a 200-km wide, seismically active zone of Neogene left-lateral strike-slip deformation that reflects the boundary between the Caribbean and North American plates (Mann et al. 2007). Two especially important earthquakes that have affected Jamaica are as follows: the earthquake of 1692, which had devastating effects within the area of modern-day Kingston, and the 1907 Kingston earthquake, which was a 6.5 magnitude event. The present-day topography on the island has largely resulted from crustal movements during Quaternary (Mann et al. 2007). The highly fractured and deeply weathered and altered bedrock and neotectonics control the landforms and geomorphic processes to a remarkable extent.
Jamaica is within the northwest trade winds belt and has a subtropical climate with distinct rainy and dry seasons. It is located in the track of North Atlantic hurricanes passing through the Caribbean (Fig. 2). In 1988, Jamaica was subjected to a direct hit as Hurricane Gilbert passed along the length of the island. Other recent hurricanes that have caused major damage to Jamaica include Hurricanes Charley (2004), Ivan (2004), Dennis (2005), and Dean (2007) (Ahmad 2008).
Kingston, Jamaica’s capital, is on its southern coast, located on the Holocene gravel fan of Liguanea at the base of a faulted mountain front (Ahmad et al. 1999). Bordering the fan is a ring of low hills of Tertiary limestones (Long Mountain, Dallas Mountain, and Stony Hill). Overlooking these hills are the Port Royal Mountains of St. Andrew Parish composed of Cretaceous to Paleogene rocks of the Wagwater Belt. According to Mann and Burke (1990), the Wagwater Belt of eastern Jamaica formed as a transverse intra-arc rift and it appears that the uplift and doming of the sediments in the trough is a consequence of compression at a right-stepping bend on the thoroughgoing, left-lateral Enriquillo-Plantain Garden-Swan fault system that forms the southern part of the plate boundary zone. Consequently, modern Kingston Metropolitan Area (KMA) is spread over a mosaic of coastal plains, reclaimed land, gravel fans, and steep slopes totaling some 554 km2 (Ahmad et al. 1999).
The Kingston Metropolitan Area has a long history of landslide occurrence. Both earthquake shaking and intense rainfall have served as triggers for landslide activity (Fig. 5). Notably, landslides are associated with the historic Port Royal earthquake of 1692 (Ahmad et al. 1999). More recently, the M5.4 earthquake of 13th January 1993 triggered landslides which, according to records, caused more damage than the other earthquake effects (Ahmad 1996). Intense rainfall, often associated with hurricane and tropical storms, is a common landslide trigger. For example, precipitation associated with hurricane Mitch in November 1998 caused widespread debris flows in the Kingston area.

A private home built in southeast St. Andrew, Jamaica is severely damaged by a rainfall-triggered landslide. Differential movement on parts of the landslide has produced cracking in the foundation and adjacent structural elements. The underlying bedrock in this area consists of shale and mudstone of the Lower Eocene Richmond Formation, which was shown by Ahmad and McCalpin (1999) to be susceptible to deep landsliding
4.2 Preparation of landslide-susceptibility maps
In 1989, the Caribbean Disaster Mitigation project sponsored a specialized training course at the University of the West Indies to initiate development of a landslide-susceptibility map for the Kingston Metropolitan Areas. Afterward, landslide inventory mapping and related studies of landslide processes were carried out by faculty and students at the University of the West Indies (Mona Campus). This primary information was used by GEO-HAZ Consulting, Inc., with other data to produce the landslide-susceptibility maps and associated information for their use in landslide hazard reduction efforts (Ahmad and McCalpin 1999, Ahmad et al. 1999).
Field investigations and the compilation of landslide inventory map followed the procedures outlined in Turner and Schuster (1996). The process involved a number of steps, beginning with stereoscopic interpretation of vertical, monochromatic aerial photographs (Soeters and van Westen 1996). Both the 1961 series at a scale of 1:50,000 and the 1991–1992 series at a scale or 1:15,000, obtainable from the Survey Department of the Government of Jamaica, were used (Ahmad and McCalpin 1999). Identified features from aerial photos and anomalous topographic features indicative of landslide landforms were noted on topographic maps, scale of 1:50,000, prepared by the Jamaica Survey Department. Landslide inventory mapping was carried out by students and faculty at the University of West Indies, Mona Campus (e.g., Maharaj 1993). Landslide data from previous investigations including information provided by the Jamaican Geologic Survey Division were compiled. All of this information was assembled and digitized to serve as the landslide inventory map for the Kingston Metropolitan Area (Turner and McGuffey 1996; Keaton and De Graff 1996). The landslide inventory contains 2,321 landslides and landslide features such as scarps. Eighty-five percent of the landslides are classified as definite or probable. The remaining mapped features are classified as questionable (Wieczorek 1984; Keaton and De Graff 1996). Landslides were found to cover nearly 20 km2, or 3.6 % of the studied area. Within the mountainous areas, landslides cover 4.8 % area (Ahmad and McCalpin 1999).
To apply the matrix assessment approach, a number of maps representing physical factors influencing landslide occurrence were rasterized to 15 m cell size for use in a GIS environment (Ahmad and McCalpin 1999). These factors included the bedrock lithology, slope angle (steepness), and slope aspect (orientation) as described in De Graff and Romesburg (1980) and De Graff et al. (1991). Additional factors selected for mapping included down slope curvature, distance to faults, and distance to roads. Bedrock lithologies were simplified from the provisional editions of 1:50,000-scale geologic sheets of the Blue Mountains and Kingston sheets (Rammealeare et al. 1994a, b). Slope angle, slope aspect, and down slope curvature were based on a digital elevation model (DEM) created from 50-m contours on the published 1:50,000-scale metric base maps. Locations of faults and roads were derived from published maps.
Due to the geologic complexity and multiple landslide triggering mechanisms of the Kingston Metropolitan Area, it was decided to prepare two landslide-susceptibility maps for two distinct landslide groups: deep-seated landslides commonly involving movement within bedrock, and shallow landslides typically involving surficial materials (Ahmad and McCalpin 1999). Some researchers favor preparing landslide-susceptibility maps for different landslide types when using a statistical methodology, like matrix assessment, on an area with a variety of landslide types (van Westen et al. 2006). Matrix assessment was applied using the respective factors to produce the two landslide-susceptibility maps for the Kingston Metropolitan Area (Ahmad and McCalpin 1999). Deep-seated landslides were found to be most sensitive to four factors: bedrock lithology, distance to faults, slope angle, and slope aspect (Fig. 6a). For the shallow landslides, the four most sensitive factors were bedrock lithology, slope angle, down slope curvature, and slope aspect (Fig. 6b).

Landslide susceptibility maps produced by GEO-HAZ Consulting for the Greater Kingston Metropolitan Area in 1999. (A) Susceptibility classes for deep landsliding. The red linear bands of high susceptibility are caused by mapped bedrock faults cutting through bedrock formations of generally moderate susceptibility. (B) Susceptibility classes for shallow landsliding. The pattern appears very different from that in part A, because shallow landslides are relatively insensitive to bedrock faults, but are controlled more by topographic factors
5 Discussion
Organizations undertaking regional development initiatives in data-scarce regions face difficult choices on how to address potential landslide hazard. These choices range from: (1) essentially ignoring landslide hazard at the regional planning level and expecting that site-specific studies will be sufficient later, (2) using a sophisticated landslide hazard methodology requiring more data than is locally available, and then substituting generalized values or extrapolating ones from outside areas. At either end of this spectrum, there is a significant likelihood that hazard will be miscalculated, a result that could adversely impact a completed project or make project implementation costs prohibitive. The potential financial loss due to landslide impacts or design and implementation changes to address unanticipated landslide issues is not compatible with sustainable development in a world with limited investment funds. A choice better matched with sustainable development is to utilize a methodology that may lack the ability to fully define hazard but that requires only data available within the planning area. We would propose that matrix assessment is a methodology that can adequately supply the landslide hazard information needed for regional planning in such data-scarce regions.
The matrix assessment approach produces a landslide-susceptibility map for the area under study. Van Westen et al. (2003) point out that mapping the landslide hazard across an area involves two different aspects. One is assessing the varying degree of the susceptibility within the terrain to the likelihood of landslide occurrence. The second aspect is determining the probability that a triggering event will happen and relating it to landslide occurrence. Matrix assessment addresses the first aspect that some researchers recognize as representing a spatial probability of landslide occurrence (van Westen et al. 2006). This can be an adequate substitute for landslide hazard in the absence of sufficient data to define a temporal probability.
Matrix assessment affords a distinct advantage for many areas worldwide where data commonly used in other landslide-susceptibility methodologies may be absent or incomplete. The typical conditioning factors used are selected for their influence on the processes resulting in landslides. For example, bedrock lithology represents the inherent strength of the earth material that may move, and slope angle represents the effectiveness of gravity to promote that movement. It has been suggested that indirect methods for determining landslide susceptibility, such as matrix assessment, suffer from a tendency to oversimplify the factors that influence the occurrence of landslides (van Westen et al. 2003; Greco et al. 2007). For many parts of the world including those addressed by the OAS’s hazard guidance (OAS 1990), simplification of factors utilized by the methodology is more of an advantage than a disadvantage. Consequently, it is not viewed as a significant concern for matrix assessment in the context of producing first-generation landslide-susceptibility maps in parts of the world where data are unavailable or incomplete. Besides, matrix assessment is capable of using more factors where they are available, as has been illustrated by the Kingston, Jamaica example in this paper and its application to areas in England and Spain (Cross 1998; Fernández et al. 2003; Irigaray et al. 2007).
The most significant data requirement for matrix assessment is a map that inventories landslides. While compiling a landslide inventory can be a tedious process, aerial photography and satellite imagery, and more recently, LiDAR, have made it possible over large areas, for a reasonable investment of time and expense (van Westen et al. 2006). The investment in a landslide inventory and related database for matrix assessment pays additional dividends because it is needed for other landslide analysis methods suitable for larger-scale areas. The inventory database also advances the capability for establishing the temporal variability of landslide occurrence, which is a necessary element in establishing landslide hazard (van Westen et al. 2008; Devoli et al. 2007; Trigila et al. 2010).
Another benefit to maintaining a landslide database would be as a means for better defining the reliability of the population of mapped landslides. It should be kept in mind that a landslide inventory map represents a “snapshot” in time of preserved landslides, all of which remain preserved in the landscape for different lengths of time. An inherent limitation arises from having larger and deeper landslides remain recognizable longer than smaller and shallower ones. The population of landslides visible today has been censored, depending on how fast landslides are erased from the landscape by erosion, and how large or deep-seated the landslides were in the first place. McCalpin and Rice (1987) tried to estimate how many landslides had occurred in postglacial time, of various types and sizes, based on the number still visible in late twentieth-century airphotos. This phenomenon of longer preservation for larger slides was also mentioned by Korup (2005). What it means in practical terms is that landslide inventories tend to underestimate (or miss) the progressively smaller landslides. Thus, any landslide inventory is a biased sample of the population of landslides that have happened before and represents a potential systematic error getting into the raw data, that is, the landslide inventory (Romesburg 2009). It poses a problem not only to application of the matrix assessment method but any methodology dependent on a landslide inventory. In practical terms, mitigating this problem starts by conducting landslide inventories with sufficient care to ensure a comprehensive mapping of landslides present. To the extent possible, a reliability statement should be developed for any landslide inventory (Romesburg 2009).
Matrix assessment is specifically designed for regional studies that might be done at map scales of 1:25,000–1:250,000 (Fell et al. 2008). In addition to Dominica, matrix assessment has been applied to two other small island nations, St. Lucia and St. Vincent (De Graff 1985, 1988). It can also be applied to political or geographic subdivisions of larger countries as demonstrated by the Kingston Metropolitan area of Jamaica (Ahmad and McCalpin 1999; Maharaj 1993) or the Betic Cordillera of southern Spain (Irigaray et al. 1999, 2007; Fernández et al. 2003; Chacon et al. 2006b). It is important to emphasize that the landslide-susceptibility maps produced using the matrix assessment approach represents the variation in spatial landslide hazard within an area. Like other landslide-susceptibility mapping, these maps lack the ability to predict the timing of landslide occurrence or the magnitude of its size and impact (Guzzetti et al. 2006). Land and resource allocation, broad zoning regulation, and general planning efforts would be appropriate development activities where matrix assessment could provide a suitable level of landslide hazard information. At intermediate or large scales, other methodologies for determining landslide hazard are more appropriate than matrix assessment (Aleotti and Chowdhury 1999; Chacon et al. 2006a). However, the landslide-susceptibility maps produced by this methodology can serve as a component in the development of landslide hazard maps. This would be achieved by combining the landslide-susceptibility map with a map representing the dynamic triggering mechanism associated with past landslide activity in the assessment area. Because landslide-susceptibility maps produced using the matrix assessment methodology only use static conditioning factors, potential skewing of true hazard zonation that might result from using a landslide-susceptibility map incorporating some factor derived from a triggering mechanism is avoided.
Validation of maps produced using matrix assessment demonstrating its ability to forecast the spatial distribution of future landslides is another advantage. In addition to being validated for volcanic and non-volcanic bedrock in the tropics (De Graff 1990; Maharaj 1993), the methodology is also validated for metamorphic and sedimentary rocks representative of the Betic Cordillera in a Mediterranean climate (Irigaray et al. 2007). The researchers responsible for Betic Cordillera assessment applied the matrix assessment approach as described in De Graff and Romesburg (1980). Within their study area, rainfall from November 1996 to January 1997 initiated a significant number of landslides within the areas where landslide-susceptibility maps were produced. Validation consisted of calculating the coefficients of association with the degree of fit between these recent landslides and the different levels of susceptibility defined by the maps produced a year earlier. The degree of fit values had an error that ranged from 10 to 5 % among the three mapped areas within the Betic Cordillera, southern Spain (Irigaray et al. 2007).
6 Conclusions
For many data-scarce, landslide-prone areas of the world, the matrix assessment approach provides an objective and quantitative representation of the spatial likelihood of landslide occurrence that is suitable for regional development planning. Matrix assessment was intended to be used within a GIS environment. Using GIS technology facilitates creation of the bedrock lithology and slope steepness maps, developing the proportional values for combinations associated with inventoried landslides, performing the statistical analysis, and generating the resulting landslide-susceptibility map. It also affords the opportunity for the landslide-susceptibility map to be used with other GIS-based maps as part of regional planning studies.
Landslides and other natural hazards are part of an array of urgent societal problems and issues being addressed by governments in developing regions. Under these circumstances, it is understandable that reducing impacts from landslides may not have the highest priority. The OAS recognized that reducing impacts from landslides and other natural hazards needed to be part of a sustained effort by governmental institutions. The best way to accomplish this objective is through integration into regional development planning that is an ongoing priority due to its economic importance. It was also recognized that planners and decision-makers needed a method that produced maps with landslide hazard information they could understand and was sufficient for making good decisions on resource and land use issues. In regional development planning, the best possible solutions do not guarantee a better future outcome than practical solutions with a reasonable level of acceptability. Matrix assessment is shown to be one of those practical solutions for providing landslide hazard information for regional development planning.
References
Ahmad R (1996) The Jamaican earthquake of January 13, 1993: geology and geotechnical aspects. J Geol Soc Jamaica 30:15–31
Ahmad R (2008) A new examination of floods in the region debris floods and debris flows in the Caribbean. In: Baban SMJ (ed) Enduring geohazards in the Caribbean. University of the West Indies Press, Kingston, pp 141–156
Ahmad R, McCalpin J (1999) Landslide susceptibility maps for the Kingston Metropolitan Area, Jamaica with notes on their use. Unit for Disaster Studies Publication No. 5, Caribbean Disaster Mitigation Project, Organization of American States, Washington, DC. http://www.oas.org/CDMP/document/kma/udspub5.htm
Ahmad R, De Graff J, McCalpin J (1999) Landslide loss reduction: a guide to the Kingston Metropolitan Area, Jamaica. Unit for Disaster Studies Publication No. 6, Caribbean Disaster Mitigation Project, Organization of American States, Washington, DC. http://www.oas.org/CDMP/document/kma/udspub6.htm
Aleotti P, Chowdhury R (1999) Landslide hazard assessment: summary review and new perspectives. Bull Eng Geol Environ 58:21–44
Ardizzone F, Cardinali M, Carrara A, Guzzetti F, Reichenbach P (2002) Impact of mapping errors on the reliability of landslide hazard maps. Nat Hazards Earth Syst Sci 2:3–14
Baum RL, Coe JA, Godt JW, Harp EL, Reid ME, Savage WZ, Schultz WH, Brien DL, Chleborad AF, McKenna JP, Michael JA (2005) Regional landslide-hazard assessment for Seattle, Washington, USA. Landslides 2:266–279
Brabb EE, Pampeyan EH, Bonilla MG (1972) Landslide susceptibility in San Mateo county, California. US, Geological Survey Miscellaneous Field Studies, Map MF-360
Capparelli G, Tiranti D (2010) Application of the MonFLaIR early warning system for rainfall-induced landslides in Piedmont region (Italy). Landslides 7:401–410
Carrara A, Cardinali M, Guzzetti F (1992) Uncertainty in assessing landslide hazard and risk. ITC J 2:172–183
Case RA, Gerrish HP (1988) Annual summary: Atlantic hurricane season of 1987. Mon Weather Rev 116:939–949
Case B, Mayfield M (1990) Annual summaries: Atlantic hurricane season of 1989. Mon Weather Rev 118:1165–1177
Catani F, Casagli N, Ermini L, Righini G, Menduni G (2005) Landslide hazard and risk mapping at catchment scale in the Arno River basin. Landslides 2:329–342
Chacon J, Irigaray C, Fernández T, El Hamdouni R (2006a) Engineering geology maps: landslides and geographical information systems. Bull Eng Geol Environ 65:341–411
Chacon J, Irigaray C, Fernández T, El Hamdouni R (2006b) Landslides in urban areas of the Granada province, Andalucía, Spain. 10th IAEG International Congress, Nottingham, UK Proceedings, Paper 414:1–11, Geol Soc London, UK. Accessible at: http://iaeg2006.geolsoc.org.uk/cd/
Chung C-JF, Fabbri AG (2003) Validation of spatial prediction models for landslide hazard mapping. Nat Hazards 30:451–472
Clerici A, Perego S, Tellini C, Vescovi P (2002) A procedure for landslide susceptibility zonation by the conditional analysis method. Geomorphology 48:349–364
Commonwealth of Dominica (2001) Initial national communication of the Commonwealth of Dominica under the United Nations framework convention on climate change. Ministry of Agriculture and the Environment, Roseau 91p
Cross M (1998) Landslide susceptibility mapping using the matrix assessment approach: a Derbyshire case study. In Maund JG, Eddleston M (eds) Geohazards in Engineering Geology, Engineering Geology Special Publications 15, London: Geol. Soc. London, pp 247–261
De Graff JV (1977) A procedure for developing an empirical mass failure rule, Appendix Report 33. In: Henderson JA, Davis LS, Ryberg EM (eds) ECOSYM: a classification and information system for wildlands resource management. Utah State University, Logan
De Graff JV (1978) Regional landslide evaluation: two Utah examples. Environ Geol 2:203–214
De Graff JV (1985) Landslide hazard on St. Lucia, West Indies—final Report with maps. Internal report to Department of Regional Development, Organization of American States, Washington, DC, p 20
De Graff JV (1987) Landslide hazard on Dominica, West Indies—final Report with maps. Internal report to Department of Regional Development, Organization of American States, Washington, DC
De Graff JV (1988) Landslide hazard on St. Vincent, West Indies—final Report with maps. Internal report to Department of Regional Development, Organization of American States, Washington, DC
De Graff JV (1990) Post-1987 landslides on Dominica, West Indies: an assessment of landslide-hazard reliability and initial evaluation of vegetation effect on slope stability. Internal report to Department of Regional Development, Organization of American States, Washington, DC
De Graff JV (2012) Solving the dilemma of transforming landslide hazard maps into effective policy and regulations. Nat Hazards Earth Syst Sci 12:53–60
De Graff J V, Bryce R, Jibson RW, Mora S, Rogers CT (1989) Landslides: their extent and economic significance in the Caribbean. In: Brabb EE, Harrod BL (eds) Landslides: extent and economic significance, 28th international geological congress. A. A. Balkema, Washington, DC, pp 51–80
De Graff JV, Romesburg HC (1980) Regional landslide-susceptibility assessment for wildland management: a matrix approach. In: Coats DR, Vitek J (eds) Thresholds in geomorphology. Allen & Unwin, Boston, pp 315–325
De Graff JV, Brabb EE, King AP (1991) Landslide hazard assessment. In: Primer on natural hazard management in integrated regional development planning. DRDE, General Secretariat, OAS, Washington, DC
De Graff JV, James A, Breheny P (2010) The formation and persistence of the Matthieu landslide-dam lake, Dominica, WI. Environ Eng Geo 16(2):73–89
Devoli G, Strauch W, Chávez G, Høeg K (2007) A landslide database for Nicaragua: a tool for landslide-hazard management. Landslides 4:163–176
Fell R, Corominas J, Bonnard C, Cascini L, Leroi E, Savage WZ (2008) Guidelines for landslide susceptibility, hazard and risk zoning for land use planning. Eng Geol 102:85–98
Fernández T, Irigaray C, El Hamdouni R, Chacón J (2003) Methodology for landslide susceptibility mapping by means of a GIS application to the Contraviesa area (Granada, Spain). Nat Hazards 30:297–308
Galli M, Ardizzone F, Cardinali M, Guzzetti F, Reichenbach P (2008) Comparing landslide inventory maps. Geomorphology 94:268–289
Greco R, Sorriso-Valvo M, Catalano E (2007) Logistic regression analysis in the evaluation of mass movements susceptibility: the Aspromonte case study, Calabria, Italy. Eng Geol 89:47–66
Guinau M, Pallàs R, Vilaplana JM (2005) A feasible methodology for landslide susceptibility assessment in developing countries: a case-study of NW Nicaragua after Hurricane Mitch. Eng Geol 80:316–327
Guzzetti F, Carrara A, Cardinali M, Reichenbach P (1999) Landslide hazard evaluation: a review of current techniques and their application in a multi-scale study, Central Italy. Geomorphology 31:181–216
Guzzetti F, Reichenbach P, Ardizzone F, Cardinali M, Galli M (2006) Estimating the quality of landslide susceptibility models. Geomorphology 81:166–184
Hervás J, Bobrowsky P (2009) Mapping: inventories, susceptibility, hazard and risk. In: Sassa K, Canuti P (eds) Landslides-disaster risk reduction. Springer, Berlin, pp 321–349
Highland LM, Bobrowsky P (2008) The landslide handbook—a guide to understanding landslides. US Geol Surv, Circ 1325
Hromadka TV II, Hromadka TV III, Phillips M (2010) Use of rainfall statistical return periods to determine threshold for mass wasting events. Environ Eng Geo 16:343–356
Irigaray F, Fernández T, El Hamdouni R, Chacon J (1999) Technical communication: verification of landslide susceptibility mapping: a case study. Earth Surf Proc Landf 24:537–544
Irigaray F, Fernández T, El Hamdouni R, Chacon J (2007) Evaluation and validation of landslide-susceptibility maps obtained by a GIS matrix method: examples from the Betic Cordillera (southern Spain). Nat Hazards 41:61–79
Keaton JR, De Graff JV (1996) Surface observation and geologic mapping. In: Turner AK, Schuster RL (eds) Landslides—investigation and mitigation, transportation research board special report 247. National Academy Press, Washington, DC, pp 178–230
Korup O (2005) Distribution of landslides in southwest New Zealand. Landslides 2:43–51
Larsen MC (2008) Rainfall-triggered landslides, anthropogenic hazards, and mitigation strategies. Adv Geosci 14:147–153
Lawrence MB, Gross JM (1989) Annual summaries:Atlantic hurricane season of 1988. Mon Weather Rev 117:2248–2259
Lee S, Ryu J-H, Kim L-S (2007) Landslide susceptibility analysis and its verification using likelihood ratio, logistic regression, and artificial neural network models: case study of Youngin, Korea. Landslides 4:327–338
Maharaj RJ (1993) Landslide processes and landslide susceptibility analysis from an upland watershed: a case study from St. Andrew, Jamaica, West Indies. Eng Geol 34:53–79
Mann P, Burke K (1990) Transverse intra-arc rifting Palaeogene Wagwater Belt, Jamaica. Mar Petrol Geol 7:410–427
Mann P, Demets C, Wiggins-Grandison M (2007) Toward a better understanding of the Late Neogene strike-slip restraining bend in Jamaica: geodetic, geological, and seismic constraints. In: Cunningham WD, Mann P (eds) Tectonics of strike-slip restraining and releasing bends. Geol Soc Lond, Spec Pub 2007, pp 239–253
McCalpin J (1984) Preliminary age classification of landslides for inventory mapping. In: Proceedings of the 21st engineering geology and soils engineering symposium, University, Moscow, ID, pp 99–120
McCalpin J, Rice Jr JB (1987) Spatial and temporal analysis of 1200 landslides in a 900 km2 area, Middle Rocky Mountains Wyoming, USA. In: Proceedings of the 5th international conference and field workshop on landslides, Christchurch, New Zealand, August 10-12, 1987, pp 137-146
Melchiorre C, Matteucci M, Azzioni A, Zanchi A (2008) Artificial neural networks and cluster analysis in landslide susceptibility zonation. Geomorphology 94:379–400
Nadim F, Kjekstad O, Peduzzi P, Herold C, Jaedicke C (2006) Global landslide and avalanche hotspots. Landslides 3:159–173
OAS (1990) Disaster, planning and development: managing natural hazards to reduce loss. DRDE, Organization of American States, Washington, DC. http://www.oas.org/DSD/publications/Unit/oea54e/begin.htm
OAS (1991) Primer on natural hazard management in integrated regional development planning. Organization of American States. Washington, DC. http://www.oas.org/DSD/publications/Unit/oea66e/begin.htm
Osgood CE, Suchi GJ, Tannenbaum PH (1957) The measurement of meaning. University of Illinois Press, Champaign
Rammealeare M, Parkes E, Green G, Holliday D, Balkissoon IG (1994a) Blue Mountain Geological Sheet 13 with explanation of geology, Jamaica 1:50,000 geological series (Metric Edition). Geological Survey Division, Ministry of Public Utilities, Mining and Energy, Kingston, Jamaica
Rammealeare M, Parkes E, Porter ARD, Bateson JH (1994b) Kingston Geological Sheet 18 with explanation of geology, Jamaica 1:50,000 geological series (Metric Edition). Geological Survey Division, Ministry of Public Utilities, Mining and Energy, Kingston, Jamaica
Romeo RW, Floris M, Veneri F (2006) Area-scale landslide hazard and risk assessment. Environ Geol 51:1–13
Romesburg HC (1984) Cluster analysis for researchers. Lulu Press, Belton
Romesburg HC (2009) Best research practices: how gain reliable knowledge. Lulu Enterprises, Morrisville
Romesburg HC (2010) Cluster analysis-an introduction. In: Lovric M (ed) International encyclopedia of statistical science. Springer, Berlin, pp 262–265
Romesburg HC, Marchall K (1985) CHITEST: a Monte-Carlo computer program for contingency table tests. Comput Geosci 11:69–78
Roobol MJ, Smith AL (2004) Geological map of Dominica, West Indies. Geology Department, University of Puerto Rico at Mayaquez. http://www.caribbeanvolcanoes.com/dominica/content/dominicamap.pdf
Soeters R, van Westen CJ (1996) Slope instability, recognition, analysis, and zonation. In: Turner AK, Schuster RL (eds) Landslides—investigation and mitigation, transportation research board special report 247. National Academy Press, Washington, DC, pp 129–177
Thiery Y, Malet J-P, Sterlacchini S, Puissant A, Maquaire O (2007) Landslide susceptibility assessment by bivariate methods at large scales: application to a complex mountainous environment. Geomorphology 92:38–59
Trigila A, Iadanza C, Spizzichino D (2010) Quality assessment of the Italian landslide inventory using GIS processing. Landslides 7:455–470
Turner AK, McGuffey VC (1996) Organization of investigation process. In: Turner AK, Schuster RL (eds) Landslides—investigation and mitigation, transportation research board special report 247. National Academy Press, Washington, DC, pp 121–128
Turner AK, Schuster RL (eds) (1996) Landslides—investigation and mitigation, transportation research board special report 247. National Academy Press, Washington, DC
UNDESA (2004) World population to 2300. United Nations Secretariat, New York, NY. http://www.un.org/esa/population/publications/longrange2/WorldPop2300final.pdf
van Westen CJ, Rengers N, Soeters R (2003) Use of geomorphological information in indirect landslide susceptibility assessment. Nat Hazards 30:399–419
van Westen CJ, van Asch TWJ, Soeters R (2006) Landslide hazard and risk zonation—why is it so difficult? Bull Eng Geol Environ 65:167–184
van Westen CJ, Castellanos E, Kuriakose SL (2008) Spatial data for landslide susceptibility, hazard, and vulnerability assessment: an overview. Eng Geol 102:112–131
Wieczorek GF (1984) Preparing a detailed landslide-inventory map for hazard evaluation and reduction. Bull As Eng Geol 21(4):337–342
Wills CJ, McCrink TP (2002) Comparing landslide inventories: the map depends on the method. Environ Eng Geosci 8(4):279–293
World Bank (2004) Dominica: natural disasters and economic development of a small island state. Disaster risk management working papers series No. 2. Disaster Management Facility, Washington, DC
Author information
Authors and Affiliations
Corresponding author
Rights and permissions
About this article
Cite this article
De Graff, J.V., Romesburg, H.C., Ahmad, R. et al. Producing landslide-susceptibility maps for regional planning in data-scarce regions. Nat Hazards 64, 729–749 (2012). https://doi.org/10.1007/s11069-012-0267-5
Received:
Accepted:
Published:
Issue Date:
DOI: https://doi.org/10.1007/s11069-012-0267-5