
Abstract
Biological signal acquisition is a fundamental part of the following signal processing methods. This study is focused on hardware and software solution for an electrophysiological measurement in neurological patients and healthy controls. This paper deals with a design and an implementation of the system for transcranial magnetic stimulation (TMS) applied over the human motor cortex, which has the diagnostic and potential therapeutic effect, respectively. The system was successfully used for examinations of 22 neurological patients (mean age 51 ± (SD) 17 years) suffering from dystonia of various distribution and etiology treated by chronic deep brain stimulation of globus pallidus interna (GPi DBS). Established values of the motor-evoked potential’s (MEP) parameters are in line with the current literature. Designed system for TMS examination is an effective tool for studying the pathophysiology of neurological diseases.
Access provided by Autonomous University of Puebla. Download conference paper PDF
Keywords
1 Introduction
Over the past decades, TMS has become a tool of significant importance in both basic and clinical neurosciences [1]. Gradually coupled with stimulation by single TMS pulses, techniques of paired-pulse stimulation, repetitive stimulation, and various hybrid protocols appeared [2, 3]. The cost of measurement is rising quickly, so it is essential to use efficient HW and SW resources to shorten the time of the electrophysiological examination. The measuring chain is a pivotal element that, in a convenient configuration, facilitates the work and allows part of operations to be partially or fully automated.
Instrumentation technique routinely used to record motor-evoked potentials (MEPs) in EMG laboratories usually allows only to display the potential waveform after the arrival of the stimulation TMS pulse. This approach is insufficient for our purposes as it does not allow to randomize the order of pulses varying in stimulation parameters. Moreover, it is unable to subsequently sort and process data according to these criteria. Most of these amplifiers are not equipped for communication with the connected stimulator as they only synchronize the moment of recording with the stimulation discharge. Therefore, we selected and implemented a system with its own programming language to enable us to divide our experimental measurements on a dystonic patient group into blocks, to automatically randomize the pulse rate differing by intensity and time span, and to display the resulting data on-line.
As Albanese defines: ‘Dystonia is a movement disorder characterized by sustained or intermittent muscle contractions causing abnormal, often repetitive, movements, postures, or both’ [4]. Much of the current literature on pathophysiology of dystonia pays particular attention to three general abnormalities: loss of inhibition, sensory dysfunction and a derangement of plasticity [5]. A well-established approaches to test intracortical inhibition and plasticity in humans in a noninvasive way are short interval intracortical inhibition (SICI) and paired associative stimulation (PAS) [5].
2 MEP Acquisition
MEPs are obtained using TMS. TMS is an indirect and non-invasive method used to induce excitability changes in a motor cortex via wire coil generating a magnetic field that passes through the scalp [6]. In general, single-pulse and paired-pulse TMS are used to explore brain functioning, whereas repetitive TMS (rTMS) is used to induce changes in brain activity that can last beyond the stimulation period.
TMS applied over the motor cortex leads to an activation of pyramidal cells evoking descending volleys in the pyramidal axons projecting on spinal motoneurons. Motoneuron activation in response to corticospinal volleys induced by TMS leads to contraction in the target muscle evoking MEP on electromyography (EMG). This potential is recorded by the constructed TMS system [6]. Its latency [7], peak-to-peak amplitude [8, 9], duration [10], number of phases [11] or area under curve [12] can be used to describe and estimate parameters of motor cortex and whole corticospinal tract [6].
2.1 System Requirements
The proposed system is designed to address three major challenges. The first part is for the motor threshold (resting MT and action MT). The other two parts are for SICI and PAS. During the determination of AMT and RMT, the acquisition of potentials is controlled by the moment of the stimulator discharge. The length of the recorded epoch is 100 ms. A request is made to display the last 10 MEPs on the screen and to calculate their amplitude on-line. There is also a requirement to determine the number of pulses greater than the stated limit (50 uV for RMT, 200 uV for AMT).
During SICI measurement we require that MEPs are sorted separately after paired pulse and especially after simple TMS stimulation. By that, it is possible to visually assess the effect of paired stimulation immediately. It is important to automatically adjust stimulus intensities and interstimulation intervals and randomize single/paired TMS pulses.
For PAS, we want to measure sets of curves showing the size of MEP depending on the pacing pulse power. Using these curves the PAS effect is measured before the intervention and then at 0, 15 and 30 min after stimulation.
2.2 Data Flow
SICI (Fig. 1) is obtained with paired-pulse stimulation and reflects interneuron influence in the cortex. The measurement is divided by the intensity of the conditioning pulse into blocks. In each block, 15 simple and 15 paired pulses are randomly mixed. These pulses are filtered by bandpass and averaged. From each average curve, the latency (ms) and its amplitude (mV) are determined. From the amplitude ratio, the magnitude of the intracortical inhibition is finally calculated.

Short interval intracortical inhibition (SICI) diagram
PAS is a combination of repetitive transcranial magnetic stimulation (rTMS) and repetitive electrical peripheral nerve stimulation (rENS) [13]. This protocol produces a long-lasting and somatotopically specific increase in corticospinal excitability. PAS effect (Fig. 2) can be accessed in a variety of ways. One of possible options is to measure the so-called ‘Stimulus response curve’ (SRc) before and after PAS and evaluate its change.

Paired associative stimulation (PAS) diagram
2.3 System Testing
The system has been tested on 22 patients (13F, 9 M, mean age 51 ± (SD)17 years) with dystonia of various distribution (15 generalized, 7 cervical) and etiology treated by chronic pallidal deep brain stimulation (DBS). For comparison, we included 22 age- and gender-matched healthy controls (13F, 9 M, aged 51 ± (SD)17 years) with no history of neurological or psychiatric disorder. All subjects gave their informed consent to participate and the study was approved by the local ethics committee of the General Faculty Hospital in Prague in compliance with the Declaration of Helsinki.
After the examination, latencies and amplitudes measured by MEP were evaluated off-line. A magnitude of inhibition was calculated from the MEP amplitude ratio, whereas the PAS effect was evaluated by SRc.
3 TMS System Description
3.1 Hardware Solution
The created system (see Fig. 3) measures the MEPs elicited by TMS applied over motor cortex. The signal is recorded using surface electrode (Alpine Biomed Denmark, REF: 90,13L0453, connector 1.5 mm TPC, cable 50 cm) in belly-tendon montage from the targeted hand muscle (abductor pollicis brevis—APB, abductor digiti minimi—ADM), amplified (Quad System 1902, Cambridge Electronics Design), converted to the digital representation (ADC, Power 1401 mk II, CED) and then saved on the computer (Notebook Lenovo, Think Pad T530, Intel Core i7, OS Windows 7 Professional, 8 GB RAM) for later offline analysis.

Block diagram of the TMS system
Individual parts of the system communicate together using USB and RS-232 interface. Synchronized pulses are propagated through coaxial cable (RG 58 C/U, 50 O, Ø 0, 9/19 × 0,18 mm, PE) in TTL (transistor-transistor-logic) values.
Measuring chain is for better functionality and data reproducibility completed by an optical tracking system (OTs, BrainSight Frameless, Rogue Research Inc) and stereotactic frame. OTs is a means of determining in real-time the position of an object (stimulating coil) by tracking the positions of either active or passive infrared markers attached to the object [14]. The position of the point of reflection is determined using special camera system (Polaris). This system is necessary for better monitoring of the magnetic field position and non-invasive stereotactic frame minimizes patients’ head movements.
3.2 Software Solution
Whole process is driven by scripts written in Signal programming language (version 5.09, CED). Signal is a sweep-based data acquisition and analysis package. Its use ranges from a simple storage oscilloscope to complex applications requiring stimulus generation, data capture, control of external equipment and analysis. These scripts ensure an adjustment of parameters of the ADC (sampling frequency: 5 kHz, resolution: 16 bit), signal conditioner (frequency band: 5–2000 Hz, filter type: B’Worth 3rd order) and TMS stimulator (number of pulses, stimulation intensity, interstimulus interval).
Script algorithm description:
-
1.
Termination of all previous measurements and deletion of the current configuration file.
-
2.
Display of information about the upcoming measured protocol.
-
3.
Loading of new configuration file that consists of: sampling frequency of the AD converter, recorded frame length, the number of used channels and their parameters:
-
a.
Gain value (1000x), voltage offset (0 mV), filter type (high pass filter: 3-pole B’Worth, low pass filter: B’Worth), cut-off frequency (5 Hz for the high pass filter, 2 kHz for the low pass filter) and notch filter switch on/off.
-
b.
Activation of an output port, through which a control TTL pulses for the magnetic and electric stimulator are generated.
-
c.
Selection of the number of extra states and the number of repetitions of each of them. Specification of the exact type of connected device (Magstim BiStim) and the COM port used for mutual communication.
-
d.
Creating of a file name template for a data storage. Setting a path for data saving, and sampling limits on how much data should be stored in one file.
-
a.
-
4.
Creating the dialog for entering patient identification (surname, year of the birth), threshold values (AMT, RMT) and other data according to the current protocol.
-
5.
Establishing a folder for storing measured data. The folder name contains the patient’s name and year of birth. Folders are further sorted into a structure according to specific examinations.
-
6.
At the end of acquisition storing data and close windows (Fig. 4).
Fig. 4 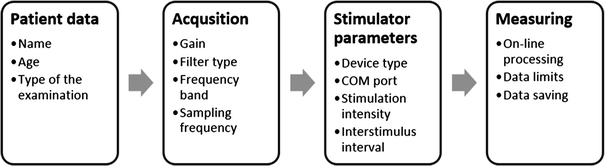
Script algorithm

4 System Validation
The system was used for examination of dystonic patients group and healthy control subjects. Found values (see Table 1) are comparable to studies handling with MEP analysis. The average RMT value was 53% while Kojovic [15] in his study reported 51.3% of the magnetic stimulator output. The action threshold is then lower in both cases by about 10% of the stimulator output. Latencies of MEP evoked by single TMS pulse measured from the APB muscle are 21.5 ± 1.1 ms and ADM muscle 21.7 ± 1.1 ms. In his work, Livingston [16] reported 20.7 ± 1.4 ms for n.medianus (APB) and 20.1 ± 2.1 ms for n.ulnaris (ADM).
5 Discussion
The purpose of this study was to describe the technical solution and software for the motor-evoked potential acquisition system. According to defined requirements, we have developed a system that enables us to examine a group of dystonic patients and of control subjects in the electrophysiological examination protocol. It allows the determination of AMT and RMT values, to investigate the influence of intracortical inhibition and to evaluate the effect of PAS. The system was implemented both technically and programmatically. In the Signal programming environment, we wrote scripts to control the function of individual cells in the measuring chain (stimulators, amplifier, AD converter) and data acquisition. The collected data were analyzed in the Signal environment as well.
The values of MEPs parameters are in line with the literature (Table 1). Since each TMS study has a group of control subjects that serves as a source of reference values, the deviations in our findings from other authors’ ones are not significant.
The main advantages of the system are the ability to automatically control pacing parameters via the control computer. It allows the examination to be divided into blocks within which pulses are randomized with no need to manually interfere with the process. Therefore, the attending staff can pay full attention to the position of the stimulation coil which is most important during TMS examination.
We plan to expand the system for measuring the transcallosal inhibition in the group of patients after stroke.
6 Conclusion
We designed, developed and described TMS system, which was successfully used for examination of 22 patients (mean age 51 ± (SD) 17 years) suffering from dystonia and 22 age- and gender-matched healthy controls. Using the system, we found significant differences between the patients and healthy controls in MEP parameters (MEP onset latency, amplitude). Designed system for TMS examination is an effective tool for studying the pathophysiology of neurological diseases.
References
Herbsman, T., et al., Motor threshold in transcranial magnetic stimulation: the impact of white matter fiber orientation and skull-to-cortex distance. Hum Brain Mapp, 2009. 30(7): p. 2044–55.
Stefan, K., et al., Induction of plasticity in the human motor cortex by paired associative stimulation. Brain, 2000. 123 Pt 3: p. 572–84.
Wittenberg, G.F. and M.A. Dimyan, How do the physiology and transcallosal effects of the unaffected hemisphere change during inpatient rehabilitation after stroke? Clin Neurophysiol, 2014. 125(10): p. 1932–3.
Albanese, A., et al., Phenomenology and classification of dystonia: a consensus update. Mov Disord, 2013. 28(7): p. 863–73.
Quartarone, A. and M. Hallett, Emerging concepts in the physiological basis of dystonia. Mov Disord, 2013. 28(7): p. 958–67.
Klomjai, W., R. Katz, and A. Lackmy-Vallee, Basic principles of transcranial magnetic stimulation (TMS) and repetitive TMS (rTMS). Ann Phys Rehabil Med, 2015. 58(4): p. 208–13.
Kallioniemi, E., et al., Onset Latency of Motor Evoked Potentials in Motor Cortical Mapping with Neuronavigated Transcranial Magnetic Stimulation. Open Neurol J, 2015. 9: p. 62–9.
Rosler, K.M., D.M. Roth, and M.R. Magistris, Trial-to-trial size variability of motor-evoked potentials. A study using the triple stimulation technique. Exp Brain Res, 2008. 187(1): p. 51–9.
Vaseghi, B., M. Zoghi, and S. Jaberzadeh, Inter-pulse Interval Affects the Size of Single-pulse TMS-induced Motor Evoked Potentials: A Reliability Study. Basic Clin Neurosci, 2015. 6(1): p. 44–51.
Kalupahana, N.S., et al., Abnormal parameters of magnetically evoked motor-evoked potentials in patients with cervical spondylotic myelopathy. Spine J, 2008. 8(4): p. 645–9.
Chowdhury, F.A., et al., Motor evoked potential polyphasia: a novel endophenotype of idiopathic generalized epilepsy. Neurology, 2015. 84(13): p. 1301–7.
Leon-Sarmiento, F.E., et al., A new neurometric dissection of the area-under-curve-associated jiggle of the motor evoked potential induced by transcranial magnetic stimulation. Physiol Behav, 2015. 141: p. 111–9.
Quartarone, A., Rapid-rate paired associative stimulation of the median nerve and motor cortex can produce long-lasting changes in motor cortical excitability in humans, in Jurnal of Physiology. 2006. p. 657–670.
Hernandez-Pavon, J.C., et al., Effects of navigated TMS on object and action naming. Front Hum Neurosci, 2014. 8: p. 660.
Kojovic, M., et al., Secondary and primary dystonia: pathophysiological differences. Brain, 2013. 136(Pt 7): p. 2038–49.
Livingston, S.C., H.P. Goodkin, and C.D. Ingersoll, The influence of gender, hand dominance, and upper extremity length on motor evoked potentials. J Clin Monit Comput, 2010. 24(6): p. 427–36.
Acknowledgements
Supported by research grant projects offered by the Czech ministry of education: IGA NT 12282, by the Czech Science Foundation GAČR 16-13323S and by the Charles University, Prague, Czech Republic: Progres Q27/LF1.
Author information
Authors and Affiliations
Corresponding author
Editor information
Editors and Affiliations
Ethics declarations
The authors declare that they have no conflict of interest.
Rights and permissions
Copyright information
© 2019 Springer Nature Singapore Pte Ltd.
About this paper

Cite this paper
Čejka, V., Fečíková, A., Klempíř, O., Krupička, R., Jech, R. (2019). System for Motor Evoked Potentials Acquisition and Analysis. In: Lhotska, L., Sukupova, L., Lacković, I., Ibbott, G. (eds) World Congress on Medical Physics and Biomedical Engineering 2018. IFMBE Proceedings, vol 68/3. Springer, Singapore. https://doi.org/10.1007/978-981-10-9023-3_16
Download citation
DOI: https://doi.org/10.1007/978-981-10-9023-3_16
Published:
Publisher Name: Springer, Singapore
Print ISBN: 978-981-10-9022-6
Online ISBN: 978-981-10-9023-3
eBook Packages: EngineeringEngineering (R0)