
Abstract
Within the various chapters of this book, the methodology and different applications of infrared thermography in sport science will be discussed. But what are the origins of infrared thermography? What has its development been like in sport science? The present introductory chapter of the book aims to show the historical developments of infrared thermography and, fundamentally, its application in sport science.
Access provided by CONRICYT-eBooks. Download chapter PDF
Keywords
These keywords were added by machine and not by the authors. This process is experimental and the keywords may be updated as the learning algorithm improves.
1.1 Introduction
Infrared thermography features and its applications are constantly evolving. In recent decades, the technique has seen significant development. Furthermore, approximately 20 years ago, the use of infrared thermography in sport science was uncommon. However, in recent years, many sport laboratories have acquired an infrared camera and have begun to undertake thermographic assessments. Knowledge of the evolution of thermography during the twentieth century in general, and in sports science in particular, can provide a perspective that helps in the present and future use of thermography.
Infrared thermography has a large number of applications. As will be shown in the different chapters of this book, infrared thermography in sports science has applications in various fields: sports medicine, analysis of thermoregulation, clothing and sport equipment assessment, and so on. Outside the field of sports, thermography is used in a wide range of sectors. Infrared thermography is used in the military, policing and security work enabling night vision and surveillance. In electrical installations, nuclear power plants and other factories, it is used, for example, for the monitoring of electrical components. In medicine, it is used for the diagnosis of injuries and diseases. In firefighting, infrared cameras are used to locate people/animals in heavy smoke and for detecting hot spots in forest fires. Infrared imaging is used in building inspections to detect issues related to insulation and water leaks. There are also infrared satellites that measure the ocean temperatures continuously. Although this chapter will be focused as much as possible on sport and human assessment, we believe that it is necessary to use the chapter to show other different applications . Sometimes these applications may appear to be far from the field of sport science. However, they are necessary to know because they may contribute to ideas for future developments and research in sport science.
This chapter aims to provide a general overview of both the past and present of infrared thermography in sport science. However, in order to achieve this objective, it is first necessary to review the origins of infrared thermography and its applications in other fields. One of these fields, very close to sport science, is medicine, and the beginning of the use of infrared thermography in medicine will be reviewed.
1.2 Origins: Discovery of Infrared Radiation, the First Thermography and the Development of Infrared Sensors
Infrared thermography is an image technique used to record infrared radiation, which permits estimation of a body’s surface temperature. Any object at a temperature above absolute zero (0 K or −273.15 °C) emits energy—electromagnetic radiation—depending on its temperature [1, 2]; for the ~37 °C of the human body, the emitted energy is in the infrared region of the electromagnetic spectrum (thermal radiation) [3, 4]. Aspects related to the physics principles of infrared thermography will be discussed in the Chap. 2.
Infrared radiation was discovered in 1800 by Sir Frederick William Herschel (born in 1738 in Hannover, Germany; died in 1822 in Slough, England), an English–German astronomer (Fig. 1.1). It is well known by all scientists working with thermography that William Herschel was the astronomer who discovered infrared radiation. However, there are some interesting facts that may be unfamiliar to some. Herschel was a professional musician and the director of an orchestra; he could be considered to be a professional musician and an amateur astronomer or scientist. Some of the discoveries he made in his dedication to astronomy was the observation of the planet Uranus in 1781, as well as the discovery in 1783 that the sun was not static as it had always previously been believed, but rather that the sun moves by dragging with it the planets of the solar system.

William Herschel and the experiment in which he discovered infrared radiation
After learning a little more about William Herschel, we will discuss his discovery of infrared radiation. Herschel was interested in learning how much heat passed through the different colors by watching the sun filters. He set this objective because he observed that the amount of heat transmitted depended on color. Herschel thought that the colors themselves could filter out different amounts of heat, so he devised an original experiment to test his hypothesis. He directed sunlight trough a glass prim to create a visible spectrum (a rainbow, a division of the light in the different colors). He placed three mercury thermometers in the spectrum obtained by a glass prism in order to measure the heat emitted by each color [5] (Fig. 1.1). Herschel used three thermometers with blackened bulbs (to better absorb heat) and, for each color of the spectrum, placed one bulb in a visible color while the other two were placed beyond the spectrum as control samples. He found that the heat increased from the violet to the red color of the spectrum. However, he also observed that next to the red spectrum, when there was no light, the temperature was higher [5]. This experiment from Herschel was very important because it marked the first time that someone had demonstrated that there were types of energy that are invisible to our eyes. Herschel called this radiation “Calorific Rays”, a name quite popular throughout the nineteenth century that finally was giving the modern term “infrared radiation”.
The following text is an extraction of the conclusion of the article in which Herschel explained the results of his experiment [5]:
“To conclude, if we call light, those rays which illuminate objects, and radiant heat, those which heat bodies, it may be inquired, whether light be essentially different from radiant heat? In answer to which I would suggest, that we are not allowed, by the rules of philosophizing, to admit two different causes to explain certain effects, if they may be accounted for by one. A beam of radiant heat, emanating from the sun, consists of rays that are differently refrangible. The range of their extent, when dispersed by a prism, begins at violet-coloured light, where they are most, refracted, and have the least efficacy. We have traced these calorific rays throughout the whole extent of the prismatic spectrum; and found their power increasing while their refrangibility was lessened, as far as to the confines of red-coloured light. But their diminishing refrangibility, and increasing power, did not stop here; for we have pursued them a considerable way beyond the prismatic spectrum, into an invisible state, still exerting their increasing energy, with a decrease of refrangibility up to the maximum of their power; and have also traced them to that state where, though still less refracted, their energy, on account, we may suppose, of their now failing density, decreased pretty fast; after which, the invisible thermometrical spectrum, if I may so call it, soon vanished. If this be a true account of solar heat, for the support of which I appeal to my experiments, it remains only for us to admit, that such of the rays of the sun as have the refrangibility of those which are contained in the prismatic spectrum, by the construction of the organs of sight, are admitted, under the appearance of light and colours; and that the rest, being stopped in the coats and humours of the eye, act upon them, as they are known to do upon all the other parts of our body, by occasioning a sensation of heat.”
After the death of William Herschel, his son, John Frederick William Herschel (born in 1792 in Slough, England; died in 1871 in Collingwood, England), repeated the experiments of his father and made an image using solar radiation in 1840 [6]. This image was achieved by focusing solar radiation onto to a suspension of carbon particles in alcohol using a lens, a method known as evaporography [6]. He obtained an image that he called a “thermogram ” (Fig. 1.2), a term that is still in use today for the infrared thermography technique [6]. John Herschel was an important mathematician, astronomer, chemist, inventor and photographer (Fig. 1.2).

John Herschel and the thermogram performed by him using the evaporography method. Figure modified from Ring [6]
After John Herschel, some of the most important advances were related to the development of infrared detectors . Of course, the determination of the physical laws that explained the relationship between temperature and infrared radiation had great importance, but these laws will be explained in Chap. 2 of this book.
A bolometer is a device that measures electromagnetic radiation by the increase in the resistance of an electrical conductor. Samuel Pierpont Langley (born in 1834 in Roxbury, USA; died in 1906 in Aiken, USA) was the inventor of the balometer, originally called Langley’s bolometer, in 1880 [2, 7]. The Langley’s bolometer followed a continuous process of development over 20 years, increasing its sensitivity until 400 more times from the first prototype [7]. The last bolometer of Langley was able to detect the heat from a cow at a distance of ~400 m [7]. It is considered that the invention of the balometer was relevant and important in the development of the posterior infrared cameras [2].
After the development of the bolometer, one of the most important steps was considered to be the development of the infrared photon detectors during the XX century [7]. The first infrared photoconductor was developed in 1917 [7], but the origins of the modern infrared detector technology are considered to have been developed during World War II [6, 7]. These detectors were developed at the end of World War II for use by snipers, to enable features such as rudimentary night vision [8]. These sensors involved the conversion of infrared radiation in visible light, due to the catchment of the electrons from near-infrared cathodes by the visible phosphors [8]. At the same time, another infrared detector was made from indium antimonide, and was mounted at the base of a small Dewar vessel to allow cooling with liquid nitrogen [6, 8]. This device had the limitation of requiring a constant supply of liquid nitrogen, which was impractical for battlefield, but not an important inconvenience in other fields such as the medicine [8].
1.3 Antecedents and Contemporaries: Infrared Thermography in Medicine and Other Applications
As was discussed in the previous section, modern infrared detectors were developed during World War II. The sensor was developed in this period for its military applications [2, 4, 9]. Its main use in the military field was, and remains, night vision . This utility is also highlighted when the objective is to detect people in dark environments and complex spaces. A clear example of this is border and maritime space supervision (Fig. 1.3).

Use of infrared camera in a helicopter as part of the border control of a country. Inside the circle it can see small dots that are people walking across the border during the night
After infrared thermography had been used in military applications, the technology was released for civilian uses [1, 9]. In 1934, human skin was described to be a good emitter of infrared radiation [10]. After that, infrared thermography started to be considered as a potential technique for skin temperature measurement and, then, as a possible way to enable diagnostic imaging in medical science [9]. In this regard, one of the applications of infrared thermography that is very related to sport science was medicine , which is discussed below.
Although Vardasca and Simoes [2] reported that the first human thermographic image was done by Czerny in 1928 in Germany [11], Ring [6] described that the greatest advances of the techniques were performed in the 1940s and 1950s; these advances allowed a better quality of thermal images, but were very crude in comparison with modern thermographies (Fig. 1.4). Due to the advances of the technique in those years, infrared thermography is considered to have been used in medicine since the 1960s [1, 9, 12, 13]. It is considered that the first medical infrared images were taken at The Middlesex Hospital in London and The Royal National Hospital for Rheumatic Diseases in Bath, UK, between 1959 and 1961, using a prototype system called “Pyroscan” [6, 8]. This system represented an improvement in the quality of the image and “printed” the image line-by-line on electro-sensitive paper, but it took a lot of time to record each image (between 2 and 5 min) [6, 8].

Photography and thermography of one woman taken in 1949. Figure obtained from Ring [6]
The first applications of infrared thermography in medicine in that decade were the diagnosis of peripheral vascular diseases [14], its use in obstetrics and gynecology [15] and the detection of ischemic neuropathies [16], among others. A current overview of all the applications that infrared thermography has in medicine is provided by the interesting reviews performed by Ring and Ammer [17], and Lahiri and colleagues [9], both of which were published in 2012. These reviews extracted the following applications of infrared thermography in medicine: assessment of the thermoregulation, breast cancer detection, diagnosis of diabetic neuropathy and vascular disorder, fever screening, dental diagnosis, dermatological applications, blood pressure monitoring, diagnosis of rheumatic diseases, diagnosis of inflammatory arthritis, assessment of fibromyalgia, diagnosis of dry eye syndrome and ocular diseases, diagnosis of liver diseases, complementary test in the treatment of kidney, gynecology applications, and assessment of the psychological state [9, 17].
Of the above applications, cancer detection was one given a higher priority in the hope that it could be a valid screening technique [6]. In this sense, the earliest assessment of the temperature distribution of a breast cancer was reported by Ray Lawson in 1956 using the evaporograph system [18] (Fig. 1.5a). The author said in his publication: “In its present state of development, the Evaporograph has a high resolution for objects having sudden or abrupt temperature changes, however slight (such as blacked-out cities at night), but where the temperature shows a smooth fall-off, the oil image lacks sensitivity, This remarkable device is quite capable of much future development”. Lawson, one year later, appreciated the potential of infrared thermography in the detection of breast cancer [19]. Different research groups have worked on this topic since the suggestion of Lawson in 1957 to the present day. Figure 1.5b shows a current breast thermography in order to illustrate how the technique has improved since Lawson’s days. However, more research into infrared thermography is still required in order to improve its sensitivity and specificity in breast cancer screening and diagnosis [20].

In the beginning of infrared thermography’s application in medicine, the technique was often discredited, mainly because the technology at the time was inadequate [22]. However, the improvement of the quality of the camera and the analysis of the thermal data over the years have led to the increasing use and efficiency of thermal imaging as a tool for diagnostic imaging procedures [22]. In this sense, infrared thermography was recognized as a feasible diagnostic and analytical tool by the American Medical Council in 1987 [3, 22]. After that, the application of infrared thermography in the assessment of skin temperature in medicine has been acknowledged and promoted by different worldwide thermographic associations, such as the American Academy of Medical Infrared Imaging, the International Academy of Clinical Thermology, the International Thermographic Society, the European Association of Thermology, the Northern Norwegian Centre for Medical Thermography and the German Society of Thermography and Regulation Medicine [3, 23]. The main objective of these groups was and remains to develop reliable standardized methods and appropriate protocols for infrared thermography for clinical application [3].
Infrared thermography is used in other applications related to medicine (e.g., veterinary science) but also in other fields such, as engineering. Although these applications are further away from sport science, all of them are based on the assessment of heat transference. A superficial knowledge of its use can sometimes provides useful ideas for thermography assessment in sport science. For a review of a high number of applications of infrared thermography across different fields, the book of Vollmer and Möllmann [24] is recommended. In this chapter, some examples of representative and diverse applications are commented on below:
-
Veterinary science. Infrared thermography has, in this area, a similar utility as in medicine. However, due to some characteristics, it has become very important in veterinary science. The difficulty of knowing the pain and the patient’s condition without invasive techniques is higher in veterinary science than in medicine, and thus thermography is a low-cost, fast, efficient and simple method that allows knowledge of the status of the animal’s injury [25] (Fig. 1.6). Additionally, the use of invasive methods produces anxiogenic responses in the animal that can affect the results [25]. Furthermore, it is considered that, in the veterinary field, thermography assessment can be useful to estimate the physiological state of animals in situations of stress, fertility, welfare, metabolism, health and disease detection [25].
Fig. 1.6 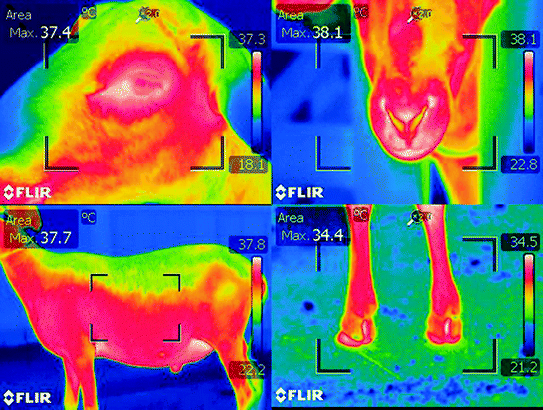
Examples of thermographic images of sheep used to predict physiological stress. Figure obtained from McManus et al. [25]
-
Predictive maintenance of factories. This application is widely used in electrical and nuclear facilities , and in different factories . This kind of application is particularly important when the factories need to work continuously without stoppages occurring in their activity due to breakdowns. In this context, infrared thermography helps routine inspections, where it is possible to visualize abnormalities in the components. This display of anomalies would be able to repair or replace components before they produce serious damage to the operation of the factory (Fig. 1.7). In addition, infrared thermography in this context allows the person to carry out inspection at a safe distance from hazardous components (e.g., those with high temperature or radioactivity) and to measure the temperature without contact. Another use in this field, especially in the petroleum chemical industry, is able to know the level of liquids and solids in the deposits [24].
Fig. 1.7 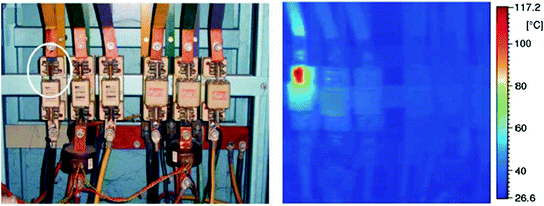
Example of an electric fuse with a high temperature which can be a cause of breakdown. Figure obtained from Petar et al. [26]
-
Building Inspection. Thermography is considered to be an excellent tool for diagnosing the state of buildings . Evaluation of insulation of different materials and/or the location of water leaks, and thus humidity, are specific uses of infrared thermography in this field (Fig. 1.8). One of the techniques used is the evaluation of heat flow, which consists of the generation of a thermal gradient between the inside and outside of the building. An example of this is that in the winter heaters heat the inside. Thus, through infrared thermography inspection from the outside of the building, it is possible to visualize whether there are hot areas. These hot areas are associated with heat transfer from inside to outside and therefore represent a problem with insulation in the walls or windows. If the whole outside surface of the building is a similar temperature, it means that the inside is properly isolated from the outside.
Fig. 1.8 
Examples of thermographies in the building inspection. Figures obtained from Fox et al. [27]
-
Gas detection industry. Infrared cameras are able to visualize gases in a specific range of the infrared spectra (Chap. 2). Because of this, using the appropriate camera, it is possible to visualize specific gases such as the ethanol, carbon dioxide, propanol or sulfur hexafluoride, among others. This provides interesting applications of infrared thermography in the industry (Fig. 1.9). Two of the main applications are: (1) to check whether factories are not producing toxic gases or if the levels of the gases expelled are adequate; and (2) to check if there are leaks in the structures to store or transport gas.
Fig. 1.9 
Thermography of the gas emission in a paper factory. Figure obtained from Sedlák et al. [28]


1.4 Infrared Thermography in Sport Science: Past and Present
In sport science , the studies using thermography started approximately 10 years after medicine. Furthermore, the first studies in sport science were related to its application in sport medicine.
The first study about thermography in sport science was in 1975 titled “Thermography in sport injuries and lesions of the locomotor system due to sport” by Keyl and Lenhart in the German journal Fortschritte der Medizin [29]. This study was written in German. In this study, the authors examined 82 patients and 50 athletes with different injuries. The main result of the study was the observation of hyperthermia in the injured area.
The next study in the field of the sport medicine was in February of 1977 and it was also performed by German authors and published in the German language. The study was titled “Skin-thermography with fluid crystals in orthopedics and sport-medicine” and it was performed by Lelik, Solymossy and Kézy and published in the journal Zeitschrift für Orthopädie und Unfallchirurgie [30]. Although we did not have the possibility to access to the paper, it is possible to show the English abstract: “Thermography with fluid crystals is an effective diagnostic aid for the differentiation between bacterial and non-bacterial inflammation i.e. for the differential diagnosis between joint damage due to overloading and irritative arthrosis. Thermography enables us to assess severity and extent of the condition and to prove the success of treatment.”
Just three months after the previous publication, the first study using infrared thermography in sport science in an English language by English authors was published in The Journal of Physiology. The study was titled “Skin temperature during running–a study using infra-red colour thermography.” and the authors were Clark and Mullan [31]. This study was not oriented to the medical application as the previous studies were and its objective was to assess the validity of skin temperature measurements under outdoor conditions. Two runners participated in the experiment. They ran for approximately 1 h and 15 min, one day in an outdoor track and another day in a climatic chamber. Measurements were performed before running and at 15-minute intervals during running, with an infrared thermography camera and thermocouples , in order to compare the data of both systems. In the climatic chamber, they also assessed the effect of the wind speed (no wind vs. 4.5 m s−1). Figure 1.10 shows examples of thermographies obtained in this study. They obtained the following results [31]:

Thermographies performed in the study of Clark et al. [31]
-
1.
They analyzed the body temperature distribution before running. They described that the body temperature distribution depended on the following factors: body composition (i.e., body structures or regions with a higher proportion of fat presented lower temperatures), cutaneous blood flow (related to the warming of the hands), sweat rate evaporation, and muscle role (i.e., higher skin temperatures were recorded in the regions of the active muscles).
-
2.
They observed a decrease in the skin temperature during running. Although this variation is different in each body region, an average value could be considered 5 °C. This decrease was associated with the sweat evaporation.
-
3.
They observed in the images that emissivity of the skin was not influenced by the presence of sweat.
-
4.
Similar temperatures before and during running were observed in the climatic chamber and in the outdoor track.
-
5.
Infrared thermography could underestimate areas near the side of the body, due to the curvature of the body.
-
6.
Thermography and thermocouples agreed, within 1.5 °C, on the mean skin temperature, but in specific regions could differ by 4 °C. The authors suggested that although thermography provides a more complete analysis, it is more expensive and consumes more time.
After observing the results and its discussion, it is interesting how this study from 1977 obtained results and discussed different topics that keep being topics of interest until the present such as the body temperature distribution [32–34], the effect of the sweat on skin emissivity [35, 36], and the differences between thermocouples and thermography [36–38], among others.
In order to know the trend of the number of publications performed in sport science using infrared thermography, we performed a search in two databases: PubMed (Medline) and ScienceDirect. The key words used in the online search included “thermography”, “thermovision” or “thermal imaging”, and “exercise” or “sport”. Boolean operators, ‘OR’ and ‘AND’ were used to combine within and between the search terms of the subject areas.
Figure 1.11 shows the result of this online search. This figure can be interpreted as showing a gradual increase in the number of publications. However, it is very easy to see that in recent years there has been a greater increase. In this sense, the number of publications in the first 5 years of this decade (2011–2015: 25 articles published in PubMed and 29 in ScienceDirect) is approximately the double that in the previous decade (2001–2010: 14 articles published in PubMed and 6 in ScienceDirect). The progressive increase in the number of studies using infrared thermography in sport science could be explained by some of the technique’s advantages. Infrared thermography is a non-invasive method that can be used at a distance, and does not interfere in human thermoregulation, unlike other skin measurement methods [3, 36, 37]. Additionally, this important increase in the number of studies in the last 5 years could be explained by the great decrease in the price of infrared cameras in the last years.

Number of papers published in PubMed (Medline) and ScienceDirect using infrared thermography in sport science
In addition to the number of publications, it is important to know in which fields or applications the studies were published, in order to understand which are the most important uses of infrared thermography in sports science. In this sense, we defined the following categories:
-
Thermophysiology: thermography studies focused on the assessment of human thermoregulation. All the studies that assessed the effect of exercise on skin temperature, the skin temperature distribution in relation to the sport or exercise, the differences in skin temperature between different groups (e.g., trained vs. untrained; young vs. old; woman vs. men), the effect of sport performance (e.g., VO2max on skin temperature), and so on, were included in this category.
-
Sports medicine: thermography studies related to the assessment of the effect of injury or disease in humans. In addition, this category included all studies that presented a clinical/medical perspective.
-
Animals and Sport: thermography studies conducted with animals that are involved in an exercise or a sport. Papers with a clinical perspective involving animals were also included in this category. In this sense, this category would include the previous two categories, but with an animal focus.
-
Clothing: thermography studies focused on the assessment of clothing in a specific sport or during exercise.
-
Methodology/developments: studies that investigated the methodological aspects of the infrared thermography and developments of the technique. Studies that compared infrared thermography with other techniques (e.g., thermocouples), analysis of the data, determination of the regions of interest, guidelines, and so on, were included in this category.
-
Reviews: reviews and overview papers about infrared thermography in sport science were included in this category.
Papers obtained in the online search in PubMed and ScienceDirect were categorized into the defined applications or fields (Fig. 1.12). During the approximately 40 years that infrared thermography has been used in sports science, the application that has been most used is sports medicine, representing 40% of the total number of papers. The second most commonly used application has been thermophysiology, with 31% of the total papers. In other application fields, the percentage of published articles is much smaller, but no less important, as will be shown in the different chapters of this book. It is important to comment that only papers that are focused on sports science were included in the methodology and review categories. If all studies related to infrared thermography in human assessment were included in these categories, without a focus on sport science, these sections would probably have the highest frequency of papers.

Percentage of the papers published using infrared thermography in sport science in the different applications or fields
Finally, the four most relevant papers that used infrared thermography in sport science will be presented (Table 1.1). Relevancy was defined as the papers that have been cited the most times. These publications are discussed below.
The paper of Hildebrandt et al. [3] is an overview of the technological advances of infrared thermography in sports medicine and its technical requirements. The paper also presents the physical principles of the technique and a study of the intra-examiner reproducibility of knee temperature. It is very interesting that this article presents case studies to illustrate the clinical applicability and limitations of infrared thermography in sport medicine. The relevancy of this study could be explained because it is a complete publication about the application of the thermography in sport medicine, which shows the principles and the methodology of the technique, and which is very illustrative with different images and examples that demonstrate the potential use of infrared thermography in this field (Fig. 1.13).

Example of an injury (anterior cruciate ligament rupture in the right knee) presented in the article of Hildebrandt [3]
The second most relevant is the publication of Clark et al. [31], which was previously commented upon. Although the main limitation of this study is that it was performed with only two participants, its strengths are: (1) it was the first study written in English with infrared thermography in sport science; (2) the study deals with different aspects such as the effect of wind, the comparison of infrared thermography with thermocouples, or the comparison between performing exercise in a laboratory or outdoors; and (3) the study discusses many aspects, from the temperature distribution to the effect of the curvature of the body or sweat on thermal data.
Another relevant piece of research was the study performed by Zontak et al. [39]. In this research, they had the objective of characterizing skin temperature response to exercise (bicycle ergometry) using infrared thermography. They decided to measure the skin temperature of the hand in 10 participants because this area has a high skin blood innervation, resulting in a high variation of the skin temperature due to exercise (Fig. 1.14a). Two experimental protocols were assessed, an incremental workload and a stable workload. In the incremental workload, they observed a decrease in skin temperature during all exercise; and in the stable workload, a decrease in the skin temperature was first observed with a posterior increase in the skin temperature in the middle of the test (Fig. 1.14b). The authors suggested that these results depend on the vasodilator/vasoconstrictor balance of the skin blood flow, which depends mainly on the blood requirements for the active muscles and the skin (heat loss requirements). This study is very interesting and relevant due to this discussion regarding the effect of the vasodilation and vasoconstriction on skin temperature.

a Example of hands thermographies from the study of Zontak et al. and b graphs of the skin temperature dynamics in their experiments. Figure adapted from the figures of Zontak et al. [39]
Finally, the fourth most cited study was the performed by Merla and colleagues in 2010, titled “Thermal Imaging of Cutaneous Temperature Modifications in Runners During Graded Exercise” [40]. In this study, they assessed the skin temperature dynamics of 15 participants during running an incremental test until maximal heart rate. They observed a decrease in skin temperature during all the incremental tests and an increment until basal values in the recovery (Fig. 1.15). Results were very similar to those of Zontak et al. [39]. The main strength of this study in relation to the previous studies was that they used the new generation of infrared thermography cameras, with a higher resolution and sensitivity. This study could probably be considered to be one of the first studies with this new generation of infrared cameras, which were more powerful and also cheaper. It may attract the attention of a lot of sport scientists in terms of the possibilities of the infrared camera in sport science.

Results obtained in the study of Merla et al. Figure obtained from Merla et al. [40]
These four studies provide a quick overview of the application of infrared thermography in sport science. More specifically, these studies are a good example of the two categories in sport science with the highest number of papers, as noted in Fig. 1.12: sport medicine and thermophysiology.
However, a question may be called to mind after this review: what is the most recent application of infrared thermography in sports science? To investigate this, we decided to discuss the last 5 studies published in PubMed (Table 1.2).
The first study to comment on is the publication of Fenner and colleagues, titled “The Effect of Noseband Tightening on Horses’ Behavior, Eye Temperature, and Cardiac Responses” [41]. In this study, the authors did not assess the horses in an exercise test, but rather the research was orientated to improve the equestrian sport . The aim of this study was to investigate the influence of noseband tightness on the physiology of horses. Infrared thermographic was used to measure eye temperature (Fig. 1.16). This analysis was performed because authors hypothesized that eye temperature may be related to the stress response of the horse, due to the possible relationship between eye temperature, heart rate and heart rate variability. Although the authors did not find correlations between these parameters, when the noseband was tightest, eye temperature was recorded at the maximum value, accompanied by an increase in heart rate and a decrease in heat rate variability, suggesting that this condition produced an acute stress. Authors suggested that this no correlation could be explained because eye temperature and cardiac responses do not arise at exactly the same time.

Example of an infrared image of the eye region of the study of Fenner et al. [41]. They assessed the maximum temperature of a cross located in the medial posterior palpebral border of the lower eyelid and the lacrimal caruncle
In the second publication of the recent studies that we are discussing, Gillis et al. analyzed the effect of long sleeve breathable shirts soaked in menthol and ethanol solutions on rectal temperature, skin temperature, thermal perception and perceived exertion during rest and exercise [42]. To assess this effect, the researchers experimented three different conditions: exercise with dry shirt (control condition), exercise with shirt soaked by menthol and ethanol, and shirt soaked with water. Infrared thermography measured the temperature of the chest and the back. Garments soaked in menthol and ethanol presented the highest increment in rectal temperature, with the highest decrease in skin temperature recorded on the chest, and with the coolest perception. Authors suggested that the application of menthol could result in skin vasoconstriction and therefore decrease and increase skin temperature and heat storage (rectal temperature), respectively.
The third publication of the recent studies that we are discussing is the work of Jensen and colleagues titled “Estimation of Energy Expenditure during Treadmill Exercise via Thermal Imaging”. In this research, they validate the application of infrared thermography in the measurement of energy expenditure during running [43]. They used the parameter thermal optical flow. Thermal optical flow was defined as optical flow (movement of entities) estimated in succeeding thermal images. In total, 14 recreational runners ran for intervals of 4 min at different velocities when heart rate, oxygen uptake, optical flow and accelerations of body segments were measured continuously. The authors obtained a good accuracy of infrared thermography in the estimation of energy expenditure. One of the most interesting aspects of this study is that the authors did not use infrared thermography to measure skin temperature. They used the technique to obtain a high contrast between the body and the background in order to improve the estimation of the movement, and then the optical flow.
In July 2016, Faustino-Rocha et al. published a paper that aimed to assess the effect of long-term exercise training on the growth and vascularization of mammary tumors in a rat model [44]. Mammary tumors were assessed in the rats using different techniques (e.g., ultrasonography and contrast-enhanced ultrasound), and one of these techniques was infrared thermography. Infrared thermography was used in this study to evaluate the vascularization and the extension of necrotic areas of the tumors . Authors expected that higher vascularized tumors are associated with less extensive necrotic areas and, consequently, higher maximum, minimum and mean temperature, and lower thermal amplitude (difference between maximum and minimum temperature). Although, they did not obtain statistically significant differences in the parameters evaluated, they commented that the tendency of the data supported the previous idea.
Finally, in the most recent research of the present discussion, Formenti and colleagues analyzed the skin temperature response to two types of resistance exercises, modulating the amount of skin blood flow [45]. The rationale of this study was that low intensity resistance training with slow movement and tonic force generation has been shown to create blood flow restriction within muscles and therefore may affect skin blood flow and skin temperature response. With this hypothesis, the authors investigated the effect of two speeds of squat exercise execution (normal speed, 1 s eccentric/1 s concentric phase, 1 s; slow speed, 5 s eccentric/5 s concentric phase, 5 s) at 50% of 1 maximal repetition on skin temperature dynamics using infrared thermography, in 13 physically active males. Infrared thermography measured the skin temperature of the quadriceps. The results of the study showed that slow speed execution changed skin temperature more slowly during the exercise, whereas skin temperature variation was similar for the two exercises (Fig. 1.17). Authors commented that these data suggest that low speed exercise mimics a condition of blood flow restriction within the muscle, affecting skin blood flow and skin temperature dynamics.

Examples of thermographies of one of the participants of the study of Formenti et al. at the two speed executions of the squat exercise. Figure modified from Formenti et al. [45]
It is interesting that in the discussion of the most relevant studies, these publications were mainly focused on sports medicine and thermophysiology. However, review of the most recent publications performed in sport science shows that there are new and different applications for infrared thermography, some of them related to other fields, such as the evaluation of additives in sports clothing [42], the assessment of equipment in equestrian sport [41], or the use of infrared thermography to measure other physiological variables such as energy expenditure [43].
1.5 Conclusions
Infrared thermography began with the discovery of infrared radiation in 1800 by Sir William Herschel, the development of infrared sensors between 1880 and 1917, and, subsequently, the development of the infrared cameras in the 1940s and 1950s. After this, the infrared thermography started to be used in human assessment and, more specifically, in medicine. It is possible to consider the 1970s as being the beginning of infrared thermography in sport science; since then, the number of publications has been gradually increasing with the number of studies published between 2011 and 2015 double the amount published in the whole previous decade. Almost of the research has been performed in two kinds of applications: sport medicine and thermophysiology. However, infrared thermography presents other possible applications such as the sport clothing assessment/design, studies conducted with animals that are involved in the sport science field, or the improvement of the technique and the analysis for the sport science, among others. In conclusion, the application of infrared thermography in sport science presents an interesting past, an important present application, and a more promising future application.
References
Jones BF (1998) A reappraisal of the use of infrared thermal image analysis in medicine. IEEE Trans Med Imaging 17:1019–1027. doi:10.1109/42.746635
Vardasca R, Simoes R (2013) Current issues in medical thermography. In: Topics in medical image processing and computational vision. Springer, Berlin, pp 223–237
Hildebrandt C, Raschner C, Ammer K (2010) An overview of recent application of medical infrared thermography in sports medicine in Austria. Sensors 10:4700–4715
Ng E-K (2009) A review of thermography as promising non-invasive detection modality for breast tumor. Int J Therm Sci 48:849–859
Herschel W (1800) Experiments on the Refrangibility of the Invisible Rays of the Sun. By William Herschel, LL. D.F.R.S. Philos Trans R Soc Lond 90:284–292
Ring EFJ (2006) The historical development of thermometry and thermal imaging in medicine. J Med Eng Technol 30:192–198. doi:10.1080/03091900600711332
Rogalski A (2002) Infrared detectors: an overview. Infrared Phys Technol 43:187–210
Ring FJ, Jones BF (2012) Historical development of thermometry and thermal imaging in medicine. In: Biomedical signals, imaging, and informatics. CRC Press. Taylor and Francis, Boca Ratón, EEUU, pp 2–1, 2–6
Lahiri BB, Bagavathiappan S, Jayakumar T, Philip J (2012) Medical applications of infrared thermography: a review. Infrared Phys Technol 55:221–235
Hardy JD (1934) The radaition of heat from the human body. J Clin Invest 13:615–620
Czerny M (1929) Über Photographie im Ultraroten. Z Für Phys 53:1–12. doi:10.1007/BF01339378
Ring EFJ, Ammer K (2000) The technique of infrared imaging in medicine. Thermol Int 10:7–14
Ammer K (2008) The Glamorgan Protocol for recording and evaluation of thermal images of the human body. Thermol Int 18:125–144
Skversky NJ, Herring AB, Baron RC (1964) Thermography in Peripheral Vascular Diseases. Ann NY Acad Sci 121:118–134. doi:10.1111/j.1749-6632.1964.tb13691.x
Birnbaum SJ, Kliot D (1964) Thermography—obstetrical applications. Ann NY Acad Sci 121:209–222. doi:10.1111/j.1749-6632.1964.tb13697.x
Marinacci AA (1965) Thermography in the detection of non-neurological imitators of peripheral nerve complexes; a preliminary report of ischemic (anoxic) neuropathy. Bull Los Angel Neurol Soc 30:1–11
Ring EFJ, Ammer K (2012) Infrared thermal imaging in medicine. Physiol Meas 33:R33–R46. doi:10.1088/0967-3334/33/3/R33
Lawson R (1956) Implications of surface temperatures in the diagnosis of breast cancer. Can Med Assoc J 75:309–310
Lawson R (1957) Thermography; a new tool in the investigation of breast lesions. Can Serv Med J 8:517
Vreugdenburg TD, Willis CD, Mundy L, Hiller JE (2013) A systematic review of elastography, electrical impedance scanning, and digital infrared thermography for breast cancer screening and diagnosis. Breast Cancer Res Treat 137:665–676
Silva LF, Santos AASMD, Bravo RS et al (2016) Hybrid analysis for indicating patients with breast cancer using temperature time series. Comput Methods Programs Biomed 130:142–153. doi:10.1016/j.cmpb.2016.03.002
Costello J, Stewart IB, Selfe J et al (2013) Use of thermal imaging in sports medicine research: a short report: short article. Int SportMed J 14:94–98
Hildebrandt C, Zeilberger K, Ring EFJ, Raschner C (2012) The application of medical infrared thermography in sports medicine. Ultrasound 10:2
Vollmer M, Möllmann K-P (2011) Infrared thermal imaging: fundamentals, research and applications. Wiley, Weinheim
McManus C, Tanure CB, Peripolli V et al (2016) Infrared thermography in animal production: an overview. Comput Electron Agric 123:10–16. doi:10.1016/j.compag.2016.01.027
Petar M, Dušan RG, Milun J et al (2013) An implementation of infrared thermography in maintenance plans within a world class manufacturing strategy. Therm Sci 17:977–987
Fox M, Coley D, Goodhew S, De Wilde P (2015) Time-lapse thermography for building defect detection. Energy Build 92:95–106. doi:10.1016/j.enbuild.2015.01.021
Sedlák D, Straško B, Janiga M (2015) Thermal imaging in analysis of local climate in industrialized area—exploring new methodology. Oecologia Mont 24:74–77
Keyl W, Lenhart P (1975) Thermography in sport injuries and lesions of the locomotor system due to sport. Fortschr Med 93:124–126
Lelik F, Solymossy O, Kézy G (1977) Skin-thermography with fluid crystals in orthopedics and sport-medicine (author’s transl). Z Für Orthop Ihre Grenzgeb 115:105–108
Clark RP, Mullan BJ, Pugh LG (1977) Skin temperature during running—a study using infra-red colour thermography. J Physiol 267:53–62
Fournet D, Ross L, Voelcker T et al (2013) Body mapping of thermoregulatory and perceptual responses of males and females running in the cold. J Therm Biol 38:339–344. doi:10.1016/j.jtherbio.2013.04.005
Chudecka M, Lubkowska A (2015) Thermal maps of young women and men. Infrared Phys Technol 69:81–87. doi:10.1016/j.infrared.2015.01.012
Priego Quesada JI, Lucas-Cuevas AG, Salvador Palmer R et al (2016) Definition of the thermographic regions of interest in cycling by using a factor analysis. Infrared Phys Technol 75:180–186. doi:10.1016/j.infrared.2016.01.014
Ammer K (2009) Does neuromuscular thermography record nothing else but an infrared sympathetic skin response? Thermol Int 19:107–108
Priego Quesada JI, Martínez Guillamón N, Ortiz Cibrián, de Anda RM et al (2015) Effect of perspiration on skin temperature measurements by infrared thermography and contact thermometry during aerobic cycling. Infrared Phys Technol 72:68–76. doi:10.1016/j.infrared.2015.07.008
de Andrade Fernandes A, dos Santos Amorim PR, Brito CJ et al (2014) Measuring skin temperature before, during and after exercise: a comparison of thermocouples and infrared thermography. Physiol Meas 35:189
James CA, Richardson AJ, Watt PW, Maxwell NS (2014) Reliability and validity of skin temperature measurement by telemetry thermistors and a thermal camera during exercise in the heat. J Therm Biol 45:141–149. doi:10.1016/j.jtherbio.2014.08.010
Zontak A, Sideman S, Verbitsky O, Beyar R (1998) Dynamic thermography: analysis of hand temperature during exercise. Ann Biomed Eng 26:988–993
Merla A, Mattei PA, Di Donato L, Romani GL (2010) Thermal imaging of cutaneous temperature modifications in runners during graded exercise. Ann Biomed Eng 38:158–163. doi:10.1007/s10439-009-9809-8
Fenner K, Yoon S, White P et al (2016) The effect of noseband tightening on horses’ behavior, eye temperature, and cardiac responses. PLoS ONE 11:e0154179. doi:10.1371/journal.pone.0154179
Gillis DJ, Barwood MJ, Newton PS et al (2016) The influence of a menthol and ethanol soaked garment on human temperature regulation and perception during exercise and rest in warm, humid conditions. J Therm Biol 58:99–105. doi:10.1016/j.jtherbio.2016.04.009
Jensen MM, Poulsen MK, Alldieck T et al (2016) Estimation of energy expenditure during treadmill exercise via thermal imaging. Med Sci Sports Exerc. doi:10.1249/MSS.0000000000001013
Faustino-Rocha AI, Silva A, Gabriel J et al (2016) Long-term exercise training as a modulator of mammary cancer vascularization. Biomed Pharmacother 81:273–280. doi:10.1016/j.biopha.2016.04.030
Formenti D, Ludwig N, Trecroci A et al (2016) Dynamics of thermographic skin temperature response during squat exercise at two different speeds. J Therm Biol 59:58–63. doi:10.1016/j.jtherbio.2016.04.013
Author information
Authors and Affiliations
Corresponding author
Editor information
Editors and Affiliations
Rights and permissions
Copyright information
© 2017 Springer International Publishing AG
About this chapter
Cite this chapter
Priego Quesada, J.I., Cibrián Ortiz de Anda, R.M., Pérez-Soriano, P., Salvador Palmer, R. (2017). Introduction: Historical Perspective of Infrared Thermography and Its Application in Sport Science. In: Priego Quesada, J. (eds) Application of Infrared Thermography in Sports Science. Biological and Medical Physics, Biomedical Engineering. Springer, Cham. https://doi.org/10.1007/978-3-319-47410-6_1
Download citation
DOI: https://doi.org/10.1007/978-3-319-47410-6_1
Published:
Publisher Name: Springer, Cham
Print ISBN: 978-3-319-47409-0
Online ISBN: 978-3-319-47410-6
eBook Packages: Physics and AstronomyPhysics and Astronomy (R0)