
Abstract
Geotechnical engineers are playing an important role in designing and constructing environmental control measures at waste disposal sites by providing ground water protection measures, by capturing green house gas emissions and by ensuring stability of slopes. This paper presents an amalgamation of research findings and field applications of work done by the author and associated researchers over the past two decades in the area of environmental geotechnology. These findings and applications are related to (a) evaluation of groundwater hazard rating for municipal solid waste (MSW) landfills, (b) closure of high MSW waste dumps, (c) important lessons for landfill design and construction, (d) costing of landfills, (e) closure of tailings ponds and (f) incremental raising of height of embankments of ash ponds.
Introduction
Uncontrolled disposal of waste on land leads to a number of environmental hazards, the most significant of which are ground water contamination, green house gas emissions and slope instability. Severe shortage of land area for disposal of solid waste has led to staggering increase in height of waste dumps at many locations, with final elevations often reaching 30–50 m above ground level. Accumulation of such large quantities of waste has escalated the environmental hazards at such sites, be they of MSW, hazardous solid waste or slurry deposited waste such as coal ash or mine tailings.
Geotechnical engineers are playing an important role in designing environmental control measures at waste disposal sites to mitigate the hazards by providing liners, covers, slope stability systems as well as leachate and gas collection systems. The role of geotechnology in environmental control is highlighted through six studies presented hereafter, on the following aspects: (a) evaluation of groundwater hazard rating for MSW landfills, (b) closure of high MSW waste dumps, (c) important lessons for landfill design and construction, (d) costing of landfills, (e) closure of tailings ponds and (f) incremental raising of height of embankments of ash ponds.
Prioritizing MSW Landfill Closure: New Ground Water Hazard Rating System (HARAS)
Background
Growing concerns about degrading groundwater quality call for taking appropriate remedial measures at polluting landfill sites. To minimize groundwater contamination from such sites, control measures like impermeable covers and vertical cut-offs or remediation actions such as site clean-up are necessary. However, due to financial constraints, such control and remedial measures cannot be taken at all sites simultaneously. Therefore, landfill sites need to be prioritized according to the relative degree of groundwater hazard posed by them, so that necessary control and remedial measures can be undertaken in a phased manner. This helps in identifying highly polluting sites requiring emergent action. A system that evaluates groundwater contamination hazard of landfill sites on a relative scale is helpful in prioritizing landfill closure.
Numerous models and approaches ranging from deterministic water balance analyses such as Hydrologic Evaluation of Landfill Performance (HELP) [52] and Flow Investigation of Landfill Leachate (FILL) [23], and stochastic simulation models such as LandSim [15] and EPA’s Composite Model for Leachate Migration with Transformation Products (EPACMTP) [60] to relative hazard assessment systems for evaluating landfill hazards have been developed across the world. Each one of these models and approaches has some advantages and disadvantages. While deterministic and stochastic models need large amounts of data, involve complex analytical procedures and thus are time consuming, relative hazard assessment systems, often referred to as hazard rating/ranking systems, suffer from the subjectivity involved in their scoring methodologies. However, considering their simplicity, such relative hazard assessment systems are considered to be more suitable particularly when priority setting is the sole objective.
Most of relative hazard assessment systems are based on structured-value approach. A structured-value approach [39] incorporates in a mathematical framework the major input parameters that determine impacts and risk, but it does so in a heuristic manner. Field data and qualitative judgment are used to assign scores for different levels of the input parameters, and these scores are combined mathematically to obtain an overall score for a particular potential impact.
In this section, first a brief description of existing landfill hazard rating systems has been given and then a new groundwater contamination HAzard RAting System (HARAS) for landfills, which has been reported in detail elsewhere [55], is briefly discussed. The new system is then applied to eight Indian and three European landfills.
Description of Existing Landfill Hazard Rating Systems
A landfill hazard rating system evaluates landfill hazards on a relative scale for one or more of the three hazard modes: (1) migration of pollutants away from the site via groundwater, surface water, or air routes, or a combination thereof, (2) fire and explosion potential, and (3) direct contact with hazardous substances. Site ranking is usually based either on the combined score for various routes under migration mode or the score for the dominant route, i.e., the route returning the highest score. For computing score for a hazard mode or a hazard migration route, the parameters describing such hazard mode or migration route are assigned numerical scores based on field data and qualitative judgment, and then the parameter scores are combined by an aggregative algorithm.
In a landfill hazard rating system, three components namely source, pathway, and receptor are evaluated, separately or as a combination. In case of groundwater contamination hazard of a landfill, i.e., landfill hazard via groundwater route, the source refers to the candidate landfill and is characterized by the parameters that govern the amount and potency (toxicity) of waste contaminants to be potentially released from the fill to the sub-surface. A pathway refers to the course a contaminant takes while migrating from source to receptor, and is described by various characteristics that govern the contaminant transport within the pathway. The receptors include the groundwater users such as human beings, livestock, crops, and sensitive environment present in the vicinity of the landfill. Thus, the parameters employed by a landfill hazard rating system broadly fall into three categories—source, pathway, and receptor. The final site score for a hazard migration route is obtained by combining various parameters of the site by an aggregative algorithm. The aggregative algorithms that are most commonly used in site hazard rating systems are additive, additive-multiplicative, and multiplicative. A detailed review of various groundwater contamination hazard rating systems for landfills has been reported by Singh et al. [56]. A brief summary of some important hazard rating systems, indicating various hazard modes/migration routes, number of groundwater route parameters, and aggregative algorithms considered in each system, is presented in Table 1.
Table 1 shows that each of existing systems evaluates waste sites for one or more hazard migration route(s), necessarily including groundwater. While some of these systems evaluate each route independently and thus produce separate scores for the individual routes, other systems produce only one composite score for all the routes. While LeGrand’s method and DRASTIC evaluate site hazard for groundwater route alone, the systems such as HRS-1982, HRS-1990, WARM, DPM, NCAPS, ISM, ERPHRS, RSS, and RASCL evaluate 3–4 hazard migration routes, each one separately, and produce separate scores for all the routes. The other systems such as SRAP, NCS, HR-FCP, NPC system, and JENV system evaluate various routes concurrently and produce a composite score for all the routes. However, in the case of NCS, NPC system and JENV system which employ additive algorithm to aggregate their respective parameters into the final score, it is easier to segregate groundwater route parameters from the other parameters and determine separate score for the groundwater route. This is however, not possible in the case of HR-FCP system that uses a complex algorithm to aggregate its parameters.
Most of the existing hazard rating systems mentioned in Table 1 are primarily meant for evaluating hazardous waste (HW) sites; however, some of these can be applied to both HW and MSW sites, and a few to MSW sites only. Soil-Waste Interaction Matrix, HRS-1982, HRS-1990, SRAP, WARM, DPM, NCAPS and ISM perform well when applied to HW sites; whereas NCS, HR-FCP, ERPHRS, RSS, RASCL, and NPC system can evaluate both HW and MSW sites, and JENV system is more suitable for MSW sites. LeGrand’s method and DRASTIC do not take into consideration the type of waste as such these are of limited use for waste site hazard assessment.
A Brief Overview of the New System
A new system, HARAS, based on source-pathway-receptor relationships evaluates groundwater contamination hazard rating (GCHR) of landfill sites on a relative scale of 0–1,000 has been reported by Singh et al. [55]. The GCHR of a landfill site as evaluated by this new system is given by the following relationship:
where, H S is source hazard rating factor, H P is pathway hazard rating factor, and H R is receptor hazard rating factor.
The source hazard rating factor H S is a combined measure of the amount and potency of the contaminants contained in a landfill and the potential for their leaching out from the fill. While the amount of contaminants will be directly proportional to the waste quantity at a site, the potency of contaminants will depend on the composition of the waste. The potential for leach-out of contaminants from a fill will depend on the amount of precipitation that will infiltrate into the waste. As the infiltrating precipitation percolates down the waste, it acts as a driving force to move out the contaminants from the fill; as such a higher precipitation will indicate a greater potential for the leach-out of the waste contaminants. The fraction of precipitation that will infiltrate into the waste will be decided by the landfill cover quality. The source hazard rating factor is thus a function of a waste quantity indicator, a waste composition indicator and an infiltrating precipitating indicator.
The waste contaminants carried by the infiltrating rainwater, and released from a landfill, move through the base liner (if any), vadose zone, and aquifer zone, before they reach a recipient groundwater well. While the base liner acts as a physical barrier to the release of contaminants from the fill, the vadose zone acts as a retarder and reduces the contaminant loading along the pathway by way of attenuation. As such, the contaminant loading within a pathway medium decreases as the contaminants move away from the source towards the receptors, i.e., the contaminant loading reaching the recipient groundwater well will be lower than that leaving the source. The decrease in the loading along the pathway will depend on the characteristics of the pathway media. The pathway hazard rating factor H P is a function of a containment indicator, a vadose zone indicator and a aquifer indicator.
The receptor hazard rating factor H R is equal to the summation of the indicators for sub-soil/groundwater, and various groundwater user categories (e.g., human population, livestock, crops, and sensitive environment).
The system parameters dealing with the source, pathway, and receptor have been identified based on literature and expert opinions. To select the system parameters and decide their relative importance weights; first, some parameters were identified based on literature. Subsequently, a questionnaire indicating the identified parameters was sent to a panel of over 100 experts consisting of academicians, field engineers, consultants, and regulators drawn from different parts of the world. The panelists were requested to add any other parameter(s) if felt so, and then rate all the parameters on a scale of 0–10. A rating of ‘0’ indicated that the parameter was not important at all, hence should not be considered, whereas the rating of 10 was to be assigned to the most important parameter. A total of 66 responses, mostly from India, US, and European countries, for various categories or groups (within a category) of parameters were received. Based on these responses, the final input parameters of the system were decided.
The Delphi technique [48] was used to derive the relative importance weights of the group parameters within a category. Only those group parameters that are aggregated by an additive algorithm were assigned relative importance weights. Each selected input parameter was assigned best and worst values based on design standards, data survey, case studies, and expert opinions. The best and worst values of a parameter correspond to its significantly low and significantly high impact on a site’s potential for groundwater contamination, in comparison with other values, and not the ones corresponding to the parameter’s minimum or maximum possible impact.
Based on qualitative judgment, the system parameters were assigned numerical scores individually or in groups of two or more parameters, for different parameter levels between the best and worst values. A numerical score assigned to a particular value of a parameter indicates its relative impact on the site’s potential for groundwater contamination, in comparison with other values. Hence, the worst value of a parameter is assigned the highest score and the best value the lowest. The range of a parameter score, i.e., the variation in score from minimum to maximum, reflects the importance of that parameter in terms of its impact on groundwater contamination, with the wider range indicating greater importance of the parameter.
To assign scores to the different levels of various parameters, first an arbitrarily chosen number, normally as 1, 10 or 100, was selected as the score corresponding to the worst value(s) of a parameter or a group of parameters, and then based on the estimated minimum impact of the parameter or group of parameters on site hazard, the score corresponding to the best value(s) was decided. The scores to the intermediate values of a parameter were assigned using linear or log-linear interpolations.
Case Studies of Indian MSW Landfills
The new system (HARAS) has been applied to determine groundwater contamination hazard of eleven MSW landfills—eight Indian landfills located in five cities namely Delhi, Chennai, Nagpur, Ahmedabad, and Kolkata, and three European landfills located in Denmark and Spain. The data pertaining to these landfills have been obtained from available literature and through site visits. The results produced by the new system have been compared with those produced by six existing hazard rating systems namely HRS-1990, ERPHRS, RSS, NCS, NPC system and JENV system.
Delhi Landfills
Delhi has a population of approximately 14.3 million and produces about 7,000 t of MSW per day. The entire MSW of the city is disposed into three landfills namely Ghazipur, Okhla and Bhalswa. All the three landfills are unregulated and do not have any covers and liners. The Ghazipur landfill started in year 1984 and still in use, is spread over an area of approximately 30 ha (3 × 10⁵ m2). It receives about 2,200 t of waste daily and its wastefill depth/height varies from 12 to 20 m [35]. The Okhla landfill which was started in year 1994 covers an area of 16.2 ha (1.62 × 10⁵ m2) and has the wastefill depth/height varying from 3 to 20 m [27]. The Bhalswa dumpsite has been in use since year 1993 and covers an area of 21 ha (2.1 × 10⁵ m2). Its wastefill depth/height is estimated to vary from 10 to 20 m.
The MSW of Delhi consists of about 60 % of biodegradable waste, 16 % of C&DW and 15.5 % of recyclable waste [8, 45]. The possibility of dumping of industrial HW illegally into these waste dumps cannot be ruled out, as there are a number of HW producing industries in the vicinity of these sites. There is no HW landfill developed in the region.
The city of Delhi receives an average annual rainfall of 721 mm [28]. The groundwater level of the city varies from 12 to 20 m deep. As regards the type of soils in the dumpsite locations, the soils of Delhi area are mostly alluvial silts, sandy silts and silty sand. The groundwater occurs in sandy to silty layers of alluvial sediments and also in the jointed quartzite having secondary permeability under unconfined conditions [47]. The semi-confined aquifer zones are present below 150 m depth. The permeability of aquifer varies from 0.5 to 8 m/day (5.8 × 10⁻⁶–9.2 × 10⁻⁵ m/s). The hydraulic gradient is gentle and is order of 1.8–2 m/km.
All the three sites have habitations within a distance of 500 m. A sizeable number of inhabitants have installed hand pumps and use groundwater as an alternate source for drinking water.
Bhandewadi Landfill, Nagpur
Nagpur city, having a population of 2.42 million generates approximately 564 t of MSW per day. A substantial part of the waste is dumped into Bhandewadi landfill located about 12 km east of Nagpur. The landfill is spread over an area of approximately 22 ha (2.2 × 10⁵ m2) with the waste distributed at heights ranging from 1 to 2.5 m [20]. The site has been in operation since 1973. The city’s waste consists of 47.41 % of biodegradables and 15.53 % of recyclables. The region is characterized by the granitic gneiss of archean age. The top soil cover is predominantly clay, and is underlain by granitic gneiss [42]. The site has newly constructed houses around it.
The city area receives an annual rainfall of approximately 1,050 mm. The aquifer is unconfined and water table varies from 3 to 15 m [43]. The water table in the immediate downstream of the landfill site is shallow and it is approximately 3–4 m below ground level. The fractured rocks (8–15 m) underneath the top soil constitute the aquifer. The groundwater flow direction follows the topography gradient. In the absence of surface water sources, the inhabitants are dependent only on the groundwater sources. The region on the eastern fringe of the landfill site is used for agricultural purposes. Due to low to moderate depth of water table, dug wells and hand pumps have been constructed for extraction of groundwater.
Chennai Landfills
Chennai city has a population of about 4.34 million and generates approximately 3,000 t of MSW everyday. The entire waste is dumped into two landfill sites namely Perungudi Dumping Ground (PDG) and Kodungaiyur Dumping Ground (KDG). The area of PDG is about 20 ha (2 × 10⁵ m2) and that of KDG is 55 ha (5.5 × 10⁵ m2) and the height of the waste fills in both the sites is 3 m [22]. The city’s solid waste contains 41 % of biodegradables and 16 % of recyclables [8].
The city receives an annual rainfall of 1,200 mm. The groundwater depth at PDG site is 2–10 m and at KDG site it is 4–6 m. The top soil is predominantly clay and the soil permeability is of order of 1 × 10⁻⁹ m/s. The groundwater is extracted for domestic use to augment the city water supply. In most places the local requirement is met only by shallow dug and open wells.
Ahmedabad Landfill
Ahmedabad has a population of about 3.7 million. The city generates approximately 1,300 t of MSW per day. A major part of the total waste is dumped into Pirana landfill. The landfill is spread over an area of 84 ha (8.4 × 10⁵ m2) and has an estimated average wastefill height of 5 m. The site has been receiving the waste for last 30 years. As per CPCB website [8], approximately 41 % of city’s solid waste consists of biodegradables and 12 % of recyclables.
The Ahmedabad city receives annual rainfall of 803 mm. The city is underlain by thick alluvial deposits of Quaternary age. The alluvium comprises of alternating beds of sand silt, clay and gravel. The groundwater depth in the city ranges from 20 to 50 m. The aquifer thickness and permeability in the region is 18.3 m and 115 m/day (1.33 × 10⁻³ m/s) respectively [46]. The hydraulic gradient of aquifer is assumed as 0.5 m/km.
Kolkata Landfill
Kolkata has a population of about 45.8 million. The estimated MSW generation in the city is about 2,920 t/day [18]. More than 95 % of the total waste generated is disposed at Dhapa landfill and the rest at Garden reach dumping ground. The Dhapa landfill site has been active for last 35 years. It is spread over an area of about 25 ha (2.5 × 10⁵ m2) and has wastefill height of 17 m [26]. The city’s waste contains 51 % biodegradables and 12 % recyclables. The C&DW is about 17 % of the total waste.
The city receives an annual rainfall of 1,650 mm. The sub-surface geology of the area is completely blanketed by the Quaternary fluviatile sediments comprising a succession of clay, silty clay, sand and sand mixed with occasional gravel [50]. The Quaternary aquifer is sandwiched between top 40 m thick clay layer and Tertiary clay existing at an average depth of 296 m [5, 50]. The top clay layer is underlain by a sequence of fine to coarse sand horizons mixed occasionally with gravel. The aquifer is often silty and micaceous. The hydraulic gradient in the area is about 1 m/km [37]. The groundwater is used both for drinking as well agriculture purposes. The dug wells and hand pumps are constructed for extraction of groundwater in the vicinity of the site.
Comparison of Indian MSW Landfills
The site parameters for various MSW dumpsites are indicated in Table 2 and the site scores produced by the new system and the existing hazard rating systems are indicated in Table 3.
It is seen from Table 3 that the new system accords highest priority to Ghazipur (Delhi) landfill followed Dhapa (Kolkata), Bhalswa (Delhi), Pirana (Ahmedabad), Okhla (Delhi), KDG (Chennai), PDG (Chennai), and Bhandewadi (Nagpur) in that order. The site hazard scores produced by the new system show that the Ghazipur and Dhapa landfills pose highest groundwater contamination hazard and therefore, are in urgent need of control and remedial measures. The higher GCHR of these two landfills can be attributed to large sizes of the landfills, high permeability of Delhi soil, and high annual rainfall in Kolkata region. The low hazard ratings of PDG (Chennai) and Bhandewadi landfill can be attributed small sizes of the landfills and low permeability of Chennai and Nagpur soils.
Among the existing systems, HRS-1990 accords highest and equal priority to the Ghazipur, Okhla, Bhalswa and Pirana landfills, ERPHRS to the Ghazipur, Okhla, and Bhalswa landfills, RSS and NCS to the Pirana landfill, NPC system to the Bhandewadi, KDG, and PDG landfills, and JENV system to the Ghazipur landfill. It is observed that each of the existing hazard rating systems assigns same priority rank to more than one landfill site, which makes decision-making difficult.
Table 3 further shows that in comparison with the existing hazard rating systems, which produce clustered scores for various landfills, the new system produces scores in much wider range and the scores differ significantly from one landfill to another. The HRS-1990 reports similar scores to the Ghazipur, Okhla, and Bhalswa landfills and also to the KDG and PDG sites. ERPHRS also produces one same score to the three Delhi landfills, i.e., Ghazipur, Okhla, and Bhalswa landfills, and another same score to KDG, PDG, Bhandewadi and Pirana landfills. The RSS, which produces the widest range of scores among the existing systems, also reports one same score to the Ghazipur, Okhla, Bhalswa and Bhandewadi landfills and another same score to KDG and PDG sites. This clustering of score is also observed in case the of NCS and NPC system. The clustering behavior can be attributed to the lack of sensitivity of the existing systems to different site parameters. In the case of the JENV system, though the scores vary for all the sites but the range of score is narrowest among all the systems.
Case Studies of European MSW Landfills
The new system is also applied to three European MSW landfills namely Grindsted and Kastrup landfills in Denmark, and La Mina landfill in Spain. The details of the three landfills are described below:
Grindsted Landfill, Denmark
There are two landfills in Grindsted town, an old landfill and a new landfill. The old Grindsted landfill was closed in 1977 after that new landfill was started. The new landfill started in 1977 is still in operation. The proposed and existing systems have been applied to new landfill only. As the two landfills are not too far from each other, some geohydrological data reported for the old landfill has been used for the new landfill also.
Grindsted landfill is located on a glacial outwash plain in the middle of Jutland in Denmark. Presently, the covered waste area is 9 ha (9 × 10⁴ m2) and the total area to be covered by the landfill is 16 ha (1.6 × 10⁵ m2). The entire waste area is divided into four sections. First section is already completed and closed. The second section is under operation but close to completion. The third and fourth sections are meant for future use. The site has been in operation for last 30 years and the balance area is sufficient for another 30–40 years. The wastefill thickness varies from 1 m at periphery to 29 m in the middle. The waste being received at landfill is a mixed waste predominantly comprised of demolition waste, asbestos, and road sweepings. As the organic waste is segregated from the waste for composting, the waste reaching the landfill consists of only a small amount of biodegradable waste.
The Grindsted town receives an annual rainfall of 900 mm. The water table is just 0.25–3 m below the ground level. The aquifer around the landfill area is 10–12 m thick with lower boundary of miocene silt and clay [24]. The aquifer consists of two sandy layers: 5–7 m of glaciofluvial sand overlying a micaceous sand with a thickness of approximately 4–6 m [2]. As the geometric mean of hydraulic conductivity of the glaciofluvial sand is 4.6 × 10⁻⁴ m/s and of micaceous sand is 0.9 × 10⁻⁴ m/s [19], the average aquifer permeability can be worked out as 2.8 × 10⁻⁴ m/s. The groundwater gradient is 0.0012 [2].
The aquifer below the landfill is being used as source of municipal water supply. The drinking water well is about 500 m from the landfill. Another well being used for irrigation purpose is about 250 m away.
Kastrup Landfill, Denmark
Kastrup landfill is Denmark’s first controlled landfill for mixed municipal and industrial waste. The landfill is located near the town of Skive in the northern part of the country. Started in 1976, the landfill covers an area of about 15 ha (1.5 × 10⁵ m2). It is divided into four sections, with three sections being used for waste deposition and one for mechanical separation facility and composting. A new cell covering an area of 0.5 ha (5,000 m2) is in operation. For the purpose of the present study, only the completed part of landfill measuring 15 ha (1.5 × 10⁵ m2) has been considered. The total height of landfill is about 35 m. The waste received at the landfill is a mixed waste having considerable amount of HW. The landfill has no base liner. The landfill leachate is collected and pumped to Skive wastewater treatment plant for purification.
Kastrup landfill area receives an annual rainfall of about 600 mm. The landfill is constructed on a natural clay formation approximately 6 m thick [41], which functions as a bottom barrier for landfill, preventing leachate from entering the groundwater. The aquifer is unconfined extending to a depth more than 50 m. Data pertaining to aquifer permeability was not available; however, considering the clayey subsurface strata, the aquifer permeability has been assumed suitably.
La Mina Landfill, Spain
La Mina landfill is located 2 km north of Marbella, Spain. It started operating in 1975 and was closed in 1999. The area of the landfill is 5.5 ha (55,000 m2) with waste fill height of 12 m. The La Mina landfill contains typical urban solid waste, composed of organic matter, paper, glass, wood and building waste [61]. The waste is covered with clay and sand. There is no base liner in the landfill.
The landfill area receives an annual rainfall of 850 mm. Geologically, the landfill is situated in the southern part of the Sierra Blanca, on the marbles which form part of the aquifer system of Marbella. The depth to water table is approximately 130 m and the aquifer thickness is approximately 450 m. The hydraulic gradient of groundwater is 3.5 %. Though a groundwater well is located at a distance of about 500 m, but no use of groundwater was reported.
Comparison of European MSW Landfills
The site characteristics of the three European landfills and the site scores produced by different systems are summarized in Tables 4 and 5 respectively.
It is observed from Table 5 that as per the new system, the Kastrup landfill poses highest groundwater contamination hazard among the European landfills. This is primarily due to larger size of the Kastrup landfill and a considerable amount of HW being disposed into it. The site hazard ratings produced by the new system for the three landfills indicate that none of these is in urgent need of remedial measures. Table 5 further shows that the different hazard rating systems produce different priorities, that is, the site ranking varies from system to system. Among the existing systems, each of NCS, NPC system, and JENV system produces clustered scores for the three landfills. HRS-1990 produces similar scores to the Grindsted and Kastrup landfills, whereas ERPHRS produces very low scores for all the three landfills falling in a narrow range of 0–20.
It is also seen from Table 5 that in comparison to the hazard scores for the Indian landfills (Table 3), the scores for European landfills are considerably lower. This mainly because of the Indian landfills being unlined and larger in size than the European landfills. Among various systems under comparison, the new system, HRS-1990, RSS, and ERPHRS show greater difference in the scores for the two sets of landfills (Indian and European), whereas the scores reported by the NCS, NPC system, and JENV system for the two do not show much difference. This is because the NCS, NPC, and JENV system employ additive algorithm for aggregating their parameters by virtue of which these do not respond significantly to varied site conditions [56].
Findings of the Study on GW Hazard Rating
A new system (HARAS) for evaluation of groundwater contamination potential of landfills has been discussed. The new system is based on structured-value approach and evaluates landfill sites relative to one-another. The system has been applied to eight existing Indian landfills and three European landfills and the results have been compared with those of six existing hazard rating systems namely HRS-1990, ERPHRS, RSS, NCS, NPC system, and JENV system. The study reveals the following:
-
(i)
The order of priority generated by the new system for remedial action for the Indian landfills is—Ghazipur (Delhi), Dhapa (Kolkata), Bhalswa (Delhi), Pirana (Ahmedabad), Okhla (Delhi), KDG (Chennai), PDG (Chennai), and Bhandewadi (Nagpur), thus the Ghazipur (Delhi) landfill being accorded highest priority and the Bhandewadi (Nagpur) landfill the lowest. The site hazard scores produced by the new system shows that the Ghazipur and Dhapa landfills are in urgent need of remedial measures.
-
(ii)
The GCHR of the Indian landfills are higher than those of the European landfills. This is mainly due to the former being larger in size and having no cover and liner system. The European landfills have engineered covers and liners.
-
(iii)
In case of Indian landfills, whereas the new system produces significantly differing scores for all the landfills, each of the existing hazard rating systems produces clustered scores. This shows that in comparison of the existing systems, the new system responds better to varied site conditions.
-
(iv)
The comparison scores for the Indian and European landfills shows whereas the new system, HRS-1990, ERPHRS, and RSS produce significantly different scores for the two sets of landfills, the scores produced by the NCS, NPC system, and JENV system do not differ much for the two cases. This shows that the systems that employ additive algorithm to aggregate their parameters are less sensitive to varied site conditions as compared to those employing multiplicative or additive-multiplicative algorithm.
-
(v)
In comparison with the existing hazard rating systems, which assign same priority rank to more than one landfill site, the new system generates distinctly differing priorities for all the landfills. This shows that the new system improves the decision making in site prioritization.
Stability of Cover Systems for High MSW Waste Dumps
Background
As per the guidelines issued by the regulatory authorities in India [6, 7, 36], the cover and liner configurations for landfills, are shown in Figs. 1 and 2 for MSW and HW respectively. The cover system for a MSW landfill has five components as shown in Fig. 1, including a single barrier of 0.6 m thick compacted clay.

Components of MSW landfill. C.C.L. compacted clay layer, D.L. drainage layer, G.C. gas collection layer, S.S. sub soil, G.M. geomembrane, V.G. vegetation, T.S. top soil, L.C. leachate collection layer

Components of HW landfill. C.C.L. compacted clay layer, D.L. drainage layer, G.C. gas collection layer, S.S. sub soil, G.M. geomembrane, V.G. vegetation, T.S. top soil, L.C. leachate collection layer
A HW landfill cover comprises of the same five components but includes a geomembrane as the sixth component, which is a part of a composite barrier as shown in Fig. 2.
No guidelines relating to cover systems for the closure of old waste dumps have been issued by regulatory authorities. The cover systems are expected to be similar to or more stringent than those adopted for new landfills because old waste dumps do not have a liner system at the base [10].
Old waste dumps have steep side slopes along which cover systems are to be installed. The presence of multiple layers in the cover system gives rise to the phenomenon of slippage at the interface of various layers along sloping sides. The interface between the geomembrane and the layer above it, as well as the layer beneath it, are the two critical locations, which govern slope stability.
One case study is presented which highlights the need to take great care in arriving at safe slopes for covers of waste dumps. The factors affecting the stability of cover systems along the slope are discussed.
Closure of an Old Waste Dump
An old MSW dump occupied an area of 400 m × 500 m (approximately) in the suburb of a metropolitan city in western India. The waste height was 18 m above the ground level (Fig. 3). On the northern side, the dump protruded into a creek where the waste has been pushed forward to a depth of a few meters below the water level. On the eastern side, a few buildings were close by and on the southern side, a road ran parallel to the boundary at some distance away from the perimeter [11].

Landfill with re-profiled slope and cover. a North south section with re-profiled slope and b east west section with re-profiled slope
Waste filling activities continued on top of the dump by the ‘tipping forward’ method and at many locations the slope of the waste along the side is of the order of 1:1 (horizontal:vertical).
Uncontrolled gaseous emissions and foul odor emanated from the top of the waste dump. The base of the dump sloped towards the creek and dark colored leachate flowed along the base into the creek. Site investigations revealed that the waste dump was underlain by clay followed by bedrock (Fig. 3). From a long-term perspective, after closure, it was considered desirable that the waste dump must be stable, give an aesthetically pleasing appearance and have no harmful impact on the adjacent environment. This implied that the sides of the dump must be made stable such that the factor of safety against slope instability was of the order of 1.5. It would be provided with a cover capable of supporting vegetative growth. The harmful impact of the leachate on the aquatic life in the creek was to be minimized by reducing the infiltration and by collecting and treating the leachate. Further, the problem of foul odor and the green house gas emissions would be minimized by collecting and flaring or utilizing the landfill gas. Provision of an impermeable cover system along with a gas collection system was considered to be a suitable control measure to reduce the harmful impact on the environment. A cover system similar to that used for HW landfills (Fig. 2) was proposed as presence of geomembrane above the compacted clay prevents loss of landfill gas and facilitates efficient collection of gas. Such a cover system was to be checked for stability along the side slopes.
A simple method for stabilization of the steep side slopes is to re-profile and re-grade them to a gentle slope. Such gentle slopes have adequate safety against interfacial sliding of components of the cover material over the waste. Re-profiling involves filling or excavating and re-locating the waste as shown in Figs. 3 and 4, resulting in an increase in the height of waste to about 22 m. Figure 4 shows how availability of space adjacent to the toe influences the adoption of this solution. Wherever space is available beyond the toe of the landfill, the slope can be re-graded to a gentler profile by filling waste or soil (Fig. 4a). Such a situation is valid for the southern side of the landfill. At other locations, the toe has to stay at its existing location or move inwards due to shortage of space as shown in Fig. 4b and c. The process of excavation and re-location of waste would produce additional foul odor. This would cause discomfort to the residents of the buildings on the eastern side. Hence on the eastern side, use of special bio-sprays to control the odor would be necessary.

Position of existing toe and re-profiled slope. a Beyond existing toe, b at existing toe, and c inside existing toe
Stability of Cover System
Four cover systems (Fig. 5) were considered for the waste dump. Cover A (Fig. 5a) is as per the guidelines for MSW landfills in India. Considering the fact that the waste dump has no liner at the bottom and also because landfill gas has to be collected efficiently, Cover B (Fig. 5b) with an additional layer of geomembrane is considered to be more suitable than Cover A. Cover C (Fig. 5c) does away with the clay layer of Cover B—the geomembrane alone is expected to function as competently as the clay layer in Cover A and yield better efficiency in terms of gas collection. Cover D (Fig. 5d) is similar to Cover C but uses fine to medium river bed sand (with sub-rounded to rounded particles) as the drainage layer above the geomembrane as well as the gas collection layer below the geomembrane instead of gravel and does away with the protective geotextile layers used in Cover C.

Alternate cover systems. a Cover A, b Cover B, c Cover C, and d Cover D
An attempt was made to arrive at the steepest slopes for covers B, C and D with adequate factor of safety so that maximum volume of waste could be accommodated in the waste dump and relocation of waste was minimized. Stability analysis was performed for failure parallel to outer slope along the weakest interface in the cover system [25, 44].
The interface shear strength parameters were made available by the owner of the project (Table 6). These were determined by performing modified direct shear tests under saturated conditions in a 300 × 300 mm shear box. A textured geomembrane was chosen in preference to a smooth one in the cover system as the latter exhibited low angle of shearing resistance at the interface with clay. The peak and residual angles of shearing resistance were reported as 18° and 14° respectively for the interface between clay and geomembrane (textured). At the interface between geotextile (non-woven, needle punched) and geomembrane (textured), the peak and residual values were reported to be 22° and 17° respectively. Adhesion was negligible. There was considerable debate on the choice of parameters—peak or residual—for the purpose of design. Keep in view the fact that sliding movement (pre-shearing) between various components could not be ruled out during the installation, it was decided to adopt residual parameters.
Four cases were considered critical for slope stability, namely:
-
(a)
long term case of dry slope under static loading;
-
(b)
short term case, during monsoon, of slope with seepage flow in drainage layer parallel to the outer slope (submergence ratio of 0.5 in the drainage layer);
-
(c)
short duration case of slope under earthquake loading (pseudostatic approach with horizontal seismic coefficient of 0.1 (as per Bureau of Indian Standards));
-
(d)
rare case of slope with seepage flow and earthquake loading occurring simultaneously.
Table 7 lists the minimum acceptable values of factor of safety adopted for the each of these critical cases.
The results of the stability analysis for Cover B are presented in Table 8 along the weakest interface. One notes from the table that the geomembrane-clay interface in Cover B has a low angle of shearing resistance (14°) and a factor of safety of 1.5 is achieved at a slope of 5:1 and slope height (between berms) of 5 m. This is so despite use of a textured geomembrane instead of a smooth one. For Cover C (Table 9), a similar slope is required without reinforcement as the residual angle of shearing resistance between geomembrane and geotextile is also low (17°). However when a veneer reinforcement (with allowable tension of 30 kN/m) is introduced, in the soil above the geomembrane and geotextile, one can achieve adequate factor of safety as discussed below.
Table 10 lists the values of factor of safety obtained for Cover C (with veneer reinforcement) at the weakest interface under earthquake and seepage loading. Cover slope with inclination of 3:1 is not observed to be stable as the factor of safety falls below 1.0. However a slope of 3.5:1 is observed to be stable for a height of 5.0 m between berms for all conditions. Additional computations reveal that a veneer reinforcement, with allowable tension of 40 kN/m, results in a stable slope for all conditions at an inclination of 3:1 for slope height of 5.0 m between berms.
Table 11 brings out the effect of reducing the weight of soil above the geotextile on the stability of the slope. When the thickness of the drainage layer is halved (from 0.3 to 0.15 m), the weight of the soil reduces and the factor of safety of the slope for the same reinforcement increases. This is brought out by a comparison of Tables 10 and 11. For a reinforcement with long term tensile strength of 30 kN/m, a slope of 3:1 and berm spacing of 5 m, the factor of safety increases from 1.65 to 1.91 for the static case when the thickness of drainage layer is reduced from 300 to 150 mm in Cover C. If the drainage layer is replaced by a geocomposite (geonet sandwiched between two non-woven geotextiles), the weight of the soil reduces further because the 300 mm drainage layer is replaced by a 5 mm thick geocomposite. This causes a further increase in the factor of safety as brought out by Table 12—the value changes from 1.65 to 3.36. In such a case, one can adopt a slope of 2.5:1 with a 30 kN/m geogrid for a berm spacing of 5 m and also with a 40 kN/m geogrid for a berm spacing of 7.5 m as these slopes exhibit adequate factor of safety for all conditions (Table 12).
When veneer reinforcement in the form of high strength geogrids are used, one critical aspect is anchoring the geogrids at the berm. Because of the high tensile capacity, adequate anchorage cannot be provided by a berm alone; instead an anchor trench is required. This is quite complex as it is located beneath the storm water drain as shown in Fig. 6. A wrap around arrangement as depicted in the figure is recommended otherwise it is possible that water leaking from the drain can accumulate in the anchor trench. The geomembrane must also be wrapped around along with the geogrid to preclude seepage water from entering into the trench.

Wrap-around anchor trench arrangement
An alternative to the complexities of geomembrane plus geotextile plus geogrid arrangement is to use fine-medium riverbed sand with subrounded to rounded grains directly on top of the geomembrane. Such a sand will not damage the geomembrane and also give a high angle of shearing resistance at the interface (Table 6). A slope of 2.5:1 can be used without any geogrid reinforcement as it can give adequate factor of safety for all conditions as shown in Table 13. Such an arrangement is dependent on the availability of riverbed sand close to the waste dump.
Findings of the Study on Closure of High MSW Waste Dumps
The present study leads to the following conclusions regarding the stability of side slopes of high waste dumps which have to be covered with impervious cover systems to reduce the harmful impact of the dump on the adjacent environment:
-
(a)
In a cover system, the provision of a geomembrane influences the stability of the cover alongside slopes. The interfaces between the geomembrane and the clay beneath it or the geotextile above/below it are the weak locations at which slippage are likely to occur.
-
(b)
Seepage force parallel to the geomembrane during monsoon as well as horizontal seismic loading during earthquakes also causes the factor of safety to reduce significantly.
-
(c)
Provision of veneer reinforcement in the soil above the geomembrane, and use of textured geomembrane, improves the stability of slope.
-
(d)
Provision of berms at intervals of low heights also helps in increasing the stability of the cover system.
-
(e)
Reducing the thickness of the soil above the geomembrane improves the stability of covers which have a veneer reinforcement. In such covers a slope of 2.5:1 can be achieved if the 300 mm thick soil drainage layer is replaced by a 5 mm thin geocomposite drainage layer.
-
(f)
Anchorage of veneer reinforcement at each berm is a critical design feature. A wrap-around anchor trench is suggested with special provision to keep seepage water out of the trench by wrapping the geomembrane along with the geogrid around the trench.
-
(g)
If fine to medium riverbed sand is available in nearby areas it can be used advantageously in cover design by doing away with the geogrid reinforcement as well as the geotextile which is protecting the geomembrane. This is so because the sub-rounded to rounded particles of fine to medium riverbed sand are not likely to damage the geomembrane at low normal stresses encountered in cover systems. Further, the sand offers the advantage of a much higher residual angle of interface shear along the textured geomembrane to sand interface in comparison to that between geomembrane and non-woven geotextile interface. By using such sand one can achieve a slope of 2.5:1 for the cover without the need for any veneer reinforcement as well as any geotextile protective layers.
Some Valuable Lessons from Case Studies of Landfill Design and Construction
Background
Landfill design guidelines were formalized in India for MSW and HW landfills in the year 2000. Since then, a dozen or so new landfills have been designed and a few old dumps have been closed. The experience gained and lessons learnt through the implementation of design practices and construction are shared hereafter in this section.
Ankleshwar Landfill
The landfill at Ankleshwar is amongst the first well designed HW treatment, incineration and landfilling facility in the country which came up in the 19 nineties (Fig. 7). The design of the landfill is done one phase at a time every year. Over the past few years, the following lessons have been learnt:

Waste filling at Ankleshwar Landfill
-
(a)
Lesson A—site investigations for each phase are a must: In 2007, a new phase was designed adjacent to an existing phase. No site investigations were carried out as it was felt that the new phase was within a distance of 100 m of the existing phase for which site investigation results were available. When excavation was begun, to a depth of 8 m, water table was encountered at 7 m depth at one end of the excavation (Fig. 8). This was surprising because the water table depth was estimated at 15 m on the basis of earlier site investigations. The water table was observed to be a perched water table. Its presence delayed the development of the new phase. If site investigations would have been conducted for the new phase, proper design measures would have resulted in timely development of the phase.
Fig. 8 
Perched water table
-
(b)
Lesson B—side slopes can become unstable during monsoons: The side slopes of the liner at Anleshwar landfill in the excavated portion are of the order of 2.5 (H):1.0 (V) and the cover slopes are of the order of 5.0:1.0. The side slopes in the excavated portion are observed to be very stable during the dry months, but on one occasion, slippage was observed during the monsoons when water gained access to the excavated portion and cascaded down the side slope during a heavy downpour. This portion was subsequently repaired. Stability is compromised when excess water flows downwards, parallel to the outer slope. This situation should be avoided by using proper surface water drainage measures.
-
(c)
Lesson C—leakage detection system (LDS) along straight lines is economical: The Ankleshwar landfill has a single composite barrier as its liner system comprising of a 1.5 mm thick HDPE geomembrane underlain by a 1.5 m thick compacted clay layer. It is not feasible to detect leakage in such a liner as can be done in the case of a double liner system. To overcome this shortcoming, three types of LDS were conceptualized and compared—a ‘multipoint’ detection system, a ‘linear’ detection system and an ‘area’ system. In terms of cost effectiveness and ease of construction, the linear system (Figs. 9, 10) was observed to be most suitable and it was successfully adopted at the landfill site.
Fig. 9 
LDS alignment
Fig. 10 
LDS components


Dindigal Landfill
The HW landfill at Dindigal near Hyderabad came up a few years after the Ankleshwar landfill and adopted international standards for landfill design. It was the first landfill in the country to adopt a double liner system akin to the USEPA system. In addition, solar ponds were used for leachate treatment:
-
(a)
Lesson D—solar ponds can be used as initial treatment systems: When landfills are constructed, leachate treatment facilities may take some time to be designed and constructed, especially if the leachate quality is not well characterized in advance. In such cases, solar ponds (Figs. 11, 12) can be adopted in the initial phases in those regions where the annual evaporation is well above the precipitation quantity. Solar ponds do have the problem of poor odor control but allow leachate to be collected and stored properly in the early stages of landfill construction and thus help in early commissioning of the landfill. Due care should be given for design of the liner system of the solar pond which should be as stringent (or even more) as that adopted for the landfill.
Fig. 11 
Leachate collection wells
Fig. 12 
Leachate solar pond


Baddi Landfill
The HW landfill at Baddi in Himachal Pradesh lies in the foothills of the Shivaliks in northern India. In such areas, flat ground is difficult to locate. One has to construct the landfill in undulating ground (Fig. 13). Two important lessons emerged from landfills in such terrain:

Undulating terrain
-
(a)
Lesson E—surface water drainage is of utmost importance: During heavy showers, surface water tends to run along specific paths in undulating ground. In addition, water from outside areas enters the landfill site if it is low-lying. Drainage measures such as interceptor trenches and diversion channels have to be designed with great care.
-
(b)
Lesson F—cost of earthwork is a significant portion of the landfill construction cost: Because of the undulating nature of the ground, large quantities of soil has to be moved for creating landfill capacity by excavation (Fig. 14) and by construction of embankments (Figs. 15, 16). Optimization of cut and fill operations help reduce landfill construction costs.
Fig. 14 
Excavation of earth mounds
Fig. 15 
Earth filling operations
Fig. 16 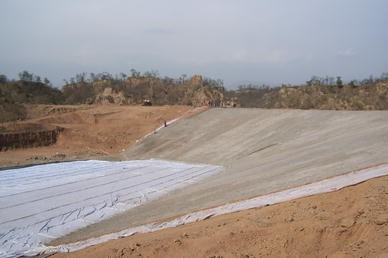
Completed phase of landfill


Kochi Landfill
The HW landfill site at Kochi posed a peculiar problem. The site was characterized by two rocky flat-topped mounds with a low-lying area in between them. If the landfill was located in the low-lying area, it would yield a high landfill volume. However, in this area the water table was very close to the ground surface. In addition, the low-lying area appeared to be the drainage path for monsoon run-off. Hence, at this site, the initial phase of the landfill was located on top of the rocky mound. It was decided to examine the feasibility of diverting the surface run off during monsoons away from the low-lying area and then develop the landfill at this location for later phases. The important lessons learnt were:
-
(a)
Lesson G—if a landfill is to be located in a low-lying area which serves as an existing drainage path for surface run-off during monsoons, alternate drainage arrangements with adequate capacity to handle extreme event flows must be provided before a landfill is built.
-
(b)
Lesson H—low-lying areas offer attractive option for disposing large volumes of waste in landfills; however it must be investigated that the water table is not very close to the ground surface and does not rise above it during rainy season.
Hirakud Landfill
A small HW landfill was designed for Hindalco at Hirakud. The site is located on top of a mound. Hard rock was encountered at shallow depth. In the preliminary design, a depth of excavation of 8 m was envisaged. However this was curtailed to 1–2 m when hard rock was revealed. This led to a substantial reduction in the landfill capacity. The following lesson was learnt:
-
(a)
Lesson I—when hard rock is present at shallow depth, the landfill is to be designed as an above ground landfill (Fig. 17). The advantage of excavating and thus increasing the landfill volume is not available at such sites.
Fig. 17 
Above ground landfill
-
(b)
Lesson J—if disintegrated rock is encountered, one can consider increasing the depth of landfill by excavation using mechanical means. Excavation costs are high and these can be offset by selling the excavated rock fragments as coarse aggregate for construction purposes. But many states are reluctant to permit stone quarrying at landfill sites.

Faridabad Landfill
For disposing off MSW, the Municipal Corporation of Faridabad identified a landfill site adjacent to an existing ash pond of a thermal power station. This was the only site which was easily available; at all other locations, acquisition of land was a problem. The peculiarity of this site was its shape. Though the plan area of the site appeared to be adequate for receiving the waste for 8–10 years, the shape of the landfill in plan was triangular (Fig. 18) with one of the apex angles being very acute. This implied that the triangle had a narrow width near this apex. As a consequence, the height to which the waste could be stored in this narrow width area was very small. Consequently the landfill volume was curtailed. The following was the lesson learnt:

3D view of triangular landfill site
Lesson K—landfill sites having narrow width cannot be used for storing waste to large heights. For a 15 m height, width in excess of 150 m is desirable. Equidimensional area in plan is desirable in comparison to a long and narrow area for a landfill site.
Narela–Bawana Landfill Site (Delhi)
One site at Delhi in the Narela–Bawana region was briefly considered as viable for disposing MSW. A transmission line was passing through one portion of the landfill site (Fig. 19). Due restrictions in the vertical clearance between the power cables and the ground level beneath it, the proposed landfill could not be constructed beneath and near the transmission line. This led to loss of landfill volume by 30 %. If the transmission line could have been relocated outside the site, more waste could have been accommodated at the site.

Landfill site with transmission line passing through it
Lesson L—if transmission lines are passing through landfill sites, they will cause significant loss of landfill volume; such lines should be re-located outside the landfill area.
Landfills near Bangalore and Shimla
Often one encounters situations where landfills are located on sloping ground. At a proposed site near Bangalore, the landfill is located on a rock outcrop with an elevation difference of 30 m along a length of about 450 m, i.e., a ground slope of approximately 15 (hor.):1 (ver.) (Fig. 20). In a more acute situation, near Shimla, the landfill is proposed along a sloping hill side with slopes steeper than 2.0 (hor.):1.0 (ver.). In both these cases, stability of the landfill against sliding along the base is critical. The interface between the geomembrane and the clay beneath it as well as the geomembrane and the geotextile above it are the critical failure surfaces. Use of textured geomembranes improves stability. For ground slopes in excess of 20 % (5:1), special design measures are required. The costs of such measures in very steeply sloping ground, as at Shimla, can be prohibitive and may render a landfill to be unviable from cost considerations.

Landfill on sloping ground
Lesson M—when landfills are located on sloping ground, stability of landfill against sliding along the base is critical, and this aspect should be investigated in detail.
Landfill at Jaitpur (Delhi)
For the past 5 years, a landfill is being developed at Jaitpur in south-eastern part of Delhi in a quarried pit, 20 m deep. The work has been slow because the pit was filled with sewage waste water from surrounding residential areas. Pumping out of sewage water has been nearly completed. The peculiar problem faced at such a site is the placement of liner along the near-vertical rock slopes of the quarried pit. Standard solutions for such steep slopes are not available. The ‘christmas tree’ arrangement and the ‘polymeric panel (reinforced)’ arrangement are two alternatives which have been tried but more research is needed in this direction.
Lesson N—placement of liners along steep rock slopes in quarried pits requires special and costly design measures.
Landfills at Gorai (Mumbai) and at Okhla & Gazipur (Delhi)
One problem faced at all mega cities is the closure of old unlined landfills of MSW. Several of these landfills are more than 20 m high. The side slopes of such landfills exist at angles of 30–45° (Figs. 21, 22) because the waste has been filled by the ‘tipping over’ method. When impermeable covers have to be provided to close such landfills, the stability of such covers on the existing slopes is observed to be inadequate because of the low interface shear strength between geomembrane and the soil above or beneath it. Flattening of slopes to inclinations of 3.0 (hor.):1.0 (ver.) or less has to be carried out by relocation of the waste. This requires odor control during execution.

Old waste dump at Gorai

Old waste dump at Okhla
Lesson O—closure of old unlined landfills requires flattening of side slope to place geosynthetic covers with adequate safety along with special odor control measures during relocation of waste. This aspect has been discussed in detail in the previous section on cover systems for high MSW dumps.
Factors Which Influence the Cost of MSW and HW Landfills
Background
Landfill design in India is guided by notifications of the Government from time to time. Guidelines for the liners and covers to be adopted for MSW landfills have been notified by the Ministry of Environment and Forests [33, 34] and Ministry of Urban Affairs [36]. Similarly, guidelines for liners and covers for HW landfills have been notified by the Central Pollution Control Board (CPCB 2001) [6]. The choice of type of liner and cover system has significant impact on the cost of disposing waste in a landfill. In this section, two types of landfills have been considered—MSW landfills and HW landfills. The influence of various components on the liner and cover costs has been identified and their impact on landfilling costs highlighted.
Methodology
Landfilling costs [12] are a summation of the costs pertaining to (a) site acquisition, (b) site assessment and detailed design, (c) site development, (d) liner and leachate collection system, (e) operation, (f) final cover and closure, (g) post-closure care, (h) contingencies, (i) funds for emergency repairs and (j) operator’s profit for privately operated landfills.
For each of the above components, the quantities are estimated and these are multiplied by the prevailing market rates. For example, the liners and covers as per guidelines of MOEF [33, 34] and CPCB (2001) [6] are shown in Figs. 23, 24, and 25 and these include the cost of top soil, drainage layers, leachate collection layers, compacted clay layers, geomembranes, filters, separators, pipes, pumps etc. Operating costs include cost of waste placement and compaction, daily cover, temporary roads, surface water drains, leachate treatment and environmental monitoring.


Cover and liner for hw landfill (CPCB 2001). VG vegetation, TS top soil, DL drainage layer, GM geomembrane, CCL compacted clay layer, GC gas collection layer, LC leachate collection, PLC primary leachate collection, SLC secondary leachate collection, SS sub soil

Double liner for hw landfill (CPCB 2001). VG vegetation, TS top soil, DL drainage layer, GM geomembrane, CCL compacted clay layer, GC gas collection layer, LC leachate collection, PLC primary leachate collection, SLC secondary leachate collection, SS sub soil
In the present study, the landfills have been designed for the Delhi region and market rates prevailing in Delhi have been used [54].
Landfill Details
The MSW and HW landfills analysed in this section have been designed for the following conditions, as existing at Delhi:
-
Water Table: 20 m below the ground surface
-
Type of landfill: Above ground landfill
-
Operating life of landfill: 16 years
-
Post-closure care period: 25 years
-
Waste quantities reaching HW and MSW landfill: See Table 14
Table 14 Waste quantities and landfill height -
Base area of HW Landfill: 220 × 220 m
-
Base area of MSW Landfill: 800 × 800 m
A typical section of the landfill is shown in Fig. 26. Both landfills have a square base and have side slopes 4:1 (hor.:ver.). The area of the MSW landfill is 13 times the area of the HW landfill because of the much larger quantity of waste received by the former. The heights of the landfills for different quantities of incoming waste are listed in Table 14.

Section of above-ground landfill
The unit rates of various items prevailing in Delhi are listed in Table 15. Due to non-availability of clay in Delhi, amended soil comprising of sandy silt + 5 % bentonite has been chosen as the barrier layer [9].
Results and Discussions
The results of the study are presented in Tables 16, 17, 18, 19 and 20. The typical liner costs, cover costs and landfilling costs for 15 m high landfill are presented in Tables 16, 17 and 18. The influences of landfill height and variations in liner and cover are presented in Tables 19 and 20.
Liner Costs
Table 16 lists the cost of liner systems for MSW and HW landfills. One notes from the table that the main cost of liners are the geomembranes and the compacted clay (amended soil) barrier which together constitute about 60 % of liner cost followed by the cost of leachate collection layer which has about 20 % contribution. The cost per square meter of the liner system varies between Rs. 814/- for MSW landfill to Rs. 1,291/- for HW landfill with double liner system.
Cover Costs
Table 17 lists the cost of cover systems for MSW and HW landfills. The cost of cover system for HW landfill (per m2) is Rs. 1,040/- which is 80 % more expensive than that for MSW landfill at Rs. 590/-. This is because of the presence of a geomembrane in the former. In MSW landfill, the compacted clay layer and gas collection layer contribute more than 60 % to the cover cost whereas in HW landfill their contribution is 30 % and the contribution of geomembrane is 25 %.
Landfill Costs
Table 18 gives an idea about how different components contribute to the total cost of 15 m high landfills for MSW and HW. The costing has been done on a simplified basis and does not include time dependant escalation component. Site acquisition costs have not been included as these are highly variable. One can note from the table that liners and covers contribute 50 % of the total costs for both type of landfills whereas operating costs range between 9 and 20 % of the total costs. Between them, the three components contribute between 58 and 70 % of the landfill costs.
One can also note from the table that the cost of landfilling MSW per ton is Rs. 309/- as against Rs. 507/- for HW at 1998 prices. This difference accrues on account of more stringent requirements for imperviousness of liners and covers in HW landfill.
Influence of Height of Landfill
When the height of landfill is changed, the cost of landfilling per ton changes on account of the fact that the quantity of waste being placed in the landfill per square meter of liner or cover is altered. When the landfill height is increased, more waste is accommodated in the same base area (liner area); hence the cost of disposal per ton reduces (see Table 19). The opposite is true when the height of landfill decreases. Therefore, higher landfills are desirable whenever the same are feasible without compromising on aesthetics and stability. One notes from Table 19 that landfilling cost per ton of waste increases by almost 50–70 % as the height of landfill reduces from 20 m to 11–12 m.
Influence of Site Conditions
Liners and covers constitute about 50 % of landfilling costs (Table 18). Changes in components of these in landfills can help alter disposal costs. Table 20 reveals that by making changes in a liner or cover, landfill costs may reduce or increase up to 12 %. For example, when a MSW landfill is located on a clay type soil, one can avoid importing clay, and use the subsoil clay as a barrier layer by compacting it (Case (B), Table 20). On the other hand, one may adopt a double liner system for a HW landfill located in high permeability areas with high rainfall and high water table (Case (D), Table 20) resulting in increase in cost. Such changes can modify the cost of landfilling by 4–12 % individually and by 20 % on cumulative basis.
Findings of the Study
The present study highlights the following:
-
(1)
liners and covers constitute up to 50 % of the cost of waste disposal in landfills;
-
(2)
barrier layers—geomembrane and compacted clay/amended soils—in liners and covers, together, constitute 25–60 % of the cost of liner and cover systems;
-
(3)
changes in landfill height affect the landfilling cost significantly by as much as 50–70 %.
-
(4)
site conditions cause significant changes in costs of landfilling.
Hydraulic Barriers for Ground Water Protection at a Tailings Pond
Background
The Ministry of Environment & Forests, Govt. of India notified the Hazardous Waste Management and Handling Rules (HWM) in 1989 and subsequently upgraded them in 2000 [32, 33]. As a consequence, many types of solid wastes being generated by industrial units became classified as “hazardous wastes”. Such wastes, which were hitherto being disposed off in landfills and impoundments without proper basal lining systems, were required to be placed in waste containment systems with adequate protection against ground water contamination. At one site in Northern India, lead–zinc tailings were being deposited in an unlined tailings pond having an area of 800,000 m2. Environmental impact assessment studies conducted at the site indicated the possibility of ground water contamination due to the presence of heavy metals in the tailings. Hence remedial measures in the form of ground water protection barriers were considered necessary. This section highlights the process of selection of the hydraulic barrier system through field and laboratory studies.
Tailings Pond
Figure 27 shows the plan and sectional view of the tailings pond receiving lead–zinc tailings in an impounded area of trapezoidal shape surrounded by 5–9 m high peripheral dykes. The tailings were transported through pipelines in the form of a slurry and allowed to settle in the pond with the slurry-making water being pumped out for recirculation. The depth of tailings in the pond ranged from 2 to 5.5 m and the pond had capacity to receive tailings for a few more years with further provision of increasing the pond capacity, if necessary, by incremental raising of dyke height through upstream or downstream method of construction.

Tailings pond details. a Layout and b section Y–Y
With the implementation of the HWM Rules in India in the early nineties, a two stage process was initiated for reviewing the status of environmental impact of the tailings pond and arriving at suitable remedial measures. The environmental impact studies in the first stage of the process revealed the following:
-
(a)
The tailings fell under the category of ‘hazardous waste’ as per the HWM rules due to the presence of heavy metals;
-
(b)
The tailings pond constituted a ‘high-volume, low-hazard’ waste disposal facility;
-
(c)
The ground water level around the tailings pond was a few metres below the ground surface;
-
(d)
The increase in level of contaminants in the ground water due to tailings disposal was not very significant; nevertheless short-term and long-term protective measures were required for preserving the ground water quality around the tailings pond;
-
(e)
The tailings pond was underlain by 5–15 m thick strata of silty/clayey soil followed by highly weathered rock and then sound rock.
On the basis of the results of the environmental impact study, geotechnical subsurface investigations were undertaken for selection and design of appropriate protective measures to prevent ground water contamination in the future.
Ground Water Protection
Three alternatives were considered for the protection of ground water:
-
(a)
Capping and abandoning the existing tailings pond and starting a new tailings pond with basal liner system (Fig. 28a).
Fig. 28 
Alternatives considered for ground water protection. a Capping of existing pond; disposal in new pond, b intermediate liner at present level; final cap at full capacity, c vertical cut-off at present level; final cap at full capacity
-
(b)
Providing intermediate lining to the tailings pond at the existing tailings level, then filling tailings to the top level of the pond in future years and providing a final cap after reaching the full capacity (Fig. 28b).
-
(c)
Providing a vertical cut-off wall around the periphery of the pond (along with extraction wells), then filling tailings to the top level of the pond in future years and providing a final cap after reaching full capacity (Fig. 28c).

In the first alternative, tailings disposal would continue in the existing pond for a short period of time till a new disposal facility with proper lining would be constructed. Tailings disposal would then be diverted to the new facility and the old pond provided with a final cap after allowing the tailings to dry and consolidate.
In the second alternative, a hydraulic barrier would be provided over the existing tailings which would act as a cap for the existing tailings and also a liner for future tailings to be filled. This arrangement would allow utilization of the existing storage capacity within the peripheral dykes to the full level. However, the functioning of the liner system on a soft tailings deposit was considered suspect. The third alternative would involve construction of a vertical hydraulic barrier down to sound rock, extraction of ground water from within the enclosed area and recirculation of the same. This arrangement would also allow utilization of the existing storage capacity within the peripheral dykes to the full level. The first alternative was eliminated due to lack of availability of land for the new pond. For the other two alternatives, geotechnical investigations were conducted to compare their feasibility and costs for arriving at an appropriate choice of barrier system.
Geotechnical Investigations
Seventeen boreholes were drilled at the tailing pond site. Six boreholes were within the pond area and eight were just outside the tailings pond (all along the peripheral dyke, 5–10 m away from the toe of the dyke). Three boreholes were drilled at a borrow area site from which clayey soil was to be received for use as material for liner/vertical cut-off. The boreholes were drilled up to a maximum depth of 25 m below the bedrock level and undisturbed samples obtained for assessment of geotechnical properties of the subsoil and rock. In addition, in situ permeability and pump-in tests were conducted to evaluate the permeability of the deposited tailings as well as of the soil and rock formations. The results of the field and laboratory investigations are presented in Fig. 29 and in Table 21. Figure 29 shows the generalized subsoil profile. One notes from the figure that the depth to bedrock along section X–X (west to east) varies from 3.5 to 10 m and along the Y–Y (north to south) from 4 to 9 m. The bedrock level is observed to dip toward the south east direction and the maximum depth to the bedrock below the ground surface was recorded as 12 m at the south east corner of the pond. The water table level outside the peripheral dyke is observed to be 2–7.5 m below the ground surface. The water table level follows the bedrock profile and lies 1–3 m above the bedrock level. Within the tailings pond, some water remains standing to a height of 0.5–1.0 m above the tailings level in the southern portion of the pond near the pump station. This does not appear to cause any significant rise in the water table level outside the pond area. From Table 21 as well as from Fig. 29, one observes that the subsoil comprises of residual soil with variable amount of gravel. The top 1–3.5 m of the soil (Soil Layer A) is essentially sandy, clayey silt of low plasticity with some gravel, whereas the lower strata (Soil Layer B) is a silty, clayey, gravel-sand mixture. A transition layer (1 m thick) of gravel and cobble sized rock fragments underlies soil B. This is followed by highly weathered carbonaceous mica schist (Rock Layer A) up to a depth of 10 m (RQD varies from 0 to 45) which becomes compact and moderately strong (Rock Layer B) at deeper depths (RQD varies from 43 to 96).

Generalized soil and rock profile
The tailings deposited in the pond above the ground surface comprise predominantly of silt sized particles along with significant fraction of sand sized particles.
The last column of Table 21 shows the permeability of the tailings as well as of the subsoil determined from in situ permeability tests. The coefficient of permeability of the various strata is of the order of 10−4–10−5 cm/s indicating that there is inadequate barrier against leachate infiltration into the ground and that leachate from the tailings pond can affect ground water quality. Further it is observed from the results of pump-in tests in the rock formation that field Lugeon values range between 2 and 78 in Rock Layer A but reduce to less than 2 in Rock Layer B. This shows that Rock Layer B is almost impermeable.
Three type of soils from different sources were considered for use in construction of liner or vertical cut-off.
-
(a)
Excavated soil (0–7 m depth) adjacent to the tailings pond (soil ES);
-
(b)
Local Top Soil (0–2 m depth) available at a distance of 2 km from the tailings pond (Soil LS);
-
(c)
Borrow Area Soil (0–5 m depth) available at a distance of 10 km from the tailings pond (Soil BS).
The average grain size distribution and the Atterberg’s limits of these soils are presented in Table 22, which also includes the properties of commercially available bentonite from a site 50 km away from the tailings pond. The table shows that soil ES has significant quantity of gravel. This gravel content was observed to be highly variable and this variability was expected to hamper achievement of a uniform quality of liner/cut-off. Hence the soil was not considered in further studies. Soils LS and BS have adequate percentage of fines and satisfactory plasticity for use as liner/cut-off material. The bentonite is observed to have 76 % clay sized particles and a plasticity index of 434, making it suitable for use as an additive for achieving low-permeability in soils LS and BS. The permeability of soil LS and soil BS was evaluated for compacted samples by performing falling head tests in a consolidometer in the laboratory. In addition, these soils were mixed with 5 and 10 % bentonite to find the influence of additive on the permeability. The results are presented in Table 23. It is noted from the table that both soils can form a satisfactory hydraulic barrier in the compacted state, exhibiting a permeability less than 1.0 × 10⁻⁷ cm/s when 5–10 % bentonite is added to them.
Hydraulic Barrier
Two factors were considered for the choice of the barrier system, namely cost and performance.
A horizontal intermediate liner system on top of the existing tailings deposit would comprise of a 0.9 m thick compacted clay layer overlain by a 1.5 mm thick HDPE geomembrane and 0.3 m thick leachate drainage layer (Fig. 28b) (CPCB 2001). In addition, the system would also have leachate collection pipes, sumps and 4–6 pumps for collecting and transporting the leachate to the recirculation pipe which reclaims the slurry water. A vertical cut-off system would comprise of a 1.0 m thick soil-bentonite cutoff wall up to bedrock level underlain by a cement-bentonite grout curtain up to 15 m below bedrock level (Fig. 28c). In addition, the system would have 4–6 extraction wells located beyond the toe of the peripheral dykes on the southern side of the pond to lower the ground water and intercept any seepage water reaching it along with a pipe system for transporting the collected water to the recirculation pipe which reclaims the slurry water.
Relative Costs
The relative costs of the two barrier systems were compared. The cost of the intermediate liner system was estimated at Rs. 33.4 crores in comparison to the cost of the vertical cut off system which was estimated at Rs. 4.5 crores. This is so because the volume of clayey soil required in the former system was about 30 times that required in the latter system. In addition, the high cost of HDPE geomembrane also contributed to the high cost of the liner system. Another factor which was considered in the study was the possibility of settlement of the soft tailings layer beneath the intermediate liner as additional tailings are deposited in future years on top of the liner system. Consolidation tests performed in the laboratory on loosely deposited tailings yielded compression index values in the range of 0.30–0.37 implying a settlement of 27–38 cm at the base of the intermediate liner for a build-up of 3–5 m thick layer of tailings in future years over the liner. Such a large settlement (up to 42 % of the thickness of the liner) could result in loss of imperviousness of the liner system. In view of the above, a vertical cut-off system comprising of a soil-bentonite wall and cement-bentonite grout curtain was selected as the superior and more cost-effective option.
Final Choice
The final configuration of the vertical barrier system adopted for the tailings pond was based on Appolonia [1], Ryan [49], Evans [14], Sharma and Lewis [53], Xanthakos [65], Veeraswamy [62] and was as follows (Figs. 30, 31):

Simplified view of vertical cut-off barrier

Sectional view of vertical cut-off barrier
-
(a)
Layout: Peripheral cut off system all around the tailings pond at a distance of 25 m or more from the toe of the tailings dyke. (The cut off wall is kept well away from the toe of the dyke so that stability of the dyke is not affected)
-
(b)
Depth: From ground surface up to 15 m below bedrock level into sound rock.
-
(c)
Elements: Soil–bentonite wall, 1.0 m thick extending from ground surface up to bedrock level, underlain by a cement-bentonite grout curtain extending from bedrock level to 15 m below into sound rock.
Findings of the Study
The present study highlights the use of geotechnical investigations for arriving at appropriate solutions to ground water protection problems at HW disposal sites. It demonstrates that:
-
(a)
At waste disposal sites where sound rock is available at reasonable depth beneath the ground surface, vertical cut-off systems provide a cost-effective hydraulic barrier against contaminant migration.
-
(b)
Geotechnical investigations form an important aspect of decision-making related to hydraulic barriers around old waste disposal sites.
Raising of Dykes of an Ash Pond at a Thermal Power Plant
Background
This section deals with a case study of raising of ash dykes by 3–6 m by upstream method for a thermal power plant (4 × 410 MW) located in Punjab state (India) [57]. The ash pond occupies a very large area of 847 acres (3.43 million m2) (Fig. 32). Starter dykes of height 3 m were constructed all along the perimeter of the ash pond in the beginning. These dykes were raised by 3 m for the first time in the year 1997 and subsequently some part of the dykes were raised further by 3 m in the year 2004. Ash level in the pond reached top level of the dyke in the year 2009 requiring further raising of the dykes to prevent ash slurry from overflowing over the dykes Therefore, the case was considered for the raising of dykes by 3 m (3rd raising) and in some stretch by 6 m (2nd raising).

View of ash pond
Observations from Site Visit
A site visit was undertaken during 2009 and the following observations were noted:
No decanting arrangement for slurry water was available.
-
(a)
Slurry water was observed to dry out due to evaporation and downward flow.
-
(b)
At most places the pond was dry.
-
(c)
No seepage was observed on the downstream side of the dykes.
-
(d)
Downstream slope was covered with shrubs and access to the toe was difficult.
-
(e)
No toe drain was provided.
-
(f)
No failure of dyke had been reported in the past.
-
(g)
The stability analysis was to be carried out for dry condition and seepage condition both, since water may be ponded behind the dyke due to inadequate drainage facility.
Site Investigations
A site investigation programme was drawn up with the following objectives:
-
To determine the final cross section of existing dykes.
-
To ascertain the depth of ash and properties of ash at various locations within the pond and existing dyke.
-
To ascertain the type of soil and its properties at various locations.
-
To ascertain the depth of water table.
A total of 22 bore holes were drilled, some at the crest of the existing dyke, some at the toe and others in the ash pond. Standard penetration tests (SPT) were conducted as per IS 2131 [21] and undisturbed samples were taken for the evaluation of engineering properties of soil.
Results of Laboratory Tests on Ash
The results of laboratory tests of five samples received from site and mixed samples are summarized in Table 24.
On the basis of the laboratory tests, the following observations are made:
-
(a)
The ash is predominantly sandy silt though in one sample the sand content is observed to be larger.
-
(b)
The ash is non-plastic in nature.
-
(c)
The OMC is observed to vary from 28 to 37 % and the maximum dry density is observed to vary from 1.06 to 1.21 gm/cc in standard Proctor test.
-
(d)
The shear strength of compacted ash can be characterized by c′ = 0 and ф′ = 31°.
Inferences from Site Investigation Report
Site investigation report indicated the following:
-
(a)
The crest width of the existing dyke is 3.0 m and the height varies between 3.7 and 8.45 m at different locations.
-
(b)
The downstream slope of the existing dyke has an inclination of 2.5:1.0 (h:v).
-
(c)
The depth of water table varies between 2.45 and 6.40 m below the ground surface.
-
(d)
The depth of ash is observed to vary from 4.5 to 10.6 m below the crest of the embankment and 0–3.0 m below the toe of the embankment.
-
(e)
The sub soil comprises of silty sand.
The following properties of the ash and soil were used for design on the basis of the site investigation report:
-
(a)
Ash: Unit weight = 12 kN/m3
c′ = 0, Ø′ = 31°
-
(b)
Soil: Unit weight = 20 kN/m3
c′ = 0, Ø′ = 32°
Stability Analysis
Stability analysis was performed using standard software GEOSLOPE version Slope/W 2007. The existing dyke analyzed for stability comprised of ash as the embankment material and silty sand as the subsoil. Raising of dyke was considered by the upstream method of construction. Factor of safety of 1.5 and above is considered to be acceptable for long-term stability. The analysis was done for the following cases.
Stability of Existing (Starter) Dyke (Without Seepage)
Stability of existing (starter) dyke was analysed without seepage (dry case). The minimum factory of safety is observed to be close to 1.5 which shows that the embankment is stable.
Stability of Existing (Starter) Dyke (with Seepage)
If slurry water remains ponded behind the existing (starter) dyke for excess period of time, seepage can occur through the dyke. The factor of safety is observed to fall below 1.0, making the dyke unstable. As reported by field engineers, such a case is not observed at the ash pond where water percolates downward or dries up by evaporation. However, internal drains (rock toe, toe drain and side drain) are provided in starter as well as raised dykes as remedial measure to intercept and drain off seepage water, incase the phreatic line reaches the downstream slope.
Stability Analysis with 3 m Raising
Stability analysis of existing dyke with 3 m raising was carried out. The minimum factory of safety is observed to be 1.66 which is above 1.5 and hence, the embankment is stable.
Stability Analysis with 6 m Raising
The minimum factory of safety for 6 m raising is observed to be 1.53 which shows that the embankment is stable.
Design: Raising of Dykes by 3.0 and 6.0 m
Figures 33, 34, 35, and 36 show the components of the ash dyke designed for raising the height by 3.0 and 6.0 m by the upstream method. The following are the key features:

Raising of dyke by 3 m

Raising of dyke by 6 m

Details of rock toe of raised dyke

Details of toe drain and rock toe for starter dyke
-
(a)
Crest width: 3.0 m
-
(b)
Height: 3.5 m/6.5 m
-
(c)
Outer slopes (both upstream and downstream): 2.5:1.0
-
(d)
Main material (hearting): compacted ash
-
(e)
Cover: 0.5 m thick made of local soil which will support vegetation
-
(f)
Internal drains (chimney and blanket): consisting of sand having less than 5 % fines as shown in Figs. 33 and 34.
-
(g)
Rock toe for raised dyke: As per details shown in Fig. 35.
-
(h)
Toe drain, cross pipe drain for raised dyke: as shown in Figs. 33 and 34.
-
(i)
Contrary slopes (1 in 500) are provided at 50 m interval for longitudinal alignment of toe drain.
-
(j)
Rock toe and toe drain along starter dyke: These are remedial measures for starter dyke as shown in Fig. 36.
-
(k)
Erosion protection: Vegetative cover (local grass which is self sustaining) is provided on the upstream and downstream slopes; suitable lining/riprap may be considered if erosion due to wave action is observed on upstream slope.
-
(l)
Free board: 0.6 m
Design: Central Dyke for Pipelines
Figure 37 shows the components of the ash dyke designed for placement of pipes on a central (partition) dyke. The following are the key features:

Cross section of central dyke
-
(a)
Crest width: 3.0 m
-
(b)
Height: up to 3.0 m
-
(c)
Outer slopes (both upstream and downstream): 2.5:1.0
-
(d)
Main material (hearting): compacted ash
-
(e)
Cover: Same as 3 m raising
-
(f)
Internal drains (chimney and blanket): two drains consisting of sand having less than 5 % fines as shown in Fig. 37.
-
(g)
Rock toe: Same as 3 m raising
-
(h)
Erosion protection: Same as 3 m raising
Inflow Points for Slurry Water
The inflow points where slurry water is discharged from pipelines should not damage the raised dykes. The discharge should be at least 50 m away from the toe/heel of the raised dyke by a suitable arrangement which moves the mouth of the discharge pipe inside the ash pond. Alternatively the slope and base of the raised dyke or central partition dyke, at inflow points, should be protected as shown in Fig. 38.

Protection details of central dyke at inflow points
Construction Aspects
-
(a)
Construction of dykes for raising the height is done on dry ash pond area. If an area has been ponded in the recent past, it must be allowed to dry out for at least 30 days.
-
(b)
The top 0.3 m of the ash at the surface of the ash pond is excavated and re-compacted in the same manner as for the dyke.
-
(c)
Ash for the dyke is compacted at OMC in layers of 350 mm thickness using vibratory smooth steel-drum rollers.
-
(d)
The roller speed and number of passes is determined from field trial embankment and minimum 95 % of Proctor Maximum Dry Density is achieved.
-
(e)
To prevent dust emissions, the ash is covered with local soils as early a possible.
-
(f)
Material for construction of drains and filters is as per the filter criteria.
-
(g)
Opinion of a local horticulture expert is taken to ascertain the type of vegetative cover to be provided, keeping in view the local soil and climatic conditions.
Important Observations
In the existing ash pond, no slurry decantation arrangement has been provided and FOS of the starter dyke can fall below 1.0 in case seepage occurs through dyke. Therefore, necessary arrangement for safe exit of slurry water has to be provided from stability point of view.
Results of stability analysis indicate that seepage of water through the existing dyke under condition of prolonged ponding can affect the stability of the dyke. At present such a condition has not been observed. However, as the height of dyke is raised, the head of water increases and the possibility of seepage increases. Hence two important interventions are recommended—a rock toe and toe drain for the starter dyke and as shown in Fig. 36 and periodic monitoring of seepage. Monitoring of phreatic line inside the existing starter dyke is recommended by use of piezometers. Open stand pipe piezometers, up to a depth of 10 m from the crest of the existing embankment may be installed at a spacing of 250 m along the dyke. If seepage is detected by the development of phreatic line, remedial measures in the form of a suitable berm and an internal drain on the downstream side of the existing dyke would have to be adopted.
Concluding Remarks
The use of low-permeability hydraulic barrier systems for containment of waste and of high-permeability drainage systems for collection of emissions/contaminants, are two important aspects of environmental control at waste disposal sites which have been highlighted in this paper. The importance of environmental geotechnology in design and construction of effective barrier systems, in providing efficient collection systems and in ensuring stability of high waste dumps has been brought out through several case studies. In particular, the influence of site conditions, of the subsoil profile, and of permeability of the soil on design of waste disposal facilities has been demonstrated.
References
Appolonia DJ (1980) Soil–bentonite slurry trench cut-offs. In: Journal of Geotechnical Engineering Division, Proceedings of American Society of Civil Engineers, vol 106, GT4, pp 399–417
Bjerg PL, Rugge K, Pedersen JK, Christensen TH (1995) Distribution of redox-sensitive groundwater quality parameters downgradient of a landfill (Grindsted, Denmark). Environ Sci Technol 29:1387–1394
Canter LW (1996) Environmental impact assessment. McGraw-Hill, New York
Canadian Council of Ministers for the Environment (1992) National Classification System for Contaminated Sites. Report CCME EPC-CS39E, March 1992. Winnipeg, Canada
Chatterjee RS, Fruneau B, Ruelant JP, Roy PS, Frison R-L, Lakhera RC, Dadhwal VK, Saha R (2006) Subsidence of Kolkata (Calcutta) City, India during the 1990s as observed from space by differential synthetic aperture radar interferometery (D-InSAR) technique. Remote Sens Environ 102:176–185
CPCB (2001) Criteria for hazardous waste landfills. Central Pollution Control Board, HAZWAMS/17/2000-2001, Delhi
CPCB (2002) Manual for design, construction and quality control for liners and covers of hazardous waste landfills. Central Pollution Control Board, New Delhi
CPCB (2007) Management of municipal solid wastes. Central Pollution Control Board. http://www.cpcb.nic.in/pcpdiv_plan4.htm
Datta M (1997) Waste disposal in engineered landfills. Narosa, New Delhi
Datta M (2003) Geotechnical study for hydraulic barrier system at tailings pond. ASCE Practice Period Hazard Toxic Radioact Waste 7(3):163–169
Datta M (2006) Geotechnical aspects of landfills and old waste dumps—some case studies. In: Proceedings IGC 2006, Chennai, pp 221–228
Datta M, Chattopadhyay S (1998) A methodology for cost estimation of engineered landfills. In: Proceedings National Conference on Geo-environment, Allahabad, pp V-1–V-10
Department of Energy (1996) National corrective action prioritization system (NCAPS). US Department of Energy, Office of Pollution Prevention and Resource Conservation Policy and Guidance, RCRA Information Brief EH-413-070/1296 [December 1996 (updated 3/97)]
Evans JC (1993) Vertical cut off walls. In: Daniel DE (ed) Geotechnical practice for waste disposal. Chapman and Hall, London, pp 430–454
Golder Associates (1996) LandSim-groundwater risk assessment tool for landfill design. http://www.landsim.com
Golder Associates (NZ) Ltd (2002) Risk assessment for small closed landfills. Report for the Ministry for Environment under the sustainable management fund, Auckland
Hagemeister ME, Jones DD, Woldt WE (1996) Hazard ranking of landfills using fuzzy composite programming. J Environ Eng 122:248–258
Hazra T, Goel S (2009) Solid waste management in Kolkata, India: practices and challenges. Waste Manag (Oxf) 29:470–478
Hinsby K, Bjerg PL, Andersen LJ, Skov V, Clausen EV (1992) A mini slug test method for determination of a local hydraulic conductivity of an unconfined sandy aquifer. J Hydrol 135:87–106
India Infrastructure Report (2006) Solid waste management, Chap 8. http://www.3inetwork.org/reports/IIR2006/Solid_Waste.pdf
IS 2131 (1981) Method for standard penetration test for soils. Bureau of Indian Standards, New Delhi
Joseph K, Esakku S, Nagendran R, Vishwanathan C (2005) A decision making tool for dumpsite rehabilitation in developing countries. In: Proceedings of Sardinia 2005, Tenth international waste management and landfill symposium, 3–7 Oct 2005, Cagliari
Khanbilvardi RM, Ahmed S, Gleason PJ (1995) Flow investigation for landfill leachate (FILL). J Environ Eng 121:45–57
Kjeldsen P, Grundtvig A, Winther P, Andersen JS (1998) Characterization of an old municipal landfill (Glindsted, Denmark) as a groundwater pollution source: landfill history and leachate composition. Waste Manag Res 16:3–13
Koerner RM, Daniel DE (1997) Final covers for solid waste landfills and abandoned dumps. ASCE, Reston
Kolkata Municipal Corporation (2005) Master plan on solid waste management submitted to Kolkata Municipal Corporation under Kolkata environmental improvement project. http://www.keip.in/Images/master_plan.pdf
Kumar D, Alappat BJ (2004) Selection of the appropriate aggregation function for calculating leachate pollution index. ASCE Practice Period Hazard Toxic Radioact Waste 8:253–264
Kumar M, Ramanathan AL, Rao MS, Kumar B (2006) Identification and evaluation of hydrogeochemical processes in the groundwater environment of Delhi, India. Environ Geol 50:1025–1039
LeGrand HE (1964) System for evaluation of contamination potential of some waste disposal sites. J Am Water Works Assoc 56:959–974
Marsh GM, Day R (1991) A model standardized risk assessment protocol for use with hazardous waste sites. Environ Health Perspect 90:199–208
Ministry for the Environment (2004) Risk screening system, contaminated land management guidelines No. 3, Ministry for the Environment, Wellington. www.mfe.govt.nz
MOEF (1989) Hazardous wastes (management and handling) rules. Ministry of Environment and Forests, Government of India, Delhi
MOEF (2000) Hazardous wastes (management and handling) amendment rules. Ministry of Environment and Forests, Government of India, Delhi
MOEF (2000) Municipal solid wastes (management and handling rules). Ministry of Environment and Forest, Delhi, Gazette Part ii, Section 3(ii)
Mor S, Ravindra K, Dahiya RP, Chandra A (2006) Leachate characterization and assessment of groundwater pollution near municipal solid waste landfill site. Environ Monit Assess 118:435–456
MUA (2000) Manual for municipal solid waste management. CPHEEO, Ministry of Urban Affairs, New Delhi
Mukharjee A, Fryar AE, Howell PD (2007) Regional hydrostratigraphy and groundwater flow modeling in the arsenic-affected areas of the western Bengal basin, West Bengal, India. Hydrogeol J 15:1397–1418
National Productivity Council (2003) Hazard potential rating of existing municipal solid waste dump sites. Report submitted to Central Pollution Control Board, New Delhi
National Research Council (1994) Ranking hazardous-waste sites for remedial action. National Academic Press, Washington. http://www.edu/books0309050928/html/index.html
Phillips CR, Nathwani JS (1977) Development of a soil-waste interaction matrix for assessing land disposal of industrial wastes. Water Res 11:859–868
Poulsen TG, Moldrup P, Sorensen K, Hansen JA (2002) Linking landfill hydrology and leachate chemical composition at a controlled municipal landfill (Kastrup, Denmark) using state space analysis. Waste Manag Res 20:445–456
Pujari PR, Deshpande V (2005) Source apportionment of groundwater pollution around landfill site in Nagpur, India. Environ Monit Assess 111:43–54
Pujari PR, Pardhi P, Muduli P, Harkare P, Nanoti MV (2007) Assessment of pollution near landfill site in Nagpur, India by resistivity imaging and GPR’. Environ Monit Assess 131:489–500
Qian X, Koerner RM, Gray DH (2002) Geotechnical aspects of landfill design and construction. Prentice Hall, Upper Saddle River
Rai P (2007) Solid waste management and spatial planning initiatives in metro cities—a case study of Delhi. In: Proc. workshop on solid waste minimisation and environmental geotechnology of disposal in landfill, slurry and old dumps, 12–14 Feb 2007, New Delhi
Rao VVS, Gupta SK (1999) ‘Mass transport modelling to assess contamination of water supply well in Sabarmati River bed aquifer’, Ahmedabad City, India. Environ Geol 39:893–900
RITES Ltd (2005) Environmental impact assessment for phase-II corridors of Delhi Metro. http://www.delhimetrorail.com/corporates/ecofriendly/Chapter203.pdf
Rowe G, Wright G (1999) The Delphi technique as a forecasting tool: issues and analysis. Int J Forecast 15:353–375
Ryan CR (1985) Slurry cut off walls applications in control of hazardous waste. In: Johnson AL et al (eds) Hydraulic barriers in soil and rock, ASTM STP 874. American Society for Testing and Material, Philadelphia, pp 9–23
Sahu P, Sikdar PK (2007) Hydrochemical framework of the aquifers in and around east Kolkata wetlands, West Bengal, India. Environ Geol 55:823–835
Science Applications International Corporation (1990) Washington ranking method scoring manual. Prepared for Washington State Department of Ecology, Toxics Cleanup Program, Olympia, Washington
Schroeder PR, Lloyd CM, Dozier TS, Zappi PA, Aziz NM (1994) The hydrologic evaluation of landfill performance (HELP) model: user’s guide for Version 3. EPA/600/R-94/168a, US Environmental Protection Agency Office of Research and Development, Washington
Sharma HD, Lewis SP (1994) ‘Vertical barriers: slurry walls in waste containment systems, waste stabilisation and landfills’, design and evaluation. Wiley, New York, pp 321–367
Singh M (1998) Review of landfilling practice and costing of a MSW landfill. M Tech Thesis, IIT Delhi
Singh RK, Datta M, Nema AK (2009) A new system for groundwater contamination hazard rating of landfills. J Environ Manag 91:344–357
Singh RK, Datta M, Nema AK (2010) Review of groundwater contamination hazard rating systems for old landfills. Waste Manag Res 28:97–108
Singh SK, Datta M (2010) Raising of dykes of ash slurry pond—a case study. In: Proceedings sixth international congress on environmental geotechnology, New Delhi, vol 1, pp 503–508
Solid Waste Management Board (2001) Indiana scoring model, Indiana Administrative Code (Solid waste management; 329 IAC 7-1-1, readopted filed 2001: 24 IR 1535). http://www.in.gov/legislative/iac/T03290/A00070
USEPA (1990) Hazard ranking system, final rule. Dec 14 1990. http://www.epa.gov/superfund/sites/npl/hrsres/index.htm#HRS%20Rule
USEPA (2003) EPA’s composite model for leachate migration with transformation products (EPACMTP). Technical background document, EPA530-R-03-006. http://www.epa.gov/epaoswer/non-hw/industd/tools/cmtp/tbd_toc3.pdf
Vadillo I, Carrasco F, Andreo B, Garcia de Torres A, Bosch C (1999) Chemical composition of landfill leachate in a karst area with a Mediterranean climate (Marbella, Southern Spain). Environ Geol 37:326–332
Veeraswamy G (2001) Vertical cut off barrier around tailings dam. M Tech Thesis (unpublished), IIT Delhi
Wisconsin Department of Natural Resources (2001) Site discovery, screening and ranking. Chapter NR 710, Wisconsin Administrative Code, Unofficial Text, Register, February, 2001, No. 542. http://www.legis.state.wi.us/rsb/code/nr/nr710.pdf
Wu JS, Hilger H (1984) Evaluation of EPA’s hazard ranking system. J Environ Eng 110:797–807
Xanthakos PP (1994) Vertical Screens. In: Xanthakos PP et al (eds) Ground control and improvement. Wiley, New York, pp 755–826
Acknowledgments
I gratefully acknowledge the guidance and inputs received from my mentors and colleagues at IIT Delhi who have shaped my forays in the world of geotechnology in general and in environmental geotechnics in particular—Prof. Shashi K. Gulhati, Prof. T. Ramamurthy, Prof. A. Varadarajan, Prof. G.V. Rao, Dr. K.K. Gupta, Prof. K.G. Sharma, Prof. K.S. Rao, Prof. G.V. Ramana, Dr J.T. Shahu and Dr. A.K. Nema. I also acknowledge the research work done in the laboratories and in the field by over two dozen masters and doctoral students in the past two decades, which forms the basis of this paper. The support provided by the technical staff of the geotechnical laboratories at IIT Delhi has been vital for the experimental work reported in this paper. I also acknowledge the learning opportunities given to me by various organizations which have involved me in the design and construction of over 25 waste disposal facilities in India (some of which have been reported here) and those which have involved me in framing of various regulatory guidelines and manuals. The liberal funding provided by various agencies for sponsored research has been an important facilitator. The assistance rendered by Dr. S.K. Singh and Dr. Divya of PEC in preparing the paper is acknowledged.
Author information
Authors and Affiliations
Corresponding author
Rights and permissions
About this article
Cite this article
Datta, M. Geotechnology for Environmental Control at Waste Disposal Sites. Indian Geotech J 42, 1–36 (2012). https://doi.org/10.1007/s40098-012-0002-x
Received:
Accepted:
Published:
Issue Date:
DOI: https://doi.org/10.1007/s40098-012-0002-x