
Abstract
Evaluating the cumulative damage of seismic members is an important issue in seismic design. Steel beams are the primary components of seismic moment-resisting frames, wherein the story drift angle and ductility factor with respect to the number of cycles are used as indices of the degree of damage. The former is widely used in the United States and several other countries, whereas the latter is used in Japan. Additionally, these indices are used to express the plastic deformation capacity up to the ultimate state determined by fracture or other failure modes. In this study, an appropriate evaluation method was developed based on the numerical analysis of sub-assemblies for determining the cumulative damage and plastic deformation capacity of steel beams. The analytical results indicate that a unified evaluation is possible based on the relationship between the ductility factor of the beam of each steel grade and the number of cycles to fracture. The proposed method can be used regardless of geometric conditions, except in the case of short-span beams.
1 Introduction
In current seismic design, a moment-resisting frame is designed to form weak-beam-type mechanism under severe earthquakes. Therefore, the plastic deformation capacity of a beam is the most important parameter for the seismic design of steel buildings. Typically, the plastic deformation capacity of a beam subjected to cyclic loading is experimentally examined. It can be expressed considering the relationship between the amplitudes in terms of the story drift, story drift angle or beam rotation, and the number of cycles required to attain the ultimate state determined by the fracture or other failure modes, such as local buckling (e.g., Lee & Stojadinovic, 2004). The cumulative damage index D under random loading amplitudes, such as earthquakes, is evaluated using Miner’s rule, as expressed in Eq. (1).
where \({n}_{i}\) denotes the number of cycles at each amplitude, and \({N}_{i}\) indicates the number of cycles required to reach the ultimate state at each amplitude.
The loading protocol applied in experiments for evaluating the performance of steel members can be controlled using the story drift or story drift angle (e.g., He et al., 2022; Oh & Park, 2016; Somarriba et al., 2022; Zhang & Ricles, 2006). Fig. 1a depicts the schematic of the loading history proposed in FEMA-461 (Federal Emergency Management Agency FEMA (Federal Emergency Management Agency), 2007), which is widely used as a standard loading history for structural experiments to examine seismic performance. This can be controlled by the deformation of the sub-assembly that corresponds to the story drift of buildings. In addition to evaluating the deformation capacity of the beam with respect to the story drift or story drift angle of the sub-assembly, studies have evaluated the same with respect to the deformation or the rotation angle of the beam itself (e.g., Calderoni et al., 2009; Kishiki et al., 2019). Experiments focusing on the deformation capacity of the beam generally maintained the columns in the sub-assembly within the elastic range. In such cases, the rotation angle of the beam was closely associated with the story drift angle of the sub-assembly. Evaluating the cumulative damage and plastic deformation capacity of the beam with respect to the story drift angle of the sub-assembly or the rotation angle of the beam provides a clear understanding of the performance of a section of a building. However, the yield deformation differs for beams with identical cross-sections and different spans. This implies that the degree of damage to the beam can differ despite the same story drift angles of the sub-assemblies. For instance, a short-span beam can yield, whereas a long-span beam can remain in the elastic range under identical story drift angles.

Loading protocols applied in experiments
In Japan, the ductility factor is used for evaluation rather than the story drift angle. The ductility factor is the ratio of the maximum deformation of the system to its yield deformation (Veletsos & Newmark, 1960). This is generally used to express the maximum response of a story. In Japan, it is also used as an index to indicate the maximum deformation of a member (e.g., Mitani et al., 1986; Sawamoto et al., 2020; Takatsuka et al., 2012). The application of the ductility factor to the evaluation of steel members is not limited to Japan. For instance, Ballio and Castiglioni (1995) applied the ductility factor to an experimental study of low-cycle fatigue in steel beams with various cross-sectional shapes.
The ductility factor of a beam is obtained by dividing its deformation or rotation by the elastic deformation or rotation, respectively, corresponding to the plastic moment (Fig. 2). It has been practically used as a target value for structural design in the time-history analysis method. The method is based on the elastic deformation corresponding to the plastic moment defined as unit plastic deformation. Therefore, this method is convenient for the unified evaluation of plastic deformation capacity and cumulative damage of beams with different spans and cross-sectional depths. In Japan, the standard loading history used for cyclic loading tests of steel members is based on the ductility factor, as schematically depicted in Fig. 1b (Building Research Institute [BRI] and the Japan Iron and Steel Federation [JISF], 2002). However, this is not directly associated with the story drift angle of the building.

Definition of the ductility factor of a beam
Numerous studies have analyzed the plastic deformation capacity of steel beams subjected to cyclic loading (e.g., He et al., 2022; Kishiki et al., 2019; Oh & Park, 2016; Somarriba et al., 2022; Zhang & Ricles, 2006). These studies presupposed the use of a specific index, such as the story drift angle or ductility factor. However, to the best of our knowledge, the evaluation indices have not been investigated to date. It is important to examine the damage indices of steel beams used as seismic members in the United States and Japan, where a high risk of earthquakes exists and several steel buildings have been built over the years.
To develop an appropriate method for evaluating the plastic deformation capacity and cumulative damage of steel beams, this study performed a series of numerical analyses of the sub-assembly. The span length of the sub-assemblies, cross-sectional height of the beams, steel grades, and loading histories were used as parameters during the analysis. Based on the analytical results, the relationship of the story drift angle and ductility factor of the beam with the strain of the beam flange at the critical section was examined. The strain of the beam flange at the critical section governed the ductile failure, which is a typical failure mode of steel beams subjected to seismic loads. Subsequently, an appropriate index was determined for evaluating the cumulative damage on steel beams subjected to cyclic loading.
2 Numerical Analysis of Sub-assemblies
2.1 Analytical Model
Figure 3a illustrates the sub-assembly, comprising the H-section beam and column, used for the analysis. The beam–column followed a typical Japanese shop-welding type connection; herein, the flange of the beam was connected by a complete joint penetration groove welding, the web of the beam was connected by fillet welding, and the current Japanese type of weld access hole (AIJ (Architectural Institute of Japan), 2018) existed in the connection. The parameters of the model were the geometry of the beam and steel grade. Table 1 lists the analytical models used in this study. In the case of beam geometry, the span length L and height of the cross-section hb were selected as parameters. The different for steel grades considered were 400 N/mm2 class structural steel (SN400; JIS (Japanese Industrial Standards) G 3136, 2012), 490 N/mm2 class structural steel (SN490; JIS, 2012), and 590 N/mm2 class high-performance structural steel (SA440; JISF, 2004). Figure 3b depicts the stress–strain relationships of steel, including those of SN400 (Jiao et al., 2011), SN490 (Tenderan et al., 2019), and SA440 (Yamada et al., 2020). During the analysis, an external force was applied to the free end of the beam as a shear force.

Analytical model
2.2 Analytical Method
The in-plane analytical method reported in a previous study (Yamada & Jiao, 2016) was adopted for the investigation. The moment–curvature relationship (M–ϕ) of a beam cross-section was derived using the internal force balance, assuming a plane cross-section (Fig. 4a). Subsequently, the load–deformation relationship of the beam (M–θ) was obtained by integrating the moment–curvature relationship along the beam span and adding the rotation angle caused by the shear force (Fig. 4b).

Analytical method
Figure 4c shows the details of the beam end of the analytical model. The flange of the beam was divided into 5 elements in the plate thickness direction, whereas the web was divided into 33 elements in the height direction. Furthermore, the beam was divided into 10-mm-long elements in the longitudinal direction. Two rectangular void areas were set at the weld access holes at the beam end, and the weld metal was modeled as an elastic element for overmatch welding.
This analysis method was used with the steel hysteresis model (Sect. 2.3 and “Appendix 1”), and the behavior of a steel beam was reproduced under cyclic loading, including the strain history (“Appendix 2”).
2.3 Hysteresis Model of Steel
A multi-linear hysteresis model of structural steel was adopted for the analysis of SN400 and SN490 (Yamada & Jiao, 2016) and SA440 (Yamada et al., 2020), considering the Bauschinger effect. The hysteresis model comprised a skeleton curve and the Bauschinger part, which was modeled as bilinear based on the experimental data of cyclic loading tests on steel elements. The skeleton curve indicated the true stress–true strain relationship derived from the coupon test results, assuming a constant material volume. Appendix 1 introduces the outline of the model. Figure 5 depicts an example of the model in comparison with the stress–strain relationship of SN400 obtained in a cyclic loading test (Yamada & Jiao, 2016). Additionally, the figure compares the relationship between cumulative strain and dissipated strain energy; the model concurred with the experimental results.

Hysteresis of steel (Yamada & Jiao, 2016)
3 Examination of the Indices
3.1 Observation of Damage on the Beam
This section explains an appropriate method for evaluating the cumulative damage and plastic deformation capacity of steel beams based on the analytical results. Generally, fractures at the beam end are typical failure modes of steel beams during severe earthquakes. Therefore, the strain of the beam flange in the critical section was analyzed (Fig. 6). The critical section represented the cross-section at the toe of the weld access hole, which was the starting point of the fracture. During the analysis, the strain of the flange at the critical section was output and used for the examination.

Critical section of the beam
3.2 Damage Evaluation of Beam Under Monotonic Loading
3.2.1 Damage on the Beam with Different Geometric Conditions
The difference in the geometric conditions of the cantilever beam can be represented by the ratio of the section height to the span length (L/H). Figure a shows the load–deformation relationship of sub-assemblies with different span lengths. Figure 7b and c depict the relationship of the strain of the flange in the critical section (\(\varepsilon_{cf}\)) with the story drift angle (\(\Theta\)) and ductility factor of the beam (\(\mu\)), respectively.

Analytical results of beams with different geometric conditions
In the case of the story drift angle (\(\Theta\)), the longer the span, the smaller the strain of the flange in the critical section. This can be attributed to the relationship between bending stiffness and beam length. Although the story drift angle expresses the normalized deformation of the building, geometric conditions, such as span, must be within the same range to represent the damage level of each beam.
By contrast, the strain of the flange in the critical section was nearly identical to the ductility factor of the beam (\(\mu\)), except for the short-span model (L = 2 m), wherein the shear deformation was relatively large. The strong correlation between the ductility factor of the beam and strain of the flange in the critical section can be explained as follows. For steel beams with identical cross-sections, the moment–curvature relationship of the cross-section was the same. Bending deformation was obtained by integrating the curvature in the longitudinal direction. Therefore, in the case of cantilever steel beams with identical cross-sections subjected to the same end moment, the rotation angle caused by bending (\({\theta }_{b}\)) was proportional to the span length (L). Conversely, the rotation angle caused by shear (\({\theta }_{s}\)) was proportional to the shear; therefore, the angle was inversely proportional to the span length (L) for the same end moment. The bending and shear deformation components of \({\theta }_{p}\) (definition of \({\theta }_{p}\) was shown in Fig. 2) can be expressed as \(\theta_{pb}\) and \(\theta_{ps}\), respectively, and the ductility factor of the beam (μ) can be calculated as \(\mu = \left( {\theta_{b} + \theta_{s} } \right)/\left( {\theta_{pb} + \theta_{ps} } \right)\). When the span was long, the ratio of the bending deformation to the rotation angle increased, and the ductility factor of the beam was close to \(\theta_{b} /\theta_{pb}\). As both \(\theta_{b}\) and \(\theta_{pb}\) are proportional to the span length (L), the value of the ductility factor (μ) was less susceptible to the span length when the bending deformation was dominant. The comparison of sub-assemblies with different geometric conditions indicated that the ductility factor of the beam adequately represented the damage level, except in the case of short spans.
3.2.2 Damage on the Beam with Different Steel Grades
Figure 8a depicts the load–deformation relationship of sub-assemblies with different steel grades. Figure 8b and c show the relationships of the strain of the flange in the critical section (\({\varepsilon }_{cf}\)) with the story drift angle (\(\Theta\)) and ductility factor of the beam (\(\mu\)), respectively.

Analytical results of beams with different steel grades
When the story drift angle was approximately 0.04 rad, the strain of the flange in the critical section was close value regardless of the steel grade. Additionally, the story drift angle adequately expressed the damage level of the beam regardless of the steel grade under identical geometric conditions of the sub-assemblies when the angle was maintained within the range of 0.04 rad. This is explained further in Sect. 3.3 based on the analytical results of the cyclic loading. The obtained results indicated that the deformation of the beam was less susceptible to the difference in the shape of the stress–strain relationship when only a limited range of the beam end yielded. Conversely, the ductility factor of the beam exhibited a different relationship for each steel grade with respect to the strain of the flange in the critical section.
3.2.3 Effect of Span Length on the Damage Evaluation Based on the Ductility Factor of the Beam
As stated in Sect. 3.2.1, a strong correlation exists between the ductility factor of the beam and the strain of the flange in the critical section, except in the case of the short-span models. This section examines the effect of span length on the damage evaluation based on the ductility factor of the beam. Figure 9 depicts the strain of the flange in the critical section (\({\varepsilon }_{cf}\)) when the ductility factor of the beam \(\mu\) = 5. For simplicity, the strain was normalized by considering the average value of L/H in the range of 10–20. Regardless of the steel grade, the strain of the flange in the critical section significantly increased with the decrease in L/H when L/H < 5. The limitation of the damage evaluation based on the ductility factor of the beam was five or more in the same L/H range. When L/H < 5, the influence of shear deformation on the ductility factor of the beam increased; this implied that it was unsuitable for a unified evaluation of the damage on steel beams based on the ductility factor of the beam.

Strain of the flange in the critical section at \(\mu =5\)
3.3 Damage Evaluation of the Beam Under Cyclic Loading
To examine an adequate method for evaluating the cumulative damage and plastic deformation capacity of steel beams, a series of numerical analyses was performed on the sub-assemblies subjected to cyclic loading. The analyses considered a constant amplitude with story drift angles of 0.02, 0.03, 0.04, and 0.05 rad. Figure 10 shows the load–deformation relationship between the sub-assembly and the history of the strain of the flange in the critical section (\({\varepsilon }_{cf}\)). The amplitude of the story drift angle of the sub-assembly was constant; however, the amplitude of the strain in the first cycle was larger than that in the subsequent cycles. This is because the strain amplitude was affected by the yield-point elongation in the first cycle.

Load–deformation relationship between the sub-assembly and history of the strain of the flange in the critical section (H-600 × 250 × 12 × 25, SN490, L = 6 m, 0.02 rad)
The damage level of the beam was evaluated based on the strain amplitude of the flange in the critical section (Jiao & Yamada, 2020). The cumulative damage index D of the beam can be calculated using Eq. (2) and Miner’s rule. The analysis was terminated when D = 1, and the number of cycles to fracture Nf was calculated.
where \(\Delta \varepsilon\) indicates the strain amplitude of the flange in the critical section.
Equation (2) was obtained from the experimental and analytical results for steel beams composed of 400 and 490 N/mm2 class structural steel. Typically, the relationship of structural steel as a material between the strain amplitude and number of cycles to fracture remains the same regardless of the steel grade (Ono et al., 2000; Touch et al., 2021). Therefore, this study assumed that Eq. (1) can be applied to SA440, which is high-performance structural steel of 590 N/mm2 class.
Figure 11 depicts the relationship between the number of cycles to fracture and story drift angle. Despite identical geometric conditions, SA440 exhibited a different relationship than SN400 and SN490. Based on the analytical results of the monotonic loading discussed in Sect. 3.2.2, the geometric conditions of the sub-assemblies were assumed to be identical and the story drift angle was approximately the same; the story drift angle accurately represented the damage level of the beam regardless of the steel grade. However, the range of amplitude that could be evaluated as comprising an identical number of cycles to fracture for different steel grades was extremely narrow and impractical under cyclic loading conditions. This can be attributed to the difference in the stress–strain relationship between each steel grade, which appeared as a difference in the strain amplitude in the first and subsequent cycles of the strain history (Fig. 10).

Relationship between the number of cycles to fracture and story drift angle (L/H = 10)
Figure 12 illustrates the relationship between the number of cycles to fracture and ductility factor of the beam; the cases of D reaching 1.0 in the first cycle are not plotted. A linear relationship was observed between the ductility factor of the beam of each steel grade and the number of cycles to fracture regardless of the geometric conditions, except for the short-span cases, where L/H < 5. When the bending deformation was dominant (L/H ≥ 5), the plastic deformation capacity and cumulative damage of the beams were evaluated for each steel grade by considering the relationship between the ductility factor of the beam and the number of cycles to fracture. However, when the effect of shear deformation was significant on the ductility factor of the beam (L/H < 5), it does not serve as a suitable index for evaluating the cumulative damage on the steel beam.

Relationship between the number of cycles to fracture and ductility factor of the beam
4 Conclusions
To determine an appropriate method for evaluating the plastic deformation capacity and cumulative damage of steel beams, a series of numerical analyses was performed on the sub-assemblies of steel. The analytical models considered sub-assemblies with different span lengths, cross-sectional heights, and steel grades. The analysis was performed under both monotonic and cyclic loading conditions. The conclusions of the study can be summarized as follows.
-
1.
The story drift angle can be used to express the normalized deformation of a building. However, the relationship between the strain of the flange at the critical section of the beam and the story drift angle under the same cross-section and steel grade conditions indicated that the longer the span, the smaller the flange strain. Therefore, to consider the story drift angle as an index of the damage caused to the beam, geometric conditions such as the cross-section and span must be within the same range to ensure that the story drift angle can represent the degree of damage caused to each beam. The relationship between the bending stiffness and beam length was the basis for this analysis. Moreover, when sub-assemblies with identical geometric conditions were subjected to cyclic loading, different relationships were observed between the cumulative damage to the flange at the critical section of the beam and the loading amplitude expressed by the story drift angles of different steel grades. Therefore, the story drift angle cannot serve as a practical index for evaluating the cumulative damage to beams under various conditions.
-
2.
Although the ductility factor of the beam was not directly associated with the deformation of the building, it exhibited a strong correlation with the strain of the flange in the critical section. In the case of sub-assemblies with identical cross-sections and steel grades, the strain of the flange in the critical section was nearly constant with the same ductility factor of the beam, except for the short-span model (L/H < 5), wherein the shear deformation was relatively large. The comparison of sub-assemblies with different geometric conditions and identical steel grades indicated that the ductility factor of the beam adequately represented the damage level, except for short spans. This can also be applied to the case of cyclic loading.
In summary, the ductility factor of the beam can be used to perform a unified evaluation of the damage caused to the beam when the bending deformation is dominant, regardless of the cross-section and span. However, the columns and panels in this study were maintained within the elastic range. Typically, the deformation of the beam is also affected if the panel yields. Additionally, in the case of a column with a hollow square section, the strain on the beam-end flange is affected by the moment transfer efficiency of the web. This implies that if the boundary conditions or the varying steel grades affect the ductility factor of the beam when it is used as an index, the evaluation should be performed individually. Furthermore, the method of evaluating the damage caused to steel beams when the shear deformation is dominant should be considered in future studies.
Code availability
Custom code was used for the calculations performed.
References
AIJ (Architectural Institute of Japan) (2018). Structural steelwork specification for building construction JASS6.
Ballio, G., & Castiglioni, C. A. (1995). A unified approach for the design of steel structures under low and /or high cycle fatigue. Journal of Constructional Steel Research, 34(1), 75–101. https://doi.org/10.1016/0143-974X(95)97297-B
BRI (Building Research Institute) and JISF (the Japan Iron and Steel Federation) (2002). Study on testing method for structural performance evaluation of steel structures.
Calderoni, B., Martino, A., Formisano, A., & Fiorino, L. (2009). Cold formed steel beams under monotonic and cyclic loading: experimental investigation. Journal of Constructional Steel Research, 65(1), 219–227. https://doi.org/10.1016/j.jcsr.2008.07.014
FEMA (Federal Emergency Management Agency) (2007). Interim testing protocols for determining seismic performance characteristics of structural and nonstructural components, FEMA-461.
He, X., Chen, Y., Ke, K., Shao, T., & Yam, M. C. (2022). Development of a connection equipped with fuse angles for steel moment resisting frames. Engineering Structures, 265, 114503. https://doi.org/10.1016/j.engstruct.2022.114503
Jiao, Y., Yamada, S., Kishiki, S., & Shimada, Y. (2011). Evaluation of plastic energy dissipation capacity of steel beams suffering ductile fracture under various loading histories. Earthquake Engineering & Structural Dynamics, 40(14), 1553–1570. https://doi.org/10.1002/eqe.1103
Jiao, Y., & Yamada, S. (2020). Low-cycle fatigue Behavior of Japanese steel beam-to-column connections. In: Proceedings of 17WCEE, Paper No. C003821, 2020.
JIS (Japanese Industrial Standards) G 3136 (2012). Rolled steels for building structure.
JISF (the Japan Iron and Steel Foundation) (2004). High performance 590 N/mm2 steel for building structures (SA440), JISF Specification No. MDCR 0013–2004. (in Japanese)
Kishiki, S., Lee, D. S., Yamada, S., Ishida, T., & Jiao, Y. (2019). Low-cycle fatigue performance assessment of current Japanese steel beam-to-column connections determined by ductile fracture. Engineering Structures, 182, 241–250. https://doi.org/10.1016/j.engstruct.2018.12.061
Lee, K. & Stojadinovic, B. (2004). Low-cycle fatigue limit on seismic rotation capacity for US steel moment connections. In: Proceedings of the 13th world conference on earthquake engineering, paper no. 90.
Mitani, I., Hamasaki, T., Hayashihara, K., & Imakado, K. (1986). Effects of axial load and end-moment ratio on plastic rotation capacity of H-shaped steel beam-columns subjected to unequal end-moments. Journal of Structural and Constructional Engineering Transactions of AIJ, 370(69), 80. in Japanese.
Oh, S. H., & Park, H. Y. (2016). A study to enhance the deformation capacity of beam-to-column connections using high strength steel having high yield ratio. International Journal of Steel Structures, 16(1), 73–89. https://doi.org/10.1007/s13296-016-3007-y
Ono, T., Kako, Y., Sato, A., & Iwata, M. (2000). A study on low cycle fatigue characteristics of metallic material. Journal of Structural and Constructional Engineering, Transactions of AIJ, 532, 193–199. in Japanese.
Sawamoto, Y., Kubota, J., & Ohsaki, J. (2020). Evaluation on plastic deformation capacity of steel beam ends with local buckling and fracture under cyclic loading using FE analysis. Journal of Structural and Constructional Engineering, 85(767), 105–115. in Japanese.
Somarriba, M., Okazaki, T., Zhao, J., & Komatsu, K. (2022). Cyclic-loading performance of steel beam-to-column moment connections to an I-section column. Journal of Structural Engineering, 148(4), 04022025. https://doi.org/10.1061/(ASCE)ST.1943-541X.0003310
Takatsuka, K., Manabe, Y., Suita, K., Tanaka, T., Tsukada, T., & Su, Z. (2012). Effect of weld access hole on deformation capacity, Deformation capacity of welded beam-to-column connection subjected to repeated plastic strain Part 2. Journal of Structural and Constructional Engineering, Architectural Institute of Japan, 77(673), 453–459. in Japanese.
Tenderan, R., Ishida, T., Jiao, Y., & Yamada, S. (2019). Seismic performance of ductile steel moment-resisting frames subjected to multiple strong ground motions. Earthquake Spectra, 35(1), 289–310. https://doi.org/10.1193/111217EQS235M
Touch, T., Jiao, Y., Yamada, S., Ishida, T., & Kishiki, S. (2021). Experimental study on fatigue characteristics of structural steel, part 3: Deformation capacities of various structural steels under large strain amplitudes, summaries of technical papers of annual meeting, AIJ.
Veletsos, A. S., & Newmark, N. M. (1960). Effect of inelastic behavior on the response of simple systems to earthquake motions. In: Proceedings of the 2nd world conference on earthquake engineering, pp. 895–912.
Yamada, S., & Jiao, Y. (2016). A concise hysteretic model of structural steel considering the Bauschinger effect. International Journal of Steel Structures, 16(3), 671–683. https://doi.org/10.1007/s13296-015-0134-9
Yamada, S., Jiao, Y., Lee, D. S., Ishida, T., & Kishiki, S. (2020). A concise hysteretic model of 590 N/mm2 grade high performance steel considering the Bauschinger effect. International Journal of Steel Structures, 20(6), 1979–1988. https://doi.org/10.1007/s13296-020-00401-w
Zhang, X., & Ricles, J. M. (2006). Experimental evaluation of reduced beam section connections to deep columns. Journal of Structural Engineering, 132(3), 346–357. https://doi.org/10.1061/(ASCE)0733-9445(2006)132:3(346)
Funding
This research did not receive any specific grants from funding agencies in the public, commercial, or not-for-profit sectors.
Author information
Authors and Affiliations
Corresponding author
Ethics declarations
Conflict of interest
The authors have no competing interests to declare that are relevant to the content of this article.
Additional information
Publisher's Note
Springer Nature remains neutral with regard to jurisdictional claims in published maps and institutional affiliations.
Appendices
Appendix 1
1.1 Hysteresis Model of Steel (Yamada & Jiao, 2016; Yamada et al., 2020)
Previous studies have reported the details of the hysteresis model of steel (Yamada & Jiao, 2016; Yamada et al., 2020), which can be summarized as follows.
-
The hysteresis curve under cyclic loading of steel was decomposed into the skeleton curve; Fig.
Fig. 13 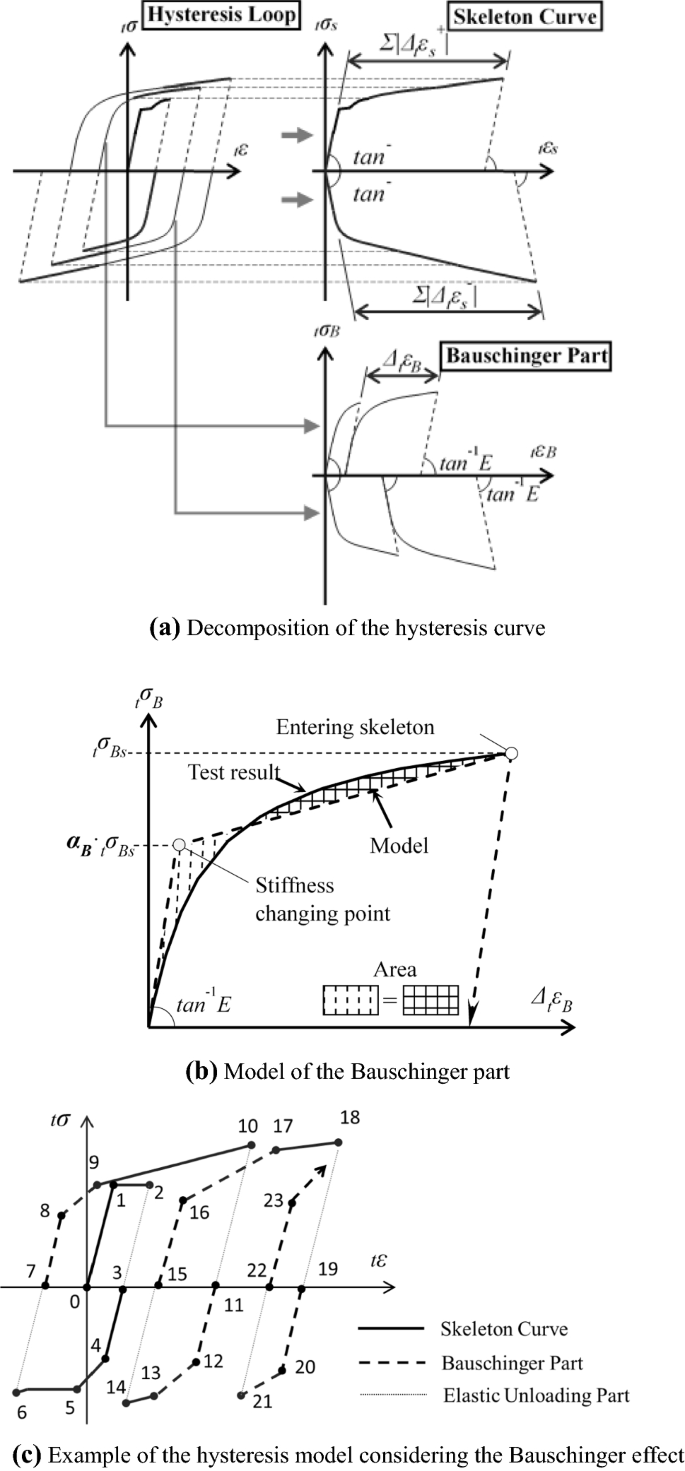
Explanation of the hysteresis model
13a depicts the Bauschinger and the elastic unloading parts.
-
The skeleton curve was formed by sequentially connecting the paths of the loads that exceeded the maximum load attained in the preceding cycle. This was adopted in the hysteresis model as the true stress–true strain relationship derived from the nominal stress–nominal strain relationship of the coupon test using Equations (3) and (4).
$${}_{t}^{{}} \sigma = \left( {1 + {}_{n}^{{}} \varepsilon } \right)\Delta {}_{n}^{{}} \sigma$$(3)$${}_{t}^{{}} \varepsilon = {\text{ln}}\left( {1 + {}_{n}^{{}} \varepsilon } \right)$$(4)where \({}_{t}^{{}} \sigma\) denotes the true stress, \({}_{n}^{{}} \sigma\) indicates the nominal stress, \({}_{t}^{{}} \varepsilon\) represents the true strain, and \({}_{n}^{{}} \varepsilon\) denotes the nominal strain.
-
The Bauschinger parts were softened owing to the Bauschinger effect and modeled as bilinear (Fig. 13b). The model involves stress when entering the skeleton curve (\({}_{t}^{{}} \sigma {}_{Bs}^{{}}\)), elastic stiffness (E), plastic strain increments in each cycle of the Bauschinger part (\(\Delta {}_{t}^{{}} \varepsilon {}_{B}^{{}}\)), and stress of the stiffness changing point (\({}_{t}^{{}} \sigma {}_{E}^{{}}\)). Among them, \({}_{t}^{{}} \sigma {}_{Bs}^{{}}\) was set as the maximum stress from the preceding cycle, and \(\Delta^{{}} \varepsilon_{B}^{{}}\) can be calculated using Equations (5) and (6).

In the case of 400 and 490 N/mm2 class structural steel
For 590 N/mm2 class structural steel,
Here, \(\sum \Delta \varepsilon\) denotes the cumulative plastic strain of the skeleton curve.
The stress of the stiffness changing point of the Bauschinger part (\(_{t} \sigma_{E}\)) can be calculated using Equation (5).
For 400, 490, and 590 N/mm2 class structural steel,
Figure 13c depicts an example (tensile start) of the hysteresis to understand the model.
-
The compressive side of the first cycle was considered as the skeleton curve owing to the initial compressive stress experienced by the steel material (loop 3–6 in Fig. 13c). The softening caused by the plastic strain in the tensile side was considered by adopting the bilinear model of the Bauschinger part (loop 4–5 in Fig. 13c).
-
The entering and unloading points in the skeleton curve were reset each time when the hysteresis loop entered a skeleton curve and remained unchanged until the loop entered the subsequent skeleton curve fragment. (loops 0–2, 3–6, 7–10, 11–14, and 15–18 in Fig. 13c).
-
In the case of unloading within the plastic region of the Bauschinger part, the plastic region moved to the subsequent entering point of the skeleton curve before unloading (point 23 in Fig. 13c, which moves toward point 18).
Appendix 2
2.1 I Comparison of Analytical and Experimental Results of Beams Subjected to Cyclic Loading (Jiao & Yamada, 2020)
The analytical method proposed in this study can reproduce the behavior of the steel beam under cyclic loading, including strain history, by adopting the steel hysteresis model described in Sect. 2.3 and Appendix 1. The analytical and experimental results are compared in this Appendix. The experimental data used for the comparison were obtained from the cyclic loading tests of H-section steel beams connected to thick end plates (Tenderan et al., 2019). Figure

Comparison of analytical and experimental results
14a depicts the shape of the specimen. The details of the beam end connection are identical to those of the typical Japanese shop-welding type incorporated in the analytical model in this study. The steel grade of the beam was 490 N/mm2 (SN490; JIS, 2012). The experiment was performed under constant deformation amplitude conditions. Figure 14b illustrates a comparison of the analytical and experimental results of the load–deformation relationships. Additionally, the measurements of the plastic strain gauges on each flange were compared with the nominal analytical strain history results at the same position, as indicated in Fig. 14c. The experimental strain value of the flange was the average value of the gauges attached to the flange section. In addition to the load–deformation relationships and strain histories of the beam flange, the analytical results concurred with the experimental results.
Rights and permissions
Springer Nature or its licensor holds exclusive rights to this article under a publishing agreement with the author(s) or other rightsholder(s); author self-archiving of the accepted manuscript version of this article is solely governed by the terms of such publishing agreement and applicable law.
About this article

Cite this article
Yamada, S., Jiao, Y. Damage Evaluation Method for Steel Beams Subjected to Cyclic Loading. Int J Steel Struct 22, 1850–1863 (2022). https://doi.org/10.1007/s13296-022-00673-4
Received:
Accepted:
Published:
Issue Date:
DOI: https://doi.org/10.1007/s13296-022-00673-4