
Abstract
Estimation of rock burst grades is an important basis for rock burst prevention measures, and the AE (acoustic emission) features of rocks could reflect the rock burst grades. Taking a railway tunnel in western China as an example, the original rock cores with different rock burst grades were obtained by core drilling method; the cylindrical specimens in a diameter of 50 mm with a height of 100 mm were made from different directions (transverse, oblique, longitudinal) of the original rock cores. The AE features of different directions specimens during indoor uniaxial compression test were obtained. Using the ratio of the cumulative AE energy Eq before the main fracture to the cumulative AE energy E after the final fracture of specimens in different directions, the corresponding new methods for estimating the rock burst grade were proposed respectively; the estimation results were compared with the actual rock burst grades and the estimation results of the traditional rock burst estimation methods. It shows that the estimation accuracy of the method based on Eq/E of specimens in different directions reaches 80%, which is in good agreement with the actual rock burst grades; compared with the traditional rock burst estimation methods, the estimation results of Eq/E-based rock burst estimation methods are more reliable; when Eq/E of specimens in different directions is used to estimate rock burst grades, the reliability of the estimated results from high to low is longitudinal, oblique, and transverse specimen. The results presented herein are important for the prevention and control of rock burst.
Introduction
At present, estimation of rock burst grades is an urgent problem to be solved, and the complexity of rock burst itself brings great difficulties to the rapid and accurate estimation of rock burst grades (Zhang 2012). Rock damage cracks often occurred and expanded with the increase of load, and the AE (acoustic emission) features of rocks during this process could reveal rock burst grades. Therefore, the estimation of rock burst grades based on the AE features in rocks was conducted, which is of great significance to the prevention and control of tunnel rock burst in high in-situ stress area.
Furthermore, many researchers tried to use the AE technique to analyze the rock burst activity. For example, Yang and Wang (2005) studied the mechanism of rock burst by using AE technique, and classified the corresponding relationship between lithology and rock burst types based on AE features; Cho et al. (2005) carried out AE simulation tests during rock loading failure process; Zhao et al. (2005) used AE positioning technology to study the three-dimensional evolution process of internal crack initiation, expansion, nucleation and coalescence during the deformation and failure process of granite specimens with different prefabricated cracks under uniaxial loading, and analyzed the features of rock AE activities. Miao et al. (2009) based on the different AE feature parameters in the process of granite rock burst, concluded that the high-frequency and low-amplitude wave generated in the process of rock burst corresponds to the tensile crack, and the low-frequency and high-amplitude wave corresponds to the shear crack; He et al. (2010) and Tan et al. (2000) respectively studied the AE features in the process of rock failure and proposed the rock burst disaster theory based on AE monitoring and early warning; Zhao et al. (2012) and Lu et al. (2008) respectively discussed the mechanism of rock burst from the aspects of spectrum evolution law of micro-seismic signals and the relationship between energy level and frequency; Zhang et al. (2015) found that the cumulative acoustic emission energy of medium rock burst is much higher than that of low rock burst; Liu et al. (2016) considered that the AE law of rock during uniaxial and tri-axial compression tests was basically the same, and proposed that the cumulative ringing count of AE could be applied to the estimation of rock burst grade; Zhang et al. (2017) proposed a real-time estimation method of rock burst based on AE experimental data of rock burst and BP (back propagation) neural network; Wang et al. (2020) established the evolution model of dominant frequency entropy based on the distribution features of AE dominant frequency and information entropy theory, and proposed that the relative maximum point of dominant frequency entropy could be regarded as the key point of rock burst estimation; Mei et al. (2019) analyzed acoustic emission features of marble in the process of rock burst; Hu et al. (2019) used acoustic emission technology to collect acoustic emission signals of granite in the process of rock burst, and quantitatively studied the fracture mechanism of rock burst; Wang et al. (2019) analyzed the evolution characteristics of cracks in granite specimens during strain rock burst tests based on AE technique; Sun et al. (2019) explored the relationship between acoustic emission features of different types of rocks and rock burst tendency; Dou et al. (2020) proposed an intelligent warning mode of rock burst grade based on acoustic emission technique.
However, there are few studies on the estimation of different rock burst grades (no, slight, medium, strong and severe) based on the AE features of rocks. Besides, the influence of different cutting directions (longitudinal, oblique and transverse) on the estimation of rock burst grades was usually ignored. Considering that the AE features of rocks are closely related to the rock burst grades and the rocks with higher rock burst grade tend to release more energy under uniaxial compression (Shang et al. 2011), the cumulative AE energy of rocks was proposed to be selected as the key parameter for estimating rock burst grades. Taking a tunnel in western China as an example, the original rock cores of rock mass were obtained by core drilling method in 24 zones with different rock burst grades. According to the results of AE test, the new methods for estimating rock burst grades were proposed based on the ratio of accumulated AE energy Eq before the main fracture to accumulated AE energy E after the final fracture, and the estimation results were compared with the actual rock burst grades and the estimation results of the traditional rock burst estimation methods.
Process of acoustic emission test
Preparation of rock specimens
Rock specimens were taken from 24 rock burst zones with different rock burst grades in a tunnel of western China. Figure 1 shows the zones with different rock burst grades.

Zones with different rock burst grades. (a) Rock burst 1. (b) Rock burst 2. (c) Rock burst 3. (d) Rock burst 4. (e) Rock burst 5. (f) Rock burst 6. (g) Rock burst 7. (h) Rock burst 8. (i) Rock burst 9. (j) Rock burst 10. (k) Rock burst 11. (l) Rock burst 12. (m) Rock burst 13. (n) Rock burst 14. (o) Rock burst 15. (p) Rock burst 16. (q) Rock burst 17. (r) Rock burst 18. (s) Rock burst 19. (t) Rock burst 20. (u) Rock burst 21. (v) Rock burst 22. (w) Rock burst 23. (x) Rock burst 24
The preparation of rock specimens is shown in Fig. 2. The original rock cores retrieved from the site were cylindrical cores with an outer diameter of 130 mm. The original rock cores were processed into cylindrical specimens with height and diameter of 100 mm and 50 mm in three directions, and the three directions are 0° (longitudinal), 45° (oblique), and 90° (transverse) of the specimen axis and the original core axis, respectively. The surface of the specimen needs to be polished to ensure that there are no obvious cracks.

Specimen preparation. (a) Drilling. (b) Cutting direction. (c) Standard specimen size
Loading mode
The mechanical properties of rocks obtained by field test methods are often more reliable than those obtained by laboratory tests (He et al. 2019). However, considering the actual construction situation of the tunnel and the limitation of the test equipment, the laboratory test method was adopted to investigate the rock burst in this study. Laboratory uniaxial compression and AE tests were carried out on standard specimens. During the test, displacement control method was adopted to carry out uniaxial graded loading: The first-stage loading rate was 0.1 mm/s (loading to 20kN), the second-stage loading rate was 0.15 mm/s (loading to 150kN), the third-stage loading rate was 0.05 mm/s (loading to 250kN), and the fourth-stage loading rate was 0.05 mm/s (loading to failure). After each stage was loaded, 45 s was maintained. The loading method is shown in Fig. 3.

Loading mode
As shown in Fig. 4, the equipment used in the test was rock hydraulic servo testing machine and PXDAQ1672G AE testing system.

Outline of AE testing system. (a) AE test platform. (b) Sensor position
Procedures for AE testing
The testing process of AE is briefly described below:
-
(a)
Specimen preparation (see Fig. 5). Processing the original rock cores into specimens with different directions, and recording the basic information (such as specimen name, number, size, etc.).
Fig. 5 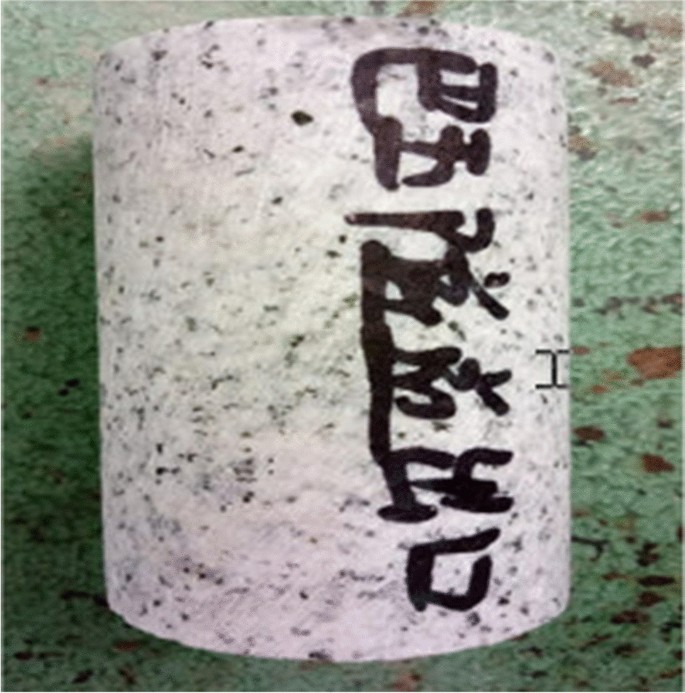
Original AE specimen
-
(b)
Set parameters. Set the pre-gain of the amplifier to 40 dB, the threshold to 55 dB, and the sampling rate for each channel to 10MS/s. The high pass and low pass of analog filter are 100 kHz and 200 kHz respectively, and the lower limit and upper limit of digital filter are 200 K and 400 K respectively. Set the parameters of network transmission data to ensure that the data could be transferred to the computer during the whole test. Open the AE acquisition instrument and start collecting test data.
-
(c)
Installation of AE sensors (see Fig. 6). Two sensors are fixed on the left and right sides of the specimen respectively. Acoustic coupling agent is applied to the contact surface of the AE sensors and the specimen. The AE sensor, acquisition instrument and console were connected by using data line.
Fig. 6 
Installation of AE sensors
-
(d)
The specimens were loaded and AE data were collected. After the specimen was preloaded, the pressure exerted on the specimen by the testing machine was kept unchanged, and AE data were collected. During the process of the test, the load is applied at a certain compression rate in stages until the specimen is damaged (see Fig. 7).
Fig. 7 
Appearance of AE specimen failure


Estimation of rock burst grade
Classification of rock burst grades
Using the code for hydropower engineering geological investigation (National Standards Compilation Group of People’s Republic of China, 2016), the rock burst grades were divided into five classes: no rock burst, slight rock burst, medium rock burst, strong rock burst and severe rock burst. Rock burst classification criteria are shown in Table 1.
As shown in Table 1, five parameters, i.e., motion, sound, aging, impact on construction, and influence depth, were used to comprehensively classify the rock burst grades by the code for hydropower engineering geological investigation (CHEGI), suggested by the National Standards Compilation Group of People’s Republic of China (2016). The rock burst zone 1 was taken as an example to concisely describe the details in estimating rock burst grade. At rock burst zone 1, many large rocks flied out rapidly, accompanied by the rock powder ejection; a strong burst sound was heard; the rock burst lasted for a long time; there is a great influence on the construction of the tunnel; the rock burst pit is distributed continuously with the influencing distances of more than 2 m. Therefore, the rock burst at this zone was determined as the strong rock burst.
Estimation index of rock burst grades
AE test data were collated to obtain AE energy of rock specimens during the process of uniaxial compression. Taking rock burst zone 1 (strong rock burst) as an example, the calculation process of Eq/E predictor of rock burst grades was illustrated. Figure 8 shows the relationship curve between AE energy and loading time of transverse, oblique and longitudinal specimens in rock burst zone 1 respectively.

AE energy of specimens various at different directions. (a) Transverse specimens. (a1) Relationship between AE energy, stress and time. (a2) Relationship between cumulative AE energy, stress and time. (b) Oblique specimens. (b1) Relationship between AE energy, stress and time. (b2) Relationship between cumulative AE energy, stress and time. (c) Longitudinal specimens. (c1) Relationship between AE energy, stress and time. (c2) Relationship between cumulative AE energy, stress and time
As can be seen from Fig. 8, the specimens in different directions behave relatively calm and release few energy before the stress reaches the maximum; when the stress reaches the maximum, the main crack begins to appear, the AE events are relatively active, and the energy of the specimen begins to release rapidly and in large quantities. Accordingly, the time point corresponding to the maximum stress was taken as the moment when the main crack of the specimen began to appear. The ratios of Eq to E of the transverse, oblique and longitudinal specimens were calculated to be 0.0508, 0.1034 and 0.1694, respectively. The Eq/E of other rock burst zones could be obtained by referring to the above method, and the results are shown in Table 2 below.
According to the calculated results of Eq/E values of 22 specimens from different directions in different rock burst zones in Table 1, 16 of them were randomly selected to investigate the actual rock burst situation. Based on the Eq/E values of transverse, oblique and longitudinal specimens, the corresponding estimation methods of rock burst grades were proposed, and the Eq/E values of the remaining 8 rock burst zones were used to verify and analyze the accuracy of the corresponding estimation methods. Taking the transverse specimen as an example, the process of putting forward the estimation method of rock burst grade of specimens was described. Fourteen rock burst zones were randomly selected from Table 2 above and renumbered. The results are shown in Table 3.
As shown in Table 3, among the 16 randomly selected rock burst zones, the numbers of no, slight, medium, strong, and severe rock bursts are 2, 1, 9, 4, and 0, respectively. Since the number of severe rock burst is 0, it is difficult to determine the range of severe rock burst accurately. Considering the convenience of regional division of different rock burst grades, the ratio of Eq to E is set as 0, which is used as a value of severe rock burst. The rock burst estimation method based on the Eq/E of the transverse specimen is shown in Fig. 9.

Eq/E various at different rock burst zone
As shown in Fig. 9, when Eq/E value is greater, the rock burst grade is lighter, while when Eq/E value is smaller, the rock burst grade is heavier. Therefore, four horizontal lines may be used to divide Eq/E into five zones, and the corresponding rock burst grades of these five zones are no rock burst, slight rock burst, medium rock burst, strong rock burst, and severe rock burst. The formation process of these four horizontal boundaries is as follows:
-
(a)
The boundary line between no rock burst and slight rock burst: the number of slight rock burst is only one, and the number of no rock burst is 2. Half of the sum y2 (0.8587) and y16 (0.8603) is taken as the boundary line between no rock burst and slight rock burst, that is, the boundary line y = 0.8587;
-
(b)
The boundary line between slight and medium rock bursts: there is only one slight rock burst and nine medium rock bursts. The value of rock burst zone 2 represents the minimum value of y3 (0.8571) in the medium rock burst zone, while the value of rock burst zone 13 represents the maximum value of y13 (0.7948) in the medium rock burst zone. Half of the sum of y3 and y13 is taken as the boundary value of the two rock burst ranges, that is, the boundary line y = 0.8260;
-
(c)
The boundary line between medium and strong rock burst: the value of rock burst zone 4 represents the minimum value of y4 (0.5833) in the moderate rock burst zone, while the value of rock burst zone 14 represents the maximum value of y14 (0.3225) in the strong rock burst zone. Half of the sum of y4 and y14 is taken as the boundary value of the two rock burst ranges, that is, the boundary line y = 0.4529;
-
(d)
The boundary line between strong and severe rock burst: the value of rock burst zone 3 represents the minimum value of y3 (0.0428) in the medium rock burst zone, and the maximum value of severe rock burst zone is 0. Half of the sum of y3 and 0 is taken as the boundary value of the two rock burst ranges, that is, the boundary line y = 0.0214.
When using Eq/E to estimate the rock burst grades, the ratios of Eq/E are greater 0.8587, 0.8260 to 0.8587, 0.4529 to 0.8260, 0.0214 to 0.4529 and less than 0.0214, respectively corresponding no rock burst, slight rock burst, medium rock burst, strong rock burst and severe rock burst. For the convenience of engineering application, two decimal places were retained and the classification standard of rock burst grade could be simplified as greater 0.86, 0.83 to 0.86, 0.45 to 0.83, 0.02 to 0.45 and less than 0.02. By referring to the above methods, a rock burst grade estimation method based on Eq/E values of specimens in different directions could be obtained. The results are shown in Table 4 below.
In order to verify the accuracy of the three estimation methods of rock burst grade, Eq/E values of the remaining 8 rock burst zones in the corresponding direction were taken for verification respectively, and the results are shown in Table 5.
In Table 5, the comparison between the estimated results of rock burst grade and the actual rock burst grade was carried out, and the results are shown in Table 6 below.
As can be seen from Table 6, the estimation accuracy of rock burst grade based on transverse specimen Eq/E is more than 80%, and the error rate is 12.5%. The estimation results of rock burst grade are basically consistent with the actual rock burst grades. When the rock burst grade estimation method based on transverse specimen Eq/E was used to estimate the rock burst, the estimation result may be overestimated by one grade, the overestimated rate is 12.5%, and there is no case of under-estimated rock burst. The estimation accuracy of rock burst grade based on oblique or longitudinal Eq/E is 100%, and the error rate is 0%. The estimation results of rock burst grade are both consistent with the actual rock burst grades. Compared with the transverse specimen, the estimation results of Eq/E rock burst estimation method based on oblique or longitudinal specimens are more reliable.
Applicability of rock burst grade estimation methods
In order to analyze the applicability of rock burst estimation method based on Eq/E rock burst grade estimation method of specimens in different directions for Eq/E values of specimens in any direction, all the Eq/E values of specimens in three directions were taken as the test data. Taking the rock burst grade estimation method based on transverse specimen Eq/E as an example, the estimation process of the rock burst grade estimation method on the test data was illustrated. The estimation results of the rock burst grade estimation method based on transverse specimen Eq/E for the test data are shown in Table 7.
Using the above method, the estimation results of the test data based on the Eq/E rock burst grade estimation method of oblique and longitudinal specimens could be obtained respectively. The comparison of the estimation results of the test data with the actual rock burst grade by three different estimation methods of rock burst grade was carried out, and the results are shown in Table 8.
As can be seen from Table 8, the rock burst grade estimation method based on Eq/E values of specimens in different directions has a high accuracy of estimating the rock burst grade of the test data, reaching 80%. The accuracy of the estimation results from high to low is longitudinal, oblique, and horizontal in order. The over-estimation rate of Eq/E rock burst grade estimation method based on transverse specimen is close to 10%, which need be paid attention to in engineering application. The over-estimation rate of rock burst grade estimation method based on Eq/E value of longitudinal specimen is 0. Therefore, the estimation method based on Eq/E rock burst grade of longitudinal specimen has good applicability to Eq/E values in different directions. The rock burst grade estimation method based on longitudinal specimen Eq/E values need be given priority in the estimation of rock burst grade. That is, when Eq/E value of specimen in any direction was used for rock burst estimation, the estimation result of rock burst grade estimation method based on longitudinal specimen Eq/E values were more reasonable.
Comparison of prediction methods for different rock burst grades
In order to discuss the reliability of the estimation method of rock burst grade proposed in this study, the Barton’s method (Barton 2002), Rehman’s method (Rehman et al. 2019), Hoek’s method (Hoek and Brown 2019), Tao’s method (Tao 1987), CHEGI’s method (the code for hydropower engineering geological investigation, 2016), He’s method (He et al. 2021) were introduced to estimate the rock burst grades (see Table 9).
In the Table 9, SRF represents stress reduction factor; SRFQ represents modified stress reduction factor; σc represents uniaxial compressive strength; σmax represents maximum in-situ stress; AEF represents the residual elastic energy index.
The above estimation methods of rock burst grade were used to estimate the rock burst grade of the 8 verification points respectively, and the estimation results are shown in Table 10.
The estimation results in Table 5 and Table 10 were compared with the actual rock burst grade, and the results are shown in Table 11.
As can be seen from Table 11, the overestimation rate of the estimation results of CHEGI’s is the maximum, reaching 50%; the accuracy of Barton’s method, Rehman’s method, Tao’s method, and CHEGI’s method was not high, all of which could not reach 80%; in the estimation results of Barton’s method, Rehman’s method, Tao’s method, and CHEGI’s method, there is no underestimation; the estimation results of rock burst based on He’s method are quite different from the actual situation, which may be caused by the inconsistency between the classification criterion of rock burst grades in He’s method and this study; however, the estimation results of rock burst grade estimation method based on Eq/E of specimens in transverse or oblique direction may underestimate the rock burst grade. Compared with other methods, the estimation results of rock burst grade estimation method based on Eq/E of specimens in longitudinal were closer to the actual rock burst grades.
Discussion
-
(1)
AE is induced by crack propagation behavior of rocks under load. Rock with different in-situ stress levels and types usually have different structural features, and the AE features of rocks during deformation and failure are also different. The AE features of rocks could reflect the fracture development process. Taking granite as an example, the differences between specimens in different directions in the process of deformation and failure were described from the aspects of AE energy, accumulated AE energy, initiation and propagation process of cracks and uniaxial compressive strength.
-
(a)
AE energy. The first peak value of AE energy cure of transverse and oblique specimens is small, while that of longitudinal specimens is great and reaches the maximum value; the second peak value of AE energy curves of transverse and oblique specimens reaches the maximum value.
-
(b)
Accumulated AE energy. The first surge of accumulated AE energy cure of transverse specimens is steep, while that of oblique and longitudinal specimens is gentle; the second surge amplitude of transverse and longitudinal specimens is small, while that of oblique specimens is great; the cumulative AE energy of specimens in different directions is longitudinal, oblique and transverse in descending order.
-
(c)
Cracks. The crack angle of the transverse specimen is great, and the crack converges on the upper or lower end face of the specimen; compared with the transverse specimen, the fracture dip angle and the interval between the cracks of the longitudinal specimen is relatively small, and the cracks are approximately parallel; the inclination of oblique specimen cracks is approximately parallel to the specimen axis, and the cracks are relatively dispersed.
-
(d)
Uniaxial compressive strength. The uniaxial compressive strength of specimens in different directions is longitudinal specimen, oblique specimen and transverse specimen in descending order.
-
(a)
In the first AE active stage, large new cracks were generated in transverse and oblique specimens; in the second AE active stage, these new cracks extended through the whole specimen, making the specimen lose its bearing capacity. In the first AE active stage, large new cracks were also generated in the longitudinal specimen, and in the second AE active stage, new large cracks were generated again, and the main cracks were connected so that the specimen lost its bearing capacity. The differences of fracture and uniaxial compressive strength produced by different specimens are closely related to the content and distribution of components, in-situ stress level and structure of rocks.
-
(2)
Sensor 1 and sensor 2 were located at the upper and lower part of the specimen respectively (see Fig. 4). Taking rock burst zone 1 as an example, the comparison of AE test results of specimens in different directions at the two positions was performed.
-
(a)
Transverse specimen
The maximum peak value of AE energy curve of sensor 1 and sensor 2 appeared when and before the specimen began to generate through-cracks and complete failure, respectively; the amplitude of cumulative AE energy curve of sensor 1 is great, while that of sensor 2 is small; the maximum amplitude of sensor 1 and sensor 2 appeared when and before the specimen was destroyed, respectively.
-
(b)
Oblique sample
The variation rules of AE energy and cumulative AE curves of the two sensors are basically the same, but the measured value of sensor 2 is much smaller than that of sensor 1.
-
(c)
Longitudinal sample
The maximum peak value of AE energy curve of sensor 1 occurred when the rock was completely destroyed, while that of sensor 2 appeared before the rock was completely destroyed; the cumulative AE curve of sensor 1 occurred two steep surges, while that of sensor 2 was small and only appeared one steep surge.
-
(a)
Compared with sensor 2, sensor 1 may collect more AE feature information and better reflect the actual deformation and failure process of rocks. Therefore, AE feature information collected by sensor 1 is used to investigate rock burst grade estimation.
-
(3)
Rock burst is induced by the micro-crack propagation and strain energy release of rocks under high in-situ stress, and acoustic energy release is usually accompanied by crack propagation. The properties of energy storage and release are closely related to the process of rock deformation and failure (He et al. 2020). AE activity is an intuitive expression of rock fracture, and the variation rule of AE energy features describes the details of rock deformation and failure process (Jiang et al. 2021). The AE energy feature parameters could be used to characterize the process of rock fracture and instability. Rock burst estimation methods based on Eq/E in different directions may well consider the influence of fracture development and stress state on rock failure characteristics. Compared with the traditional rock burst estimation methods based on rock strength, the rock burst estimation results based on Eq/E in different directions are more reliable and could reflect the actual rock burst situation. Therefore, the AE technique may be an effective method to estimate rock burst grades.
Conclusions
Taking a tunnel in western China as an example, the AE features of specimens in three directions (transverse, oblique and longitudinal) under uniaxial compression were obtained using acoustic emission (AE) technique, the three rock burst grade estimation methods were proposed based on the ratio of accumulated AE energy Eq before the main fracture to accumulated AE energy E after the final fracture. The results showed that:
-
(1)
The Eq/E value was used to subdivide the rock burst grade into no, slight, medium, strong and severe rock burst, and the rock burst grade estimation methods based on Eq/E value of transverse specimen (greater 0.86, 0.83 to 0.86, 0.45 to 0.83, 0.02 to 0.45 and less than 0.02), oblique specimen (greater 0.88, 0.84 to 0.88, 0.32 to 0.84, 0.04 to 0.32 and less than 0.04) and longitudinal specimen (greater 0.95, 0.88 to 0.95, 0.38 to 0.88, 0.07 to 0.38 and less than 0.07) were obtained respectively;
-
(2)
The estimation accuracy of the criteria based on Eq/E of specimens in different directions could reach 80%, and the estimation results are closer to the actual rock burst grade than that of the traditional methods;
-
(3)
When the rock burst grade estimation methods based on specimen Eq/E in different directions are used to estimate the rock burst grade, the accuracy of the estimation results is longitudinal, oblique, and horizontal in order from high to low.
Data availability
The data used to support the findings of this study are available from the corresponding author upon request.
References
Barton N (2002) Some new Q-value correlations to assist in site characterisation and tunnel design. Int J Rock Mech Min Sci 39:185–216. https://doi.org/10.1016/S1365-1609(02)00011-4
Cho SH, Ogata Y, Kaneko K (2005) A method for estimating the strength properties of a granitic rock subjected to dynamic loading [J]. Int J Rock Mech Min Sci 42:561–568. https://doi.org/10.1016/j.ijrmms.2005.01.004
Dou LM, Feng LF, Cai W, Wang H, He HO, Jiao B, Zhang M (2020) Seismo-acoustic precursor identification and comprehensive warning model for the catastrophic failure process of coal and rock. J Min Saf Eng 37(5):960–968. https://doi.org/10.13545/j.cnki.jmse.2020.05.012
He MC, Miao JL, Feng JL (2010) Rock burst process of limestone and its acoustic emission characteristics under true-triaxial unloading conditions. Int J Rock Mech Min Sci 47:286–298. https://doi.org/10.1016/j.ijrmms.2009.09.003
He MM, Zhang ZQ, Ren J, Huan J, Li GF, Chen YS, Li N (2019) Deep convolutional neural networks-based method for strength parameter prediction of jointed rock mass using drilling logging data [J]. Int J Rock Mech Min Sci 123:104084–104084
He MM, Zhang ZQ, Zheng J, Chen FF, Li N (2020) A new perspective on the constant m(i) of the Hoek-Brown failure criterion and a new model for determining the residual strength of rock. Rock Mech Rock Eng 53(9):3953–3967
He MM, Zhang ZQ, Zhu JW, Li N, Li GF, Chen YS (2021) Correlation between the rockburst proneness and friction characteristics of rock materials and a new method for rockburst proneness prediction: field demonstration [J]. J Petrol Sci Eng 205:108997. https://doi.org/10.1016/j.petrol.2021.108997
Hoek E, Brown E (2019) The Hoek-Brown failure criterion and GSI-2018 edition. Journal of Rock Mechanics and Geotechnical Engineering 11(3):445–463. https://doi.org/10.1016/j.jrmge.2018.08.001
Hu XC, Su GS, Chen GY, Mei SM, Feng XT, Mei GX, Huang XH (2019) Experiment on rockburst process of borehole and its acoustic emission characteristics. Rock Mech Rock Eng 52:783–802. https://doi.org/10.1007/s00603-018-1613-z
Jiang RC, Dai F, Liu Y, Li A, Feng P (2021) Frequency characteristics of acoustic emissions induced by crack propagation in rock tensile fracture. Rock Mech Rock Eng 54(4):2053–2065
Liu YY, Miao SJ, Hao X et al (2016) Research into the acoustic emission characteristics of granite under different load conditions and rock burst proneness. China Min Mag 25(s1):397–401. https://doi.org/10.3969/j.issn.1004-4051.2016.z1.094
Lu CP, Dou LM, Wu XR et al (2008) Experimental and empirical research on frequency-spectrum evolvement rule of rockburst precursory microseismic signal of coal-rock. Chin J Rock Mech Eng 28(3):519–525. https://doi.org/10.3321/j.issn:1000-6915.2008.03.011
Mei FD, Hu CY, Li PY, Zhang JS (2019) Study on main frequency precursor characteristics of acoustic emission from deep buried Dali rock explosion. Arab J Geosci 12(21):645. https://doi.org/10.1007/s12517-019-4706-4
Miao JL, He MC, Li DQ (2009) Acoustic emission characteristics of granite under strain rockburst test and its micro-fracture mechanism. Chin J Rock Mech Eng 28(8):1593–1603. https://doi.org/10.3321/j.issn:1000-6915.2000.01.002
National Standards Compilation Group of People’s Republic of China (2016) GB 50287–2016 Code for hydropower engineering geological investigation. Beijing: China Planning
Rehman H, Naji AM, Kim JJ et al (2019) Extension of tunneling quality index and rock mass rating systems for tunnel support design through back calculations in highly stressed jointed rock mass: an empirical approach based on tunneling data from Himalaya. Tunn Undergr Space Technol 85(2019):29–42. https://doi.org/10.1016/j.tust.2018.11.050
Shang XJ, Zhang ZZ, Tian ZL et al (2011) Prediction research of rock burst tendency based on the acoustic emission test. Metal Mine 40(8):56–59
Sun B, Hou SS, Xie JH, Zeng S (2019) Failure prediction of two types of rocks based on acoustic emission characteristics. Adv Civ Eng 2019:5028489. https://doi.org/10.1155/2019/5028489
Tan YL, Li FC, Zhou H et al (2000) Preliminary study on acoustic emission precursor model of rock burst. Chin J Rock Mech Eng 19(4):425–428. https://doi.org/10.3321/j.issn:1000-6915.2000.04.006
Tao ZY (1987) Rock burst in high in-situ stress area and its discrimination. Yangtze River, 18(5): 25 - 32. https://doi.org/10.16232/j.cnki.1001-4179.1987.05.005
Wang CL, Chen Z, Liao ZF et al (2020) Experimental investigation on predicting precursory changes in entropy for dominant frequency of rockburst. J Cent South Univ 27(10):2834–2848. https://doi.org/10.1007/s11771-021-4658-1
Wang Y, He MC, Ren FQ, Zhu C, Faramarzi L (2019) Source analysis of acoustic emissions during granite strain burst. Geomat Nat Haz Risk 10(1):1542–1562. https://doi.org/10.1080/19475705.2019.1593888
Yang J, Wang LJ (2005) Study on mechanism of rock burst by acoustic emission testing [J]. Chin J Rock Mech Eng 24(20):3796–3802. https://doi.org/10.1007/s11769-005-0030-x
Zhang XJ (2012) Pattern and damage evolution of unloading rockburst for high-stress hard rock [J]. Rock Soil Mech 33(12):3554–3560. https://doi.org/10.1007/s11783-011-0280-z
Zhang YB, Yan Z, Yao XL et al (2017) Experimental study of rockburst early warning method based on acoustic emission cluster analysis and neural network identification. Rock Soil Mech, 38(S2): 89-98. CNKI:SUN:YTLX.0.2017-S2–013
Zhang ZJ, Ji HG, Zhang YZ et al (2015) Rockburst research of Lingnan gold mine based on acoustic emission test and linear elastic energy criterions. Chinese J Rock Mech Eng 34(S1):3249–3255. https://doi.org/10.13722/j.cnki.jrme.2014.0432
Zhao XD, Tang CN, Li YH et al (2005) Prediction method of rock burst based on microseismic monitoring and stress field analysis. Chin J Rock Mech Eng 24(S1):4745–4749
Zhao YX, Jiang YD, Wang T et al (2012) Features of microseismic events and precursors of rock burst in underground coal mining with hard roof [J]. J China Coal Soc, 37(12): 1960 - 1966. CNKI:SUN:MTXB.0.2012–12–001
Funding
Financial supports for the study were provided by the Natural Sciences Foundation Committee of China under Grant No. 41472254 and the Science and Technology Research and Development Program of China Railway Construction Corporation Limited under Grant No. 17-C13. These supports are gratefully acknowledged.
Author information
Authors and Affiliations
Corresponding author
Ethics declarations
Conflict of interest
The authors declare that they have no competing interests.
Additional information
Responsible Editor: Zeynal Abiddin Erguler
Rights and permissions
About this article

Cite this article
Wang, Y., Xu, J., Wu, S. et al. Estimation of rock burst grade using acoustic emission technique. Arab J Geosci 15, 194 (2022). https://doi.org/10.1007/s12517-021-09150-4
Received:
Accepted:
Published:
DOI: https://doi.org/10.1007/s12517-021-09150-4