
Abstract
In the southwest of China, the topography and geomorphology are complex, and the geology is changeable, and the karst landforms are widely distributed, which results in exposing existing karst caves in many tunnel constructions. Tunnel design should secure not only the safety of hydraulic pressure-resistant structure during the operation period, but also the hydraulic pressure-resistant performance of primary support during construction. With Yongfutun tunnel as the research object, this paper studied the water pressure change of exposing existing karst caves in the tunnel construction, and double-layer primary support was used to meet the construction safety. The study found the water pressure dissipated to zero with the exposure of existing karst caves. When the steady water pressure of the tunnel lining support system restored to 0.3 MPa, deformations of the single-layer primary support and double-layer primary support were slightly different; deformation of the lining was not a key indicator of structural control; axial force of I-steel, shotcrete, and secondary lining of the double-layer primary support was smaller than that of the single-layer primary support, and the double-layer primary support can well bear the compressive load, and therefore it can resist hydraulic pressure.
Introduction
Karst landform, formed by the limestone dissolution caused by running water, includes funnels, underground rivers, karst caves, stone forests, peak forests, etc. Karst landform is widely distributed in the Yunnan-Guizhou Plateau, among which Guilin Karst is a typical example of the world peak forest and cluster karst landscape. With the development of China’s comprehensive road network construction, the construction of road networks in southwest China is speeding up where the topography and geomorphology are complex and the geology is changeable. In this case, mountain tunnels have to frequently pass through exposed karst caves including big karst caves, wide corroded and fractured zones, and big water-storage karst pipelines. The design of tunnel lining structure to resist water pressure has become a key point of such special geological sections when the tunnel runs through exposed karst caves. The hydraulic pressure-resistant structure and treatment are of great significance for engineering practice (Antonio Pacheco, Mendez and Moro, 2019; Lu et al., 2018).
When the karst cave was located at the side of the tunnel or above the tunnel in the Guiyang-Guangzhou High-Speed Railway Youzhushan Tunnel, Yang (2020) filled the karst cave with fillers and strengthened the wall rock of the cave with support, but he did not consider the influence of water pressure on the lining structure during the tunnel operation period. Gao (2005), Yao (2014), Jiang (2005), Wang (2008), Zhang (2003), Li et al. (2012), and Liu et al. (2013) took the external water pressure as the surface force of the lining structure and adopted “load-structure” in the design. They increased the thickness of secondary lining and changed the inner contour to meet the external water pressure load of the lining structure. However, before the construction or when the strength had not met the design requirements, the primary support was destroyed. Therefore, we need to further strengthen the primary support (Abedini et al., 2020; Gholipour, Zhang and Mousavi, 2020).
Engineering profile
Tunnel profile
Yongfutun tunnel is located in Siding Town, Rong’an County, Liuzhou City, Guangxi Province, with a left line of 5640 m and a right line of 5647 m, and the longitudinal slope of both the left and right line is a one-way slope of −2.37%. Yongfutun tunnel is a separated super long tunnel with a maximum buried depth of about 301 m lying in the depression and valley of structural corrosion peak clusters. According to the drilling and geological mapping, the overburden of tunnel site is thin, and the lithology of underlying bedrock is dolomitic limestone of Upper Yujiang formation (D3) and Middle Donggangling formation (D2d) of the Devonian System. The wall rock grade of the tunnel is mainly III and IV. Karst constitutes the major unfavorable geology in the tunnel site. In the investigation stage, it was found that there were many ponors in the tunnel, and geophysical exploration showed that in the tunnel, there might be karst fissures, karst caves, underground rivers, and so on (Zhu et al, 2018).
Profile of exposed karst caves
The geological hazard of water gushing and mud bursting at the K66+490 section tunnel face of the right line of the tunnel exit was caused by the hidden karst cave exposed by blasting construction on June 17, 2019, and the accumulative amount of water and mud inrush reached 10 000 m3 on June 30, 2019 (Figs. 1 and 2).

Three-dimensional model of exposed karst cave at vault. a Water gushing destroyed tunnel exit facilities. b Water gushing and mud inside the tunnel

Tunnel top of water gushing section
Investigations showed that the buried depth of the K66+490 section was 143 m, the top was a steep slope, and there were three ponors in the low-lying area where the two hills met. There was a flat ground on the tunnel top which was about 25 m × 35 m, and the cavity area of the upper left karst cave of the vault was about 100 m3 (Fig. 3).

Location of exposed karst cave at vault
Design of treatment options
Concrete was pumped from the flank wall of the tunnel face to fill the cavity as much as possible. If the cavity was large, the minimum thickness of the pumped concrete should be ≥ 3 m. At the skewback, diversion holes were reserved for the secondary lining of primary support. The length of the drilling hole outside the primary support of rock mass was not less than 5 m. In the tunnel drainage system, 10-cm diameter stainless steel pipes were embedded, and the diversion holes were laid at the longitudinal spacing of 2 m (Fig. 4).

Design diagram of exposed karst cave treatment
Water pressure analysis of wall rock during karst cave exposure
Pore water pressure refers to the pressure of groundwater in soil or rock, which acts between particles or pores. Its distribution was analyzed by numerical simulation.
Analysis model
A three-dimensional numerical model (Fig. 5) was established for the distribution of water pressure under the influence of high head karst water. The model size was 100 × 100 × 36 m, the distance of the tunnel to the left and right boundary was both 44 m, to the upper boundary is 50 m, and to the lower boundary is 38 m. The karst cave was located at the upper left of the tunnel, which was simplified to a 3 × 2.5 × 12-m cylinder. Solid model was adopted for the wall rock and primary support, Pile element was used for the advance anchor bolt and circumferential bolt, Beam element was used for the I-steel, shell element was used for the secondary lining, Mohr-Coulomb elastic-plastic model was applied for the wall rock constitutive relation, and elastic model was applied for the primary support. The analysis parameters are shown in Table 1.

Water pressure analysis model
The boundary constraints were as follows: X direction constraint was applied to both the left and right side, Y direction constraint was applied to both the front and back side, and the whole constraint was applied to the lower boundary. Stress converted from the upper soil by σ = γh was applied to the upper boundary.
Water pressure distribution analysis
From the analysis of the streamline cloud diagram (Fig. 6), it can be seen that a drainage channel was formed after the cave was exposed with the excavation of the tunnel. When the groundwater gathered at the tunnel, the pore water pressure around the tunnel decreased, and the water pressure in the cavity dropped to zero. However, around the wall rock, the water pressure did not lower to zero immediately because the groundwater distribution in rock and soil was formed by long-term seepage, while tunnel excavation and later support took less time. Therefore, the calculation time of the model was adjusted to improve the calculation efficiency.

Streamline cloud diagram during karst cave exposure. a Streamline before karst cave exposure at tunnel top. b Streamline during karst cave exposure at tunnel top. c Streamline after primary support at tunnel top. d Streamline after primary support at tunnel trunk
From the analysis of the whole process, when the tunnel was not excavated, the groundwater streamline was stable. When the tunnel face was close to the cave or it even passed through the karst cave, the streamline suddenly became bigger, which brought water gushing disaster in real construction. After the tunnel ran through the karst cave section, the karst cave was filled, and the flow rate of seepage dropped after the application of the primary support and the secondary lining, showing that sound support measures played an important role in tunnel stability.
As it can be seen from the water pressure cloud diagram (Fig. 7), before excavation, the pore water pressure was equally distributed being about 0.8 MPa. With the excavation of the tunnel, the pore water pressure around the tunnel decreased. When the upper bench excavation reached 3 m deep, water pressure around the tunnel decreased to 0.5 MPa, and when the excavation reached 12 m deep where the cave was partially exposed, the pressure rose to 0.3 MPa. When the lower bench excavation reached 3 m deep, the pore water pressure around the bench dropped to 0.1 MPa. Meanwhile, due to the increase of water pressure caused by the primary support of the upper bench, as the lower bench excavation reached 12 m deep, water pressure around the tunnel rose to about 0.35 MPa. After the tunnel was completed, the water pressure around it was about 0.45 MPa (Fig. 8).

Distribution of water pressure during karst cave exposure. a Water pressure before tunnel excavation. b Distribution of water pressure at 12-m excavation of upper bench. c Water pressure with excavation going beyond karst cave area. d Distribution of water pressure after completion of upper bench support

Changing trend of water pressure outside lining
From the water pressure analysis of the key points of the vault, the haunch, and the skewback, when the karst cave was exposed by tunnel excavation, water pressure inside was released, water pressure compensation in the cave was much smaller than the water pressure discharge, and water in the dissolved cavity significantly decreased. Water pressure at the left haunch of the cave dissipated to zero after draining water due to the formation of cavity, and pressure at other points dropped to less than 0.1 MPa. When the tunnel was excavated and supported, the water pressure restored to 0.3 MPa after the tunnel drainage system worked stably. Because the permeability path was shorter when the karst cave was located at the right haunch of the tunnel vault, the maximum water pressure at the right haunch was 0.05 MPa, higher than that at other key points, and the tunnel lining structure produced local stress concentration.
Design optimization of hydraulic pressure-resistant lining in exposed karst cave
Design of hydraulic pressure-resistant lining for double-layer primary support
As the water source in the karst cave was replenished after the primary support and the karst cave was partially backfilled, the water pressure could restore to about 0.3 MPa. As the extra water pressure brought an unnecessary external force to the primary support and secondary lining, special hydraulic pressure-resistant lining was needed to ensure the safety of the lining structure, on which research has been conducted (Ding and Xu, 2018; Ding and Xu, 2020).
According to the research, generally egg shape lining was applied to the hydraulic pressure-resistant lining, and the lining was thickened to guarantee the safety (Zhang, 2020). However, at the exposed karst cave section, under the condition of large amount of water in the rainy season, the karst cave was not recharged by external water source, and the water pressure recovery of the primary support under the water pressure permeation in the karst cave produced external load. When being exposed to high water pressure, the primary support might be destroyed and cause a secondary water gushing disaster. To ensure the overall construction safety, double-layer primary support was applied to the section of the exposed karst cave and high-water pressure (Fig. 9).

Water pressure distribution during karst cave exposure. a General design of hydraulic pressure-resistant lining. b Design of hydraulic pressure lining for double-layer primary support
Stress analysis of special hydraulic pressure-resistant lining design
By establishing force characteristics of the single- and the double-layer linings under different water pressures, the rationality and feasibility of double-layer lining structure were analyzed.
Analysis model
The simplified model was established with the tunnel axis being the boundary and only half of the numerical model being established (Tian et al, 2020). The lining was optimized only under the condition of water pressure. The model size was 90 × 45 × 45 m. Force characteristics of the hydraulic pressure-resistant structure of both the single- and double-layer primary support under the action of 90 m static head were simulated, respectively (Fig. 10) (Xie, Liu, and Wei, 2020).

Model of hydraulic pressure-resistant lining for single- and double-layer primary support. a Static head model. b Steel frame type of the model
The boundary constraints were as follows: X direction constraint was applied to both the left and right side, Y direction constraint was applied to both the front and back side, and the whole constraint was applied to the lower boundary. Stress converted from the upper soil by σ = γh was applied to the upper boundary. At the middle water level, 90 m of static water head was realized by water table order.
Results analysis
-
(1)
From the cloud diagram of deformation (Fig. 11) and the change curves of deformation (Fig. 12), it can be seen that when upper bench excavation reached 36 m deep, the maximum vault settlement was 19.9 mm for the single-layer primary support, and for the double-layer primary support, it was 14.4 mm. In general, the deformation of the single-layer primary support was more serious than that of the double-layer primary support, but the difference was small, which was about 5.5 mm. The maximum deformation was less than 20 mm. Deformations above can all meet the requirements of tunnel deformation control (Tian, Song, and Wang, 2019). Therefore, the deformation of hydraulic pressure-resistant lining was not the main indicator of control when it reached certain strength.
Fig. 11 
Cloud diagram of deformation. a Deformation cloud diagram of single-layer primary support. b Deformation cloud diagram of double-layer primary support
Fig. 12 
Change curves of deformation
-
(2)
Cloud diagram of the advance anchor bolt (Fig. 13) shows that the maximum axial force of the bolt was 0.549 MPa for the single-layer support lining, and for the double-layer support lining, it was about 0.541 MPa. Cloud diagram of the axial force of anchor bolt (Fig. 14) shows that the maximum axial force of anchor bolt was 0.736 MPa for the single-layer primary support lining, and for the double-layer primary support lining, it was about 0.735 MPa kN. Change curves of the axial force of anchor bolt (Fig. 15) shows that axial force of both the advance anchor bolt and the primary support anchor bolt of the double-layer support lining was smaller than that of the single-layer support lining, but the difference was very small. Analysis shows that the stress environment of the anchor bolt was basically similar under the two working conditions as it was located inside the wall rock, and the deformation was mainly controlled by tension (Zhang, Pak, and Zhang, 2020). However, deformation analysis showed that deformations under the two working conditions were similar; thus, the final stress pattern of the anchor bolt was consistent with the deformation. Meanwhile, axial stress of both the advance anchor bolt and the circumferential anchor was not always increasing or decreasing, and it was significantly affected by the excavation process. For example, the axial stress changed obviously during the excavation of the lower bench.
Fig. 13 
Cloud diagram of axial force of advance anchor bolt. a Cloud diagram of axial force of advance anchor bolt for single-layer primary support lining. b Cloud diagram of axial force of advance anchor bolt for double-layer primary support lining
Fig. 14 
Cloud diagram of axial force of anchor bolt. a Cloud diagram of axial force of anchor bolt for single-layer primary support lining. b Cloud diagram of axial force of anchor bolt for double-layer primary support lining
Fig. 15 
Change curves of the axial force of anchor bolt
-
(3)
Cloud diagram of stress of I-steel (Fig. 16) shows that the stress of I-steel was about 93 MPa for the double-layer primary support, and for the single-layer primary support, it was about 130 MPa, with the latter being about 40% greater than that of the former. From the change curves of the stress of I-steel (Fig. 17) at the edge of the upper bench, it can be seen that the stress of I-steel of the single-layer primary support first increased, and then it continued a slow increase as the excavation went on, and finally it reached about 130 MPa. For the double-layer lining, stress between the first and the second layer primary support was equally distributed, and the stress slowly changed from the start of the application, and finally it reached about 60 MPa.
Fig. 16 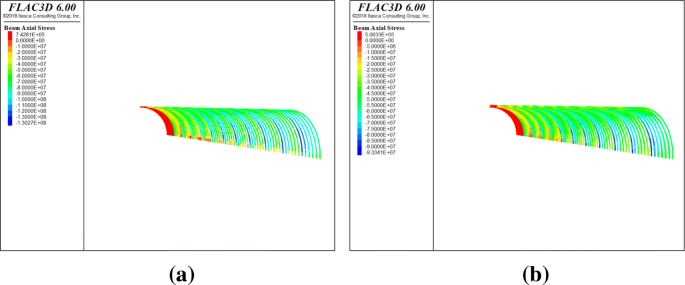
Cloud diagram of stress of I-steel. a Cloud diagram of stress of I-steel of single-layer primary support. b Cloud diagram of stress of I-steel of double-layer primary support
Fig. 17 
Change curves of the stress of I-steel
-
(4)
Cloud diagram of the maximum principal stress of primary support (Fig. 18) shows that the maximum principal stress of shotcrete was 1.57 MPa for the first layer primary support of the double-layer lining, and for the second layer primary support, it was 1.08 MPa. The maximum principal stress of shotcrete for the primary support of the single-layer lining was about 2.04 MPa. Cloud diagram of the minimum principal stress of primary support (Fig. 19) shows that the minimum principal stress of shotcrete was 13.80 MPa for the first layer primary support of the double-layer lining, and for the second layer primary support of the double-layer lining, it was 11.47 MPa. The minimum principal stress of shotcrete for the primary support of the single-layer lining was about 18.35 MPa. From the change curves of the stress at key measure points (Figs. 20 and 21), it can be seen that at the edge of the upper bench, the maximum principal stress for the first layer primary support of the double-layer lining was the greatest, followed by that for the primary support shotcrete of the single-layer lining, and for the second layer primary support shotcrete of the double-layer lining, the stress was the smallest (Bunimovich, Smith, and Webb, 2019). During the excavation of the lower bench, the maximum principal stress increased significantly, while the minimum principal stress was decreasing all the time due to the impact of the excavation of the lower bench. But the minimum principal stress of shotcrete between the first and the second layer primary support of the double-layer lining was equally distributed which was about 8 MPa, but the minimum principal stress of shotcrete of the primary support of the single-layer lining was greater with about 12 MPa.
Fig. 18 
Cloud diagram for the maximum principal stress of primary support. a Cloud diagram of the maximum principal stress for single-layer primary support. b Cloud diagram of the maximum principal stress for inner layer primary support. c Cloud diagram of the maximum principal stress for outer layer primary support
Fig. 19 
Cloud diagram of the minimum principal stress for primary support. a Cloud diagram of the minimum principal stress for single-layer primary support. b Cloud diagram of the minimum principal stress for inner layer primary support. c Cloud diagram of the minimum principal stress for outer layer primary support
Fig. 20 
Change curves of the maximum principal stress for primary support
Fig. 21 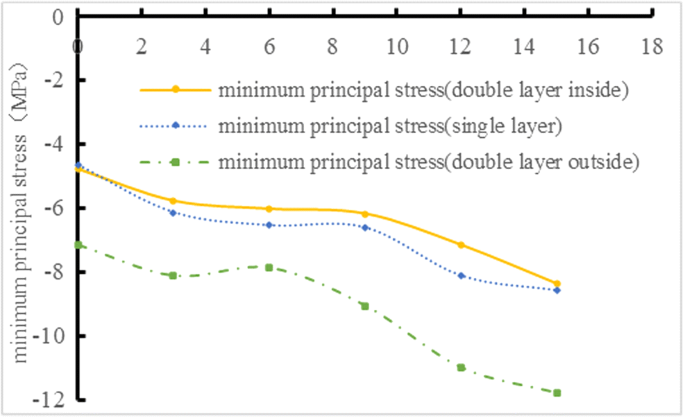
Change curves of the minimum principal stress for primary support
-
(5)
Cloud diagram of the axial force of secondary lining (Fig. 22) shows that the maximum axial force of secondary lining was 2 368 kN for the single-layer primary support, and for the double-layer primary support, it was 1 881 kN. Bending moment cloud diagram of secondary lining (Fig. 23) shows that the maximum bending moment of secondary lining was 138.5 kN·m for the single-layer primary support, and for the double-layer primary support, it was 66.87 kN·m. Change curves of the axial force and the bending moment of secondary lining (Figs. 24 and 25) show that axial force of the secondary lining for the single-layer primary support was 30% smaller than that for the double-layer primary support, and bending moment of the former was 45% smaller than that of the latter. Generally, the double-layer primary support can well bear the main load, but the secondary lining can further increase the safety reserve to meet the design requirements of water pressure resistance of the lining at exposed karst cave sections.
Fig. 22 
Cloud diagram of axial force of secondary lining. a Cloud diagram of axial force of secondary lining for single-layer primary support. b Cloud diagram of axial force of secondary lining for double-layer primary support
Fig. 23 
Cloud diagram of bending moment of secondary lining. a Cloud diagram of bending moment of secondary lining for single-layer primary support. b Cloud diagram of bending moment of secondary lining for double-layer primary support
Fig. 24 
Change curves of axial force of secondary lining
Fig. 25 
Change curves of bending moment of secondary lining


Conclusions
-
(1)
Analysis of the tunnel construction process at exposed karst cave sections shows that water pressure dissipated to zero after the water was drained when the cavity was formed due to water pressure release with cave exposure, and pressure at other points dropped to less than 0.1 MPa. When the tunnel lining support system was applied and the drainage system worked stably, the water pressure restored to 0.3 MPa. The tunnel lining produced local stress concentration.
-
(2)
Comparison suggests that deformations of the single-layer and the double-layer primary support were slightly different, and the deformation of hydraulic pressure-resistant lining was not the main indicator of control when it reached certain strength.
-
(3)
Deformation analysis indicates that stress environment under the two working conditions was similar, and the final stress shape of the anchor bolt was consistent with the deformation. For example, the axial stress changed obviously during the excavation of the lower bench. Axial stress of the advance anchor bolt and the circumferential anchor was similar, which was significantly affected by the excavation process.
-
(4)
The maximum principal stress of shotcrete was at the edge of the upper bench. Therefore, after the excavation of the upper bench started, the foot anchor bolt was a very necessary support means. The stress of shotcrete for the single-layer primary support was too big; therefore, double-layer primary support should be adopted.
-
(5)
Stress of I-steel of the single-layer primary support was 40% greater than that of the double-layer primary support. The maximum principal stress of shotcrete for the single-layer primary support was about 23% greater than that for the double-layer primary support, and the minimum principal stress of the former was 25% greater than that of the latter. Axial force of the secondary lining for the single-layer primary support was 30% smaller than that for the double-layer primary support, and bending moment of the former was 45% smaller than that of the latter. The double-layer primary support could well bear the compressive load, and therefore it could resist hydraulic pressure.
References
Abedini M, Mutalib AA, Zhang C, Mehrmashhadi J, Raman SN, Alipour R, Momeni T, Mussa MH (2020) Large deflection behavior effect in reinforced concrete columns exposed to extreme dynamic loads. Frontiers of Structural and Civil Engineering 14:532–553
Antonio Pacheco H, Mendez W, Moro A (2019) Soil erosion risk zoning in the Ecuadorian coastal region using geo-technological tools. Earth Sciences Research Journal 23:293–302
Bunimovich L, Smith D, Webb B (2019) Finding hidden structures, hierarchies, and cores in networks via isospectral reduction. Applied Mathematics and Nonlinear Sciences 4(1):231–254
Ding YP, Xu LS (2020) Simulation analysis of lining structure design for rich water mountain deep-buried highway tunnel. Modern Tunnelling Technology 40(3):214–219
Ding YP, Xu LS (2018) Study on mechanical characteristics and safety of deep-buried highway tunnel lining under external water pressure. Modern Tunnelling Technology 55(6):101–107
Gao XQ (2005) Study on distribution rule of water pressure of lining of mountain tunnel subject to high hydraulic pressure. Doctoral Dissertation of Southwest Jiaotong University, Chengdu
Gholipour G, Zhang C, Mousavi AA (2020) Numerical analysis of axially loaded RC columns subjected to the combination of impact and blast loads. Engineering Structures 219:110924
Jiang ZX (2005) Interaction between tunnel engineering and water environment. Chinese Journal of Rock Mechanics and Engineering 1:121–127
Li J, Tang ZS, Wang XY, Du CW (2012) Laboratory investigation on the mechanical characteristics of primary support in subsea tunnel under condition of construction process. Journal of Beijing Jiaotong University 36(1):30–35
Liu LP, Wang XG, Jia ZX, Duan QW, Wang YJ (2013) Method to determine the correction value of water pressure acting on the tunnel lining using for water-rock independent calculation methodology. Chinese Journal of Geotechnical Engineering 35(3):495–500
Lu J, Li D, Xue X, Ling S (2018) Macro-micromechanical properties of sandy pebble soil of different coarse-grained content. Earth Sciences Research Journal 22:65–71
Tian X, Song Z, Wang J (2019) Study on the propagation law of tunnel blasting vibration in stratum and blasting vibration reduction technology. Soil Dynamics and Earthquake Engineering 126:105813
Tian XX, Song ZP, Wang B, Zhou GN (2020) A theoretical calculation method of influence radius of settlement based on slices method in tunnel construction. Mathematical Problems in Engineering 2020:1–9
Wang JY (2008) Problems on external water pressure on tunnel lining. Railway Construction Technology 2:1–6
Xie T, Liu R, Wei Z (2020) Improvement of the fast clustering algorithm improved by k-means in the big data. Applied Mathematics and Nonlinear Sciences 5(1):1–10
Yang L (2020) Application of safety technology in high risk karst construction of Youzhushan tunnel lining of Guiyang-Guangzhou High-speed Railway. Science and Technology & Innovation 5:151–153
Yao JF (2014) Research on water pressure of lining and force of lining structure for mountain tunnel in water-rich area. Master’s Degree Thesis of Southwest Jiaotong University, Chengdu
Zhang S, Pak RYS, Zhang J (2020) Vertical time-harmonic coupling vibration of an impermeable, rigid, circular plate resting on a finite, poroelastic soil layer. Acta Geotechnica
Zhang W (2020) Parameter adjustment strategy and experimental development of hydraulic system for wave energy power generation. Symmetry (Basel) 12(5):711
Zhang YT (2003) Discussion on external hydraulic pressure upon rock tunnel lining. Modern Tunnelling Technology 40(3):1–4
Zhu LM, Zhang CW, Guan XM, Uy B, Sun L. The multi-axial strength performance of composite structural bc-w members subjected to shear forces. Steel & Composite Structures An International Journal 2018(7):75–87
Funding
The work was financially supported by the Open Fund Project for Cultivation Base of State Key Laboratory of Bridge and Tunnel Engineering in Mountain Area (No. CQSLBF-Y16-1), Project Name: Study on the Structure Type and Safety Early Warning System of External Water Pressure in Mountain Rich Water Tunnel; Chongqing Traffic Technology Project (No. CQJK2015-03), Project Name: Study on the Countermeasures of Groundwater Protection and Limited Discharge in Chuntianmen Super Long Tunnel of Nanchuan-Liangjiang New Area Highway; and Chongqing Fuling Science and Technology Commission Science and Technology Project (No. FLKJ 2016BBB1082), Project Name: Co-Key Technologies and Risk Control for Construction Safety of Baitao Tunnel Group under Complex Conditions.
Author information
Authors and Affiliations
Corresponding author
Ethics declarations
Conflict of interest
The authors declare that they have no competing interests.
Additional information
Responsible editor: Keda Cai
This article is part of the Topical Collection on Geodesy and Geodynamics of China.
Rights and permissions
About this article

Cite this article
Ding, Y., Xu, L. Hydraulic pressure-resistant design of highway water-rich tunnels traversing exposed karst cave in karst area of peak cluster landform. Arab J Geosci 14, 1998 (2021). https://doi.org/10.1007/s12517-021-08045-8
Received:
Accepted:
Published:
DOI: https://doi.org/10.1007/s12517-021-08045-8