
Abstract
Ground granulated blast furnace slag (GBFS) has been used to alter the geopolymerisation behaviour of fly ash. The influence of varying amount of GBFS (5–50%) on the reaction kinetics has been studied using isothermal conduction calorimetry. It was observed that the reaction at 27 °C is dominated by the GBFS activation, whereas the reaction at 60 °C is due to combined interaction of fly ash and GBFS. The reaction product of geopolymerisation has been characterised using X-ray diffraction and scanning electron microscopy–X-ray microanalysis. Alumino–silicate–hydrate (A–S–H) and calcium–silicate–hydrate (C–S–H) gels with varying Si/Al and Ca/Si ratio are found to be the main reaction products. Coexistence of A–S–H and C–S–H gel further indicates the interaction of fly ash and GBFS during geopolymerisation. Attempt has been made to relate the microstructure with the properties of the geopolymers.
Introduction
The term geopolymer was coined nearly three decades back by Davidovits for alumino–silicate binders formed in alkaline environment [1]. These have also been referred to as geocement, inorganic polymer, alkali bonded ceramic and low temperature synthesised glass etc. [2–8]. During the process of forming geopolymers, i.e. geopolymerisation, alumino–silicate materials are dissolved into alkali solution to form free SiO4 and AlO4 tetrahedral units [1, 9]. Further these SiO4 and AlO4 tetrahedrons are linked alternatively where charge-balancing cations are provided by alkali metal cations and yield polymeric precursors (–SiO4–AlO4–, or –SiO4–AlO4–SiO4–, or –SiO4–AlO4–SiO4–SiO4–) by sharing all oxygen atoms between two tetrahedral units and forming monolithic geopolymer products [1, 9, 10]. Theoretically, any alumino–silicate material can be used for geopolymerisation. The pure materials and natural occurring clays are traditionally used for geopolymer synthesis [11–14]. Major efforts are also being made to use waste materials such as fly ash, slags, etc., instead of naturally occurring raw materials from the point of view of resource conservation [15–26].
Fly ash is a by-product generated during combustion of pulverised coal in thermal power plants. It essentially contains SiO2 and Al2O3 along with other compounds such as CaO, Fe2O3, MgO, MnO, etc. Due to easy availability, alumino–silicate composition, low water demand and high workability, fly ash has become material of interest for geopolymer synthesis [15–25]. During geopolymerisation, fly ash reacts with alkaline media and specifically aqueous solutions of polysialates leading to formation of cementitious material, comprising of alumino–silicate–hydrate (A–S–H) gelFootnote 1 [16]. Fly ash based geopolymers show good mechanical strength and enhanced durability [16, 17, 23, 27]. The limiting factor, which has hindered the use of fly ash in geopolymers, is its low reactivity, which often leads to slow setting and strength development. In many cases, the dissolution of fly ash is not complete before the final hardened structure is formed [16]. In a microscopy and microanalysis of remnant fly ash particles in geopolymer cements, it was reported that the mullite present in fly ash remains unreacted and calcium appears to be active in the process of alkali activation of ash/slag blends [28].
To overcome the problem of low reactivity of fly ash, two different approaches have been explored by us. These include: (a) mechanical processing of fly ash, e.g. air classification, mechanical activation, etc., and (b) addition of granulated blast furnace slag (GBFS). The effect of mechanical processing of fly ash on its reactivity and geopolymerisation is reported elsewhere [29–31]. The focus of this article is on the addition of GBFS.
Granulated blast furnace slag is a glassy, granular material essentially consisting of SiO2, CaO, Al2O3 and MgO. It is formed when molten blast furnace (BF) slag produced as a byproduct in iron making is rapidly cooled, usually by immersion in water, and then ground to improve its reactivity. In the alkali activation of GBFS, the main reaction product is a hydrated calcium–silicate (C–S–H) gel with low C/S ratio [32–37]. The C–S–H gel improves the setting and strength characteristic of geopolymer [32–37].
The present work is based on the utilisation of two industrially important wastes, namely, fly ash and blast furnace slag, in geopolymer. The wastes have been used synergistically, i.e. the problem of low reactivity of fly ash is addressed through GBFS addition. Isothermal conduction calorimetry has been used to elucidate the effect of increasing amount of GBFS addition (0–50%) on the geopolymerisation of fly ash. Attempts have also been made to correlate the results of calorimetry with the structure and properties of the geopolymer samples.
Materials and methods
Fly ash and granulated blast furnace slag
The Class F fly ash (as per ASTM C 618-99) used in this study was obtained from a coal fired thermal power plant. GBFS was received from an integrated cement plant. Both the plants are located in the state of Chattisgarh (India). The fly ash was used in as received condition and will be referred to as raw fly ash (RFA) in subsequent description. The GBFS used in the study was ball milled for 1 h. The chemical analysis of the samples and their physical properties, viz, density, median size, glass content and mineralogy, are given in Table 1.
Fly ash and GBFS was mixed in different proportions and used for geopolymerisation. The amount of GBFS in the mixture was varied from 0 to 50%. The description of batch composition, in terms of SiO2/Al2O3 ratio, CaO, and total glass content is given in Table 2. The total glass content is also expressed in terms of individual contribution from fly ash and GBFS. With increasing GBFS content from 0–50%, the SiO2/Al2O3 ratio is maintained in the vicinity of ~2, which is typical of a rigid geopolymer structure [1]. As evident from Table 2, increasing amount of GBFS signifies an increase in CaO and total amorphous phase content.
Isothermal conduction calorimetric studies
Isothermal conduction calorimetry was used to monitor the geopolymerisation of fly ash and GBFS mixtures (Table 2). The rate of heat evolution during the reaction (dq/dt) was measured using an eight channel isothermal conduction calorimeter (TAM AIR, Thermometric AB, Jarafalla, Sweden). The sample preparation included following steps: (a) preparation of alkaline activator solution, (b) mixing of alkaline activator with the powder sample, and (c) loading of the mix in calorimeter. Analytical grade sodium hydroxide flakes (98% purity) were used to prepare alkaline activator solution. Alkaline activator of 6 M concentration was prepared in distilled water at least 24 h before use. Seven grams of solid sample and 3.5 mL alkaline activator were used throughout the study. Calorimetric studies were carried out at 27 °C where dominant reaction is solubilisation and at 60 °C where main reaction is polycondensation [37]. Calorimetry runs were carried under following conditions: (a) at 27 °C for 48 h, and (b) at 60 °C for 24 h after curing the samples at 27 °C for 24, 48, 72 and 96 h to fix curing duration, and (c) at 60 °C for 24 h after curing for 48 h. The two stage curing cycle was used to avoid the overlapping of dissolution–precipitation reaction that occurs at ambient temperature and geopolymerisation reactions that occurs at higher temperature (i.e. 60 °C in the present study) [37].
Characterisation of the reaction products
The reaction products were characterised by powder X-ray diffraction (XRD) technique and scanning electron microscopy (SEM) with X-ray microanalysis (EDS). Powder XRD patterns were recorded on a SIEMENS X-ray diffractometer (Model D500), using CoKα radiation with a Fe-filter. A scanning speed of 1° 2θ/min was used and the samples were scanned from 10 to 60°. Morphological characterisation of the fractured samples was done by a JEOL scanning electron microscope (SEM 840, JEOL) with a Kevex EDS attachment for X-ray microanalysis.
Physical testing
For physical testing such as setting time and compressive strength, the liquid (sodium hydroxide solution) to solid ratio (by weight) was maintained at 0.35. All the samples were prepared at 27 ± 2 °C and under humidity of 65%. The solid powder batch was mixed thoroughly with alkali solution to prepare a consistent paste for setting time determination. Setting time was measured using a Vicat apparatus (AIMIL, India). Compressive strength was measured on cube shape samples of size 7 cm × 7 cm × 7 cm. The cubes were prepared by mixing each batch with alkali solution and casting the resulting paste into moulds. The moulds were kept covered with lids to minimise loss of water during reaction. Two sets of compressive strength data were generated on the cube samples. In one case, the strength was measured daily for 10 days and after 14 and 28 days of curing at 27 °C. In another case, strength measurement was carried out on samples cured at 27 °C for 48 h followed by 4 h further curing at 60 °C. Compression Testing Machine (AIMIL COMPTEST 2000, India) was used to test the compressive strength of the samples using the loading rate of 2.
Results and discussion
Isothermal conduction calorimetry
The geopolymerisation is a complex process comprising of many steps such as dissolution, precipitation, restructuring and polycondensation [37, 38]. These processes are largely coupled and occur concurrently. Some of these reactions such as dissolution or precipitation start at the early stages of mixing with alkaline activator at ambient temperature, whereas some reactions such as polycondensation essentially require higher temperature [38]. To monitor the reactions, both at ambient and elevated temperatures, isothermal conduction calorimetry was carried out at 27 and 60 °C. The alkali activation of slag and fly ash is reported at temperature near 20 °C [39, 40]. However, in the present study, the rationale for using 27 °C is that it is the temperature recommended by Bureau of Indian Standards (BIS) for cementitious materials [41]. For mixtures containing only fly ash and alkali, the calorimetric response at 27 °C is typical of a dissolution-precipitation reaction [37, 38]. Sixty degree celsius was the upper limit of temperature for the calorimeter used. Geopolymerisation reactions are fast enough at 60 °C and the process can be completed in few hours [1, 38].
Reactions occurring at 27 °C
Figure 1 shows the heat evolution curve obtained by isothermal conduction calorimetry of the samples at 27 °C for 48 h. The calorimetric response of RFA and GBFS mixtures was found to lie between the response of RFA and GBFS alone. In all the samples, only one prominent peak was observed. The observed peak is typical of dissolution precipitation reaction leading to the formation of C–S–H gel as the main phase [33, 37]. In RFA, the peak was small and this may be due to: (a) low glass content and consequently low reactivity of fly ash and (b) deficiency of calcium ions. An increase in GBFS addition led to an increase in peak intensity and shift in peak maxima to a lower time. The maximum rate [(dq/dt)max] of the reaction was found out from peak maxima, and the total heat evolved [Q′(t′)] during dissolution–precipitation reaction was inferred from the area under the plot. Figure 2 shows variation of the heat evolved with time. The increase in peak intensity as well as heat of reaction with GBFS content indicates enhanced dissolution–precipitation reaction.

Isothermal conduction calorimetric results showing effect of GBFS addition on dissolution and precipitation of fly ash at 27 °C

Effect of GBFS addition on heat of hydration versus time at 27 °C
Reactions occurring at 60 °C
The samples cured for 48 h at 27 °C were subjected to calorimetry at 60 °C for further investigation (Fig. 3). The rationale to select 48 h curing was based on calorimetric studies involving curing for different length of time from 24 to 96 h followed by geopolymerisation at 60 °C. It was observed that 48 h was the minimum time required to complete the initial dissolution precipitation reaction. Figure 3 shows the geopolymerisation behaviour of fly ash, blast furnace slag and their mixture in different proportions. Both RFA and GBFS have shown only one peak, the peak corresponding to RFA signifies the condensation of alumino–silicate network whereas the peak corresponding to GBFS is due to condensation of C–S–H [42–44]. The calorimetric curves corresponding to mixtures of RFA and GBFS were characterised by two peaks, one small in the beginning followed by the second major peak. The splitting of peak became more prominent with increase in GBFS loading, which indicates the possibilities of following reaction mechanism:

Isothermal conduction calorimetric results showing effect of GBFS addition on the geopolymerisation of fly ash at 60 °C (after curing at 27 °C for 48 h)
-
(a)
reactions due to geopolymerisation of GBFS only;
-
(b)
reactions due to geopolymerisation of fly ash only;
-
(c)
reactions occurring due to interaction of fly ash and GBFS.
The small peak in the beginning is due to domination of geopolymerisation of GBFS, whereas the second peak is due to domination of geopolymerisation of fly ash and fly ash GBFS mixture. The heat flow curve of all the samples (Fig. 3) was always much above the baseline showing prolonged hydration and concurrent condensation reaction. To get further information about reactions due to interaction of fly ash and GBFS, the heat curves were calculated and presented in Fig. 4. The heat evolution curve of the samples containing mixture of fly ash and GBFS in different proportion is not falling between the boundary of fly ash and GBFS and showing higher cumulative values. For better understanding, the heat evolution of mixture samples were calculated from heat evolution values of RFA and GBFS and compared with the actual values (Fig. 4). The actual values, which are either similar or lower during early reaction, have shown higher values than the calculated one due to interaction of fly ash and GBFS (Fig. 4).

Effect of GBFS addition on heat of hydration versus time, the heat of hydration curve of RFA and GBFS is taken as boundary line. The actual value of RFA and GBFS mix is compared with the calculated value
Microstructural characterisation of geopolymers
Mineralogical characterisation carried out by XRD (Fig. 5) showed crystalline quartz and mullite phases, which derived from parent fly ash. The reaction products formed due to reaction between reactive glassy fraction of fly ash and GBFS consisted of amorphous to poorly crystalline phases. It is important to mention here that glass content of the fly ash consists of reactive and refractory glass, and only reactive glass participates in geopolymerisation. The broad and diffused background peak with maxima of around 10° is the result of the short-range order of the hydrotalcite (Mg6Al2CO3OH164H2O) [45]. The peaks around 30° and 50° corresponding to A–S–H and C–S–H gel were found in all GBFS containing samples. With increase in GBFS, the peak intensity of crystalline phases decreased.

XRD results of geopolymer showing increased amorphisation with increase in GBFS content
Figure 6a–c shows the microstructure of RFA, 15% GBFS and 35% GBFS based samples geopolymerised at 60 °C. In the microstructure of geopolymer samples prepared with only fly ash, partially reacted cenospheres constituted the main feature (Fig. 6a). With addition of GBFS, the change in microstructure was distinctly evident. In general, the microstructure of the sample containing higher amount of GBFS was denser due to increasing formation of C–S–H gel (Fig. 6b, c). In samples with 15% GBFS, the cenosphere were found coated with reaction product (Fig. 6b). The formation of gel phase at the surface of fly ash particles, which grows outward in hydroxide system, has also been reported recently by Lloyd et al. [46]. With further increase in GBFS to 35%, presence of short prismatic structure with diffused boundaries and long fibres in clusters was observed (Fig. 6c). In all the samples (RFA, GBFS and their mixtures), gel structure was observed. In general, four major morphological features were observed, cenosphere with reaction product on the surface (Fig. 6d), dense gel phase (Fig. 6e), tabular type particles with no sharp geometric outline (Fig. 6f) and fibrous products (Fig. 6g). EDS study was carried out to identify these features and the analysis is summarised in Table 3. Mainly two types of gel was identified: (a) alumino–silicate–hydrate with Na in structure, and (b) calcium–silicate–hydrate with Na in structure. In addition, gel with composition close to zeolite was also observed in some cases.

SEM of geopolymers showing a partially reacted cenosphere in raw fly ash based geopolymer, b sample with 15% GBFS showing fly ash cenosphere coated with reaction product, c sample with 35% GBFS showing short prismatic structure, d sample with 15% GBFS showing cenosphere with reaction product on the surface, e sample with 25% GBFS showing dense gel phase, f samples with 35% GBFS showing fibrous products, and g samples with 35% GBFS showing tabular type particles
Physical properties of geopolymer
The following physical properties were measured:
-
(a)
setting time was measured on fresh paste of all the samples at 27 °C (Fig. 7);
Fig. 7 
Effect of GBFS addition on the setting time of geopolymer at 27 °C
-
(b)
compressive strength was measured daily for 10 days and after 14 days and 28 days of curing at 27 °C (Fig. 8);
Fig. 8 
Effect of GBFS addition on the compressive strength in relation to hydration time at 27 °C
-
(c)
compressive strength was measured on on samples cured at 27 °C for 48 h followed by 4 h further curing at 60 °C (Fig. 9).
Fig. 9 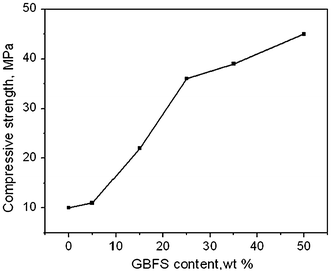
Effect of GBFS addition on compressive strength of geopolymer heat treated at 60 °C for 4 h after curing at 27 °C for 48 h


The difference between initial and final setting time was very short and even negligible in some cases. Thus only initial setting time was measured. Figure 7 shows the setting time of samples with increasing GBFS content. The samples with only fly ash took long time, 295 min to set. A sharp decrease in setting time was observed, which reduced to 105 min with addition of 5% GBFS. With addition of more GBFS, setting time further decreased and reached to minimum value of 45 min when 25% GBFS was added. No further reduction in setting was observed with increasing GBFS. Figure 8 shows the compressive strength of samples cured at 27 °C for 1–28 days. The compressive strength increased with GBFS content. The increase in compressive strength was more prominent when more than 15% GBFS was added. This result is also in agreement of setting time of the samples. The increase in strength with time is mainly due to C–S–H formation [37, 43–45]. The result of compressive strength measured after casting and curing of samples at 27 °C for 48 h and geopolymerisation at 60 °C for 4 h is shown in Fig. 9. RFA has shown 10 MPa compressive strength, which increased with increase in GBFS content. This increase was more prominent when 25% or more GBFS was added. Maximum compressive strength 45 MPa was reported when 50% GBFS was added.
Heat evolution–structure–property relationship
At 27 °C, the calorimetric response is mainly governed by the dissolution and precipitation of C–S–H gel [35–37]. The physical properties such as setting time and development of compressive strength at 27 °C are mainly associated with C–S–H gel formation due to alkali activation of slag [35–37]. At 60 °C, the splitting of peak with addition of GBFS indicates two reaction mechanism taking place concurrently, condensation of A–S–H and C–S–H (Fig. 3). This was further supported by SEM–EDS studies which confirmed the formation of two type of reaction products, alumino–silicate gel with Si/Al ratio ~2 and of C–S–H with Si/Al ratio ~2.5 and Ca/Si ratio 0.8 (Table 3). It is evident from the calorimetric results that at 27 °C, alkali activation of GBFS is predominant reaction, whereas at 60 °C, both fly ash and GBFS plays significant role in geopolymerisation.
The microstructure, both in terms of compactness and morphological features, changed with GBFS content. Amorphisation increased with the increase in GBFS. Formation of new reaction product hydrotalcite and C–S–H gel was observed. Two type of C–S–H gel were mainly observed, one dense amorphous gel and second, gel with increased crystallinity, which are taking shape of short prismatic crystals. It was noted earlier that in alkali activation of blast furnace slag, sometime C–S–H appears more crystalline than Ordinary Portland cement [47]. Improvement in compressive strength with slag addition can be attributed to increase in compactness of microstructure (Fig. 6a–c).
Conclusions
The reaction at 27 °C is dominated by dissolution and precipitation of C–S–H gel due to alkali activation of GBFS. There is only small interaction of fly ash and GBFS probably due to different kinetics of dissolution process and distribution of species. The improvement in setting time and compressive strength can be explained by the formation of cementitious C–S–H gel, which improved the setting and hardening of geopolymer. The geopolymerisation at 60 °C is dominated by the combined interaction of fly ash and GBFS. This interaction is substantiated by the coexistence of C–S–H and A–S–H gel in the reaction products. The improvement in compressive strength with slag addition may be attributed to the formation of gel phases (C–S–H and A–S–H) and compactness of microstructure.
Notes
All through the text, cement nomenclature is used where (C = CaO, S = SiO2, A = Al2O3, H = H2O).
References
Davidovits J (1989) J Therm Anal 35(2):429
Gartner E (2004) Cem Concr Res 34:1489
Rahier H, Van Mele B, Biesemans M, Wastiels J, Wu X (1996) J Mater Sci 31:71. doi:https://doi.org/10.1007/BF00355128
Palomo A, De La Fuente JIL (2003) Cem Concr Res 33:281
Krivenko PV (1994) In: Krivenko PV (ed) Proceedings of the first international conference on alkaline cements, concretes. VIPOL Stock Company, Kiev, Ukraine, p 11
Mallicoat S, Sarin P, Kriven WM (2005) Ceram Eng Sci Proc 26:37
Sofi M, Van Deventer JSJ, Mendis PA, Lukey GC (2007) J Mater Sci 42(9):3007. doi:https://doi.org/10.1007/s10853-006-0818-9
Bao Y, Grutzeck MW, Jantzen CM (2005) J Am Ceram Soc 88:3287
Davidovits J (1988) In: Davidovits J, Orlinski J (eds) Proceedings of geopolymer ’88—first European conference on soft mineralurgy. Universite De Technologie De Compeigne, Compeigne, France, p 149
Khale D, Chaudhary R (2007) J Mater Sci 42:729. doi:https://doi.org/10.1007/s10853-006-0401-4
Gordon M, Bell JL, Kriven WM (2005) Ceram Trans 165:95
Xu H, Van Deventer JSJ (2000) Int J Miner Proc 59:247
Wang H, Li H, Yan F (2005) Colloids Surf A 268:1
Duxson P, Mallicoat SW, Lukey GC, Kriven WM, Van Deventer JSJ (2007) Colloids Surf A 292:8
Palomo A, Grutzeck MW, Blanco-Varela MT (1999) Cem Concr Res 29:1323
Swanepoel JC, Strydom CA (2002) Appl Geochem 17:1143
Van Jaarsveld JGS, Van Deventer JSJ (1999) Ind Eng Chem Res 38(10):3932
Bakharev T (2005) Cem Concr Res 35:1233
Hardjito D, Rangan BV (2006) Curtin research report on fly ash-based geopolymer concrete, Report GC 2. Curtin University of Technology, Australia, March 2006
Rangan BV, Hardjito D, Wallah SE, Sumajouw DMJ (2005) In: Davidivits J (ed) Proceedings of 4th world congress on geopolymer, Saint Quentin, France, June 28–July 1, p 133
Fernandez-Jimenez A, Palomo A, Sobrados I, Sanz J (2006) Micropor Mesopor Mater 91:111
Palomo A, Alonso S, Fernandez-Jimenez A, Sobrados J, Sanz J (2004) J Am Ceram Soc 87(6):1141
Fernandez-Jimenez A, Palomo A (2003) Fuel 82:2259
Skvara F, Bohunek J (1999) Ceramics-Silikaty 43(3):111
Puertas F, Martinez Ramirez S, Alonso S, Vazquez T (2000) Cem Concr Res 12(8):1625
Komnitsas K, Zaharaki D, Perdikatsis V (2007) J Mater Sci 42:3073. doi:https://doi.org/10.1007/s10853-006-0529-2
Goretta KC, Gutierrez-Mora F, Singh D et al (2007) J Mater Sci 42:3066. doi:https://doi.org/10.1007/s10853-006-0561-2
Lloyd RR, Provis JL, Van Deventer JSJ (2009) J Mater Sci 44:608. doi:https://doi.org/10.1007/s10853-008-3077-0
Kumar S, Kumar R, Alex TC, Bandopadhyay A, Mehrotra SP (2007) Adv Appl Ceram 106(3):120
Kumar S, Kumar R, Alex TC, Bandopadhyay A, Mehrotra SP (2005) In: Davidovits J (ed) Proceedings of 4th World Congress on Geopolymer, France, June 28–July 1, p 113
Kumar S, Kumar R, Bandopadhyay A, Mehrotra SP (2007) In: Proceedings of international conference on alkali activated materials–research, production and utilization, Prague, Czech Republic, pp 429
Yip CK (2004) PhD Thesis, University of Melbourne, Australia
Shi C, Day RL (1999) Adv Cem Res 11(4):189
Buchwald A, Dombrowski K, Weil M, (2005) In: Davidovits J (ed) Proceedings of 4th World Congress on Geopolymer, France, June 28–July 1, pp 35
Yip CK, Lukey GC, Van Deventer JSJ (2003) Ceram Trans 153:187
Li Z, Liu S (2007) J Mater Civ Eng 19(6):470
Buchwald A, Hilbig H, Kaps Ch (2007) J Mater Sci 42:3024. doi:https://doi.org/10.1007/s10853-006-0525-6
Duxson P, Fernandez-Jimenez A, Provis JL, Lukey GC, Palomo A, Van Deventer JSJ (2007) J Mater Sci 42:2917. doi:https://doi.org/10.1007/s10853-006-0637-z
Yunsheng Z, Wei S, Qianli C, Lin C (2007) J Haz Mater 143:206
Puertas F, Fernandez-Jimenez A (2003) Cem Concr Compos 25:287
BIS specification IS 4031 (1988) Part 1 to 13, Methods of physical test for hydraulic cement
Granizo ML, Alonso S, Blanco-Varela MT, Palomo A (2002) J Am Ceram Soc 85:225
Buchwald A, Tatarin R, Stephan D (2009) J Mater Sci 44:5609. doi:https://doi.org/10.1007/s10853-009-3790-3
Yao X, Zhanga Z, Zhua H, Chena Y (2009) Thermochim Acta. doi: https://doi.org/10.1016/j.tca.2009.04.002
Mozgawa W, Deja J (2009) J Mol Struct 924–926:434
Lloyd RR, Provis JL, Van Deventer JSJ (2009) J Mater Sci 44:620. doi:https://doi.org/10.1007/s10853-008-3078-z
Richardson IG, Brough AR, Groves GW, Dobson CM (1994) Cem Concr Res 24:813
Acknowledgements
The authors are grateful to Dr. Sukomal Ghosh, Acting Director, National Metallurgical Laboratory, Council for Scientist & Industrial Research, Jamshedpur, India for his kind permission to publish the paper. The fly ash used in the study was received from Grasim Cement, Rawan, Chattisgarh (India) and this is gratefully acknowledged. Authors also acknowledge the characterisation support from Mr. M. Gunjan and Mr. B. Mahato.
Author information
Authors and Affiliations
Corresponding author
Rights and permissions
About this article
Cite this article
Kumar, S., Kumar, R. & Mehrotra, S.P. Influence of granulated blast furnace slag on the reaction, structure and properties of fly ash based geopolymer. J Mater Sci 45, 607–615 (2010). https://doi.org/10.1007/s10853-009-3934-5
Received:
Accepted:
Published:
Issue Date:
DOI: https://doi.org/10.1007/s10853-009-3934-5