
Abstract
This paper applies an organized flow of feature engineering and machine learning to detect distributed denial-of-service (DDoS) attacks. Feature engineering has a focus to obtain the datasets of different dimensions with significant features, using feature selection methods of backward elimination, chi2, and information gain scores. Different supervised machine learning models are applied on the feature-engineered datasets to demonstrate the adaptability of datasets for machine learning under optimal tuning of parameters within given sets of values. The results show that substantial feature reduction is possible to make DDoS detection faster and optimized with minimal performance hit. The paper proposes a strategic-level framework which incorporates the necessary elements of feature engineering and machine learning with a defined flow of experimentation. The models are also validated with cross-validation and evaluated for area-under-curve analyses. It provides comprehensive solutions which can be trusted to avoid the overfitting and collinearity problems of data while detecting DDoS attacks. In the case study of DDoS datasets, K-nearest neighbors algorithm overall exhibits the best performance followed by support vector machine, whereas low-dimensional datasets of discrete feature types perform better under the Random Forest model as compared to high dimensions with numerical features. The accuracy scores of dataset with the lowest number of features remain competitive with other datasets under all machine learning models, leading to a substantially reduced processing overhead. The experiments show that approximately 68% reduction in the feature space is possible with an impact of only about 0.03% on accuracy.
1 Introduction
Denial-of-service (DoS) is a cyber security problem when a targeted attack at a resource results in its unavailability or service degradation to the legitimate users. The resource may be a single machine (such as a server), a group of machines (such as a pool of dedicated servers), or even a network. If an attacker can manage to put the accessibility of the target resource into a state of denial for legitimate users, the DoS attack is successful. This attack can be carried out in a number of ways and at different layers of the OSI and TCP/IP models. Each kind of DoS attack has its specific technique of execution which is driven by a number of factors such as the software tool used to generate attack traffic, target protocol, communication layer, the nature of victim (server, network, endpoint), etc. The ultimate objective of the attacker remains to put the target resource in a state of denial for the legitimate users. Although different protection mechanisms can be applied for critical resources to prevent such kind of attacks, the vulnerabilities that exist in the systems are realities of computing world which are exploited by the hackers. Table 1 highlights some types of DoS attacks mentioned in [1] driven by different techniques, targeted for various resources and exploiting their vulnerabilities.
The attackers often find themselves with shortage of computing power needed to launch a DoS attack, specially when massive traffic is needed to generate in a short span of time. This need of high processing power by hackers generates a demand of another relevant attack called distributed denial-of-service (DDoS). It is a special phenomenon to carry out DoS attack with a large amount of processing power. Interestingly, the hackers do not consume their own resources to produce this power and launch DDoS attacks. Instead, they maliciously take control of other machines (usually owned by the people who are unaware of this shift of control) and use those resources to accumulate processing power and do the damage. The owners of such taken-over resources are the compromised victims who unknowingly contribute in attacking the ultimate victim. Such machines are compromised by exploiting vulnerabilities or bugs in their systems.
The DDoS attack is setup by staging a network of connected machines. The machines are called ‘Zombies’ which are the part of this network known as ‘Botnet.’ The mechanism of controlling the network is also established in which Command & Control (C&C) is assigned to the dedicated high-capacity resources which directly issue the instructions on behalf of the attacker. The next layer is of ‘Handlers’ which are selected by C&C functionality to feed the commands and take responses. Under each handler, there are a number of zombies which are used to directly send attack traffic to the target (victim). They also convey the information about the victim to corresponding handlers, which relay it back to the attacker via C&C function [2]. Hence, client–server technology is employed to establish communications in the botnet. Figure 1 shows a typical DDoS architecture.
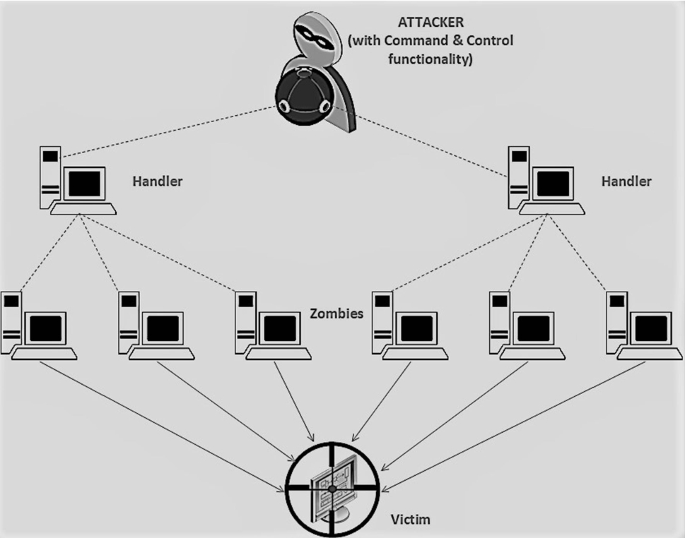
Architecture of DDoS attack
Data flooding is the most common type of DDoS attack. According to the statistics from akamai.com for Quarter-4 of year 2017, UDP fragmentation is the most frequent DDoS attack vector [3]. This is a flooding technique where UDP segments are bombarded with a frequency high enough to exhaust the victim. Also, infrastructure layer DDoS attacks are more in number than attacks belonging to the application layer. All layers of the OSI and TCP/IP communication models are vulnerable to DDoS attacks [4]. Although OSI model of seven layers is an old and traditional explanation of communication layers, it is still used to convey the environmental designs. On the other hand, TCP/IP is a transformed model in which some OSI layers are combined to make it a comprehensive stack of five layers. Each layer has its own parameters to be considered for DDoS attack. A communication system can be exploited by attackers with DDoS at any of the weakest layer if not protected accordingly. Traditional DDoS attacks are more focused toward the exploitation of physical, data link, network and transport layers of OSI model. However, the recent trends of DDoS attacks have shown more attempts to exploit the application layer of OSI and TCP/IP models.
Techniques of DDoS attack detection have many approaches including the machine learning. Machine learning is a promising approach of predicting and simulating human behavior with computational intelligence, and it has been successfully applied to widespread real-world problems. For machine learning-driven detection of DDoS attacks, the intrusion detection datasets available at public repositories covering DDoS attacks are widely considered to be evaluated for creating the machine learning models. In this paper, feature engineering is practically studied on a specific dataset having a mix of normal traffic and DDoS attacks. Feature engineering encompasses the necessary elements driven by data science studies followed by the machine learning applications for detection of attacks. The complete analysis is mapped on a proposed strategic-level framework which leads to a comprehensive approach for avoiding data related inbuilt problems and substantially reducing the processing overhead. The major contributions of this paper include (1) a proposed strategic-level framework encompassing the feature engineering and machine learning steps in a comprehensive manner to detect DDoS attacks, (2) designing the framework to include optimization and validation of machine learning models, and (3) detecting more advanced levels of DDoS attacks, specially the application layer attacks, through the proposed framework.
The remainder of this paper is organized as follows: Sect. 2 provides literature review and its analysis, Sect. 3 mentions the proposed framework along with research approach, Sect. 4 discusses feature engineering, and Sect. 5 provides detailed description of the experimental analysis and performance evaluation. Finally, concluding remarks and future work discussion are provided in Sect. 6.
2 Related work and analysis
The related work in the field of DDoS attack detection covers a range of techniques which also include machine learning. In this section, the related work is mentioned with more emphasis on highlighting the techniques which consider machine learning approaches to detect DDoS attacks. In Fig. 2, a threefold categorization scheme of the reviewed work is mentioned. It can be seen that we have a larger domain of intrusion detection/prevention systems in the space of cyber defense. Then we choose the detection/prevention systems covering DDoS attacks. The analyzed work mostly contains the approaches equipped with machine learning, where more emphasis is made on the techniques also covering the feature engineering elements (underlined in Fig. 2).

Threefold categorization of reviewed work
For machine learning-driven approaches, the intrusion detection datasets available at public repositories have been the key element of related research where one or more datasets are analyzed against the proposed methods and classification models for detection accuracy and other metrics. In Table 2, some common benchmark datasets are mentioned with overview.
2.1 Literature review
Gao et al. [13] provide a protocol-independent approach to detect DDoS attacks driven by the reflection approach. Five features are determined which can be used for machine learning-based detection of DRDoS (distributed reflection denial-of-service) attack in protocol-independent manner. The features include number of packets (in a time unit without TCP or UDP header), packet size sent to the target, total number of packets sent to the target, difference of packet numbers sent from and to the target in unit time, and maximum number of packets sent in unit time. Naive Bayes machine learning method with feature selection is used in [14]. Detection of DDoS attacks is presented with machine learning approach using naive Bayes-driven classification where CAIDA’07 dataset is used with eight features in consideration. The step by step statistical formulae of naive Bayes method are applied to calculate the probabilities of attack and make detections. In [15], a framework of critical feature identification for botnet traffic is proposed with the name of classification of network information flow analysis (CONIFA). The traffic is generated and analyzed with a botnet toolkit called Zeus. Initially, nine features are shortlisted for traffic analysis using correlation-based feature selection (CFS) algorithm.
For a comparison with the common methods of feature selection based on statistical significance, a proposed method is presented in [16] which combines the DoS features with Consistency-based Subset Evaluation (CSE) to select an improved subset of features from the given DoS dataset. The CSE method measures inconsistency among feature values and provides the inconsistency ratio for patterns of feature subsets. In [17], 16 features are considered to be the most decisive from CAIDA’07 dataset. An ensemble method of feature selection is proposed where scores of statistical significance including information gain, chi-square, gain ratio, SVM, correlation ranking, reliefF, and symmetrical uncertainty ranking filter are considered in a way that the average of individual scores are taken as threshold for each feature to allow or stop entering the shortlisted feature set. In the work of Khan et al. [18], the use of entropy along with granular computing technique for feature selection in DoS attack identification is presented. For each of the seven features considered from NSL-KDD’09 dataset with fifty instances in total, entropy is calculated and then a weight value is assigned to each feature considering the anomaly count.
In [19] with two datasets, i.e., ISOT and ISCX, a wrapper methodFootnote 1 is deployed to select different sets of features through greedy search using genetic algorithm and then evaluate those features with C4.5 algorithm. The features giving better detection rate with C4.5 are prioritized. In a virtual cloud environment discussed in [20], detection of a simulated SYN flood attack is analyzed with different machine learning models after feature selection of TCP/IP header-related information. After the phases of preprocessing and feature extraction, an intersection process is introduced for feature selection which provides an optimal feature set after taking the common features provided by ReliefF, information gain (IG), and gain ratio (GR) calculations. Li et al. [21] implement learning vector quantization (LVQ) technique of neural network on the simulated traffic. Like self-organizing maps (SOM) produce cluster boundaries in unsupervised learning, LVQ does the same under supervised learning where class boundaries are produced according to the training data. Through multiple iterations, the closely related neurons come together and are assigned the same class boundary. The neurons exhibiting more close properties decide the overall class of the group, thus implementing the winner-takes-it-all model for the output.
In [22], authors believe that the strength of a DDoS attack can be determined with ANN against variations in entropy of the network traffic. In [23], it is presented that the number of zombies behind a DDoS attack can be predicted with ANN against variations in entropy of the network traffic. In [24], three different techniques of machine learning are applied to detect malicious botnet traffic. A clustering method is used to initially form clusters with six features (manual feature extraction) and then a label (malicious or botnet) is assigned to each cluster based on network flow observations of time windows. Lu et al. [25] discuss the identification of Command & Control (C&C) session establishment through machine learning on relevant features before the launch of DDoS attack. In this study, a 55-dimension feature vector of network traffic is analyzed to detect C&C sessions with Random Forest algorithm of machine learning. A comparison is also presented with naive Bayes and support vector machine algorithms.
Zekri et al. [26] discuss DDoS attack detection in cloud environment with machine learning algorithms. In this research, a simple set of 5 features is analyzed with C4.5 decision tree algorithm working on the splitting criterion of gain ratio. The detection module is also supplemented with signature-based detection for improved outcomes. Two other methods, i.e., naive Bayes and K-means are also evaluated for comparison purpose. In [27], deep learning implementation of recurrent neural network (RNN) is discussed to identify DDoS attacks, which is named as DeepDefense. RNN is quite a useful technique to identify patterns in time series predictions. It works on short-term memory cells by default, but the memory term can be increased by using a type of RNN called long-short-term memory (LSTM) which ensures correlation among several time steps in the series. In this study, 20 network traffic features are sampled from ISCX’12 dataset to analyze the performance of designed architecture having bidirectional RNN. With 64 neurons in each cell having nonlinear activation function of hyperbolic tangent, the output transfer function is configured to be Sigmoid. The design also includes convolutional neural network (CNN) layers before RNN layers in the architecture with activation function of Rectified Linear Unit (ReLU). For accelerating the training process, RNN layers are also attached to batch normalization layers. In [28], the authors simulate modern types of DDoS attack such as DDoS via SQL injection (SIDDOS) and HTTP flooding in addition to traditional Smurf and UDP flooding attacks. Both SIDDOS and HTTP flooding are application layer attacks which have drawn more attention of cyber security researchers for mitigation in recent years. A multiclass dataset of 1,048,575 instances, simulated with NS2 network simulator, is used to detect different types of DDoS attacks, i.e., SIDDOS, HTTP flood, UDP flood, and Smurf.
In Table 3, the related work analysis is provided with respective approaches and observations.
2.2 Research gap
Following conclusions are drawn from the literature review to identify research gap and plan our proposed work for threefold contribution such that:
-
(a)
It is obvious that even after a number of research attempts to detect DDoS attacks with machine learning approaches, where a few of them also consider feature engineering, we are short of a strategic-level framework to apply such approaches in a systematic manner so that the comprehensive evaluation may be possible to avoid generally inbuilt problems of machine-mined data such as collinearity, multicollinearity and duplication. Also, there is a need of incorporating all the important requirements of data science-driven approaches while applying the machine learning models. Simply executing a model with default parameters may not serve the purpose but introduce the elements of overfitting.
-
(b)
Combining the feature engineering and machine learning methods along with optimizations in a single framework is also an important contribution of the proposed work. In fact, considering them together is required for all-inclusive experimentation and trusted outcomes.
-
(c)
Traditional datasets used in most of the papers are not effective in recent times because attackers are now focusing more toward advanced levels of DDoS attacks, specially the application layer attacks. New techniques need to be practically evaluated on a dataset having advanced level of attacks such as SQL-based DDoS attacks and HTTP flooding.
3 Proposed framework and research approach
3.1 Strategic-level framework
Machine learning strategies followed by the feature engineering and data science best practices can be used in a productive manner to get the best detection in a given DDoS dataset. In this research, a strategic framework is proposed which encompasses a thorough treatment of features followed by the machine learning improvements. It emphasizes that the machine learning results must deal with the problem of overfitting. The proposed framework is given in Fig. 3.

Strategic-level framework for DDoS attack detection
The proposed strategy ensures that a systematic treatment of features is made according to the type and structure of data. The details of such a treatment applied to the studied dataset of DDoS attacks are presented in Sect. 4. This approach can be generalized in a way that any kind of cyber intrusion including DDoS attack may be considered for the application of proposed strategy so that all the inbuilt issues of data such as skewness, collinearity and multicollinearity may be addressed for subsequent phases of machine learning. Another important aspect to be considered inside the feature engineering module is dealing with the missing values. This issue can be addressed by different means including imputation where the missing data may be replaced with average, maximum, or minimum values. If the missing values are high in proportion as compared to the assigned values, it is often required to eliminate the feature altogether. Therefore, based on the proportion of missing values contained by a feature in the dataset, the respective treatment may be executed within Feature Elimination or Feature Adjustment steps of the feature engineering module in proposed framework. After the feature selection step is completed inside the feature engineering module of proposed framework, one or more datasets are ready with reduced sets of features to be analyzed with machine learning algorithms. In Fig. 3, five machine learning algorithms used in this paper are mentioned. However, Machine Learning module of the proposed framework is not limited to those five algorithms. Any machine learning algorithm, i.e., supervised, unsupervised, or semi-supervised can be used for analysis. Here, the emphasis is made on supervised algorithms due to the nature of given datasets of DDoS classification problem where the target classes (Normal/DDoS) are available.
3.2 Research approach
The application layer DDoS attacks are more difficult to detect as compared to network or transport layer attacks as the obvious anomalies are not existent when the application layer is exploited for an attack. The application layer attack establishes complete and legitimate connections between the attacker and victim. Hence the detection of such attacks at infrastructure layer is not easy [29]. The attackers also hide DDoS attacks behind the rate of traffic. When slow-rate DDoS attacks are in action, it is not easy to detect the upcoming impact as the anomaly in traffic goes unseen [30]. According to the study conducted by Jonker et al. in [31] for the previous 2 years, the most targeted victims of DoS attacks are the web servers. The study reveals that about 3% of the web servers on average containing .com, .org and .net domain addresses were targeted for denial-of-service attacks on daily basis.
DDoS attackers employ various strategies for selection of zombies and creation of botnet [32]. For countermeasures of DDoS attacks, the research community is aggressively using machine learning techniques for DDoS detection at all layers of OSI and TCP/IP models [4]. Still, it is needed to have a strategic framework which defines the critical steps to follow while applying machine learning techniques for DDoS detection. The framework needs to express the modules of critical feature engineering and machine learning requirements in a systematic flow so that the detection accuracies may be presented with a confidence of ignoring the components of overfitting and collinearity. With this approach, the competitive scores of detection accuracy may be achievable. Although detection accuracies are expected to be hit in a negative manner against aggressive data engineering methods and feature selection, the accuracy scores can be presented for reliable detections with effective machine learning models.
4 Feature engineering
The dataset used as a case study in this paper is contributed by Alkasassbeh et al. [28] and is publicly available for analysisFootnote 2. It is selected for analysis in this paper due to the consideration of recent kinds of DDoS attacks (application layer attacks) which are reflected by the traffic features in this dataset. Further, having a newer dataset of year 2015 is a better choice for analysis than the older datasets like KDD, CAIDA, NSL-KDD, ISOT, and ISCX. This is NS2 simulated dataset which contains five target classes namely SIDDOS (Structured Query Language Denial of Service), HTTP flood, UDP flood, Smurf, and Normal. First four classes represent the corresponding DDoS attacks while the last one explains the legitimate traffic. The dataset contains 1,048,575 instances out of which 108,927 are DDoS attacks. Although the original dataset has differentiated classes of SIDDOS, HTTP flood, UDP flood, and Smurf in addition to the normal traffic, the analysis in this paper is only focused on differentiating normal and DDoS (irrespective of the type of DDoS) traffic. Therefore, only two classes are considered in this paper while the normal class is labeled as ‘Normal’ and any type of DDoS class is labeled as ‘DDoS.’
The dataset in [28] has 27 features in the default state (this dataset is mentioned as ‘DS’ in the remainder of this paper). The features, their types and explanation are given in Table 4. Data redundancy is observed in the fields ‘pkt_size’ (feature no. 7) and ‘pkt_avg_size’ (feature no. 21) which represent the same characteristic of traffic flow. A careful analysis of these two features explains that they possess the same values in respective records. Figure 4 verifies this observation showing a perfect linear correlation between ‘pkt_size’ and ‘pkt_avg_size’ features. A feature that directly establishes the value of another feature in the dataset must be excluded in order to avoid the collinearity trap. Hence in this research, dedicated efforts are made in data preprocessing phase to avoid the redundancies and environment-specific features for a more general approach to establish the proposed strategy for DDoS attack detection.
4.1 Data preprocessing
‘DS’ is a large dataset with 1,048,575 records out of which 108,927 represent the attack instances. It indicates that 10.388% of the dataset corresponds to DDoS class while the remaining belongs to normal class. It shows that ‘DS’ is skewed toward the normal class where the majority of records belong to normal traffic. This is, however, an actual representation of real-world data where majority of the recorded events corresponds to the legitimate traffic. Class imbalance is a well-known problem in data science studies. In such a case as we see for ‘DS,’ undersampling is an option [27] where 939,648 normal instances can be randomly filtered and chosen to avoid the data skewness and obtain a balanced dataset. There are various methods of undersampling and oversampling to address the problem of class imbalance [33]. However in this research, none of the methods is used and the complete dataset of 1,048,575 records is analyzed with the existing ratio of class imbalance for two reasons. One reason is the fact that valuable information can be lost against undersampling when a large portion of normal traffic is eliminated. The second reason is that the mentioned ratio of class imbalance which is roughly 1:9 (10% DDoS traffic and 90% normal traffic) is still acceptable for machine learning analyses and detection of attacks [34]. Moreover, the internal mechanisms of machine learning algorithms such as bagging, boosting, and kernel tricks are also helpful to avoid overfitting and misclassification that may arise due to class imbalance in a dataset [35].

Correlation between ‘pkt_size’ and ‘pkt_avg_size’ features in DS
4.1.1 Feature elimination and adjustment
After it is decided that all instances of ‘DS’ are retained for machine learning-driven analyses to detect DDoS attacks, the feature elimination based on domain knowledge is executed at this stage. Domain knowledge here emphasizes on the fact that a person belonging to the real-world environment of the underlying problem represented by a dataset can provide the best judgment on the features whether they should be considered in the dataset or be eliminated. There can be several reasons behind these types of decisions such as insignificance of a feature due to technological change or advancement, inappropriateness of a feature due to specific environmental or business need, and collinearity or multicollinearity observations and duplication. For one or more such reasons, 15 features of ‘DS’ are removed under domain knowledge.
In the above scenario, some important-looking features such as IP addresses are also removed from the dataset. It is emphasized in this research to distinguish two types of features known as flow-level features and packet-level features [36]. Flow-level features express the behavioral and packet sizing characteristics. The packet-level features convey the information related to packet signatures in the form of address or foot printing characteristics. The emphasis in this research remains on the flow-level features, thus removing several packet-level features including the environment-specific addressing information. Moreover, node_name_frm and node_name_to features are transformed into the new labels of ‘Node Type From’ (node_type_frm) and ‘Node Type To’ (node_type_to) where the combinations of node type and numbers are replaced with only the type of node such as ‘from endpoint,’ ‘from switch,’ ‘to router,’ and ‘to server.’ Also, the seq_no feature is brought in accordance with the pkt_type feature (categorical data having values of ‘ping,’ ‘cbr,’ ‘ack,’ and ‘tcp’) where ping and cbr traffic have no sequence number (represented as 0 in seq_no feature) while ack and tcp traffic have sequence numbers (at least 1 in seq_no feature). The consideration of flow-level features while avoiding one or more aspects of packet-level features is also presented in other research efforts [19, 37]. In [37], only four features are used, i.e., small packets, packet ratio, initial packet length, and bot response packet ratio. Three classification techniques, i.e., Ada boost with J48, naive Bayes, and SVM are applied where data are taken from multiple sources for the mining of traffic flow features to detect botnet-driven flows. The highest accuracy (detection rate) of 99.14% and lowest false positive rate of 4.81% are obtained with NB classifier. It shows that even a smaller number of features with flow-level approach and possible generalization (no dependency on addressing, protocol, and identifiers) can be the most contributing factor in detecting DDoS attacks. The protocol-independent features are also sought by researchers to introduce generic approach of flow characteristics [13].
After the removal of 15 features from ‘DS’ and transformation of a couple of features with relabeled feature names as described above, the existing feature set of ‘DS’ contains 12 features. Out of them, three categorical features are treated with one hot encoding to extract new variables in ‘DS’ as mentioned in Table 5.
4.1.2 Data normalization and full dataset ‘DS00_Full’
Normalization is required to bring the numerical data at common scale so that the feature values in high numerical digits may not overwhelm lower values in mathematical calculations of machine learning algorithms. Min–max scaling is one of the most commonly used normalization technique in which the values are scaled between two given numbers. The most common practice is scaling between 0 and 1 (both inclusive). The formula of min–max normalization is given in Eq. (1), where \(n_i\) is the normalized value of \(x_i\) which is the ith item in a set of values ranging from \(x_\mathrm{max}\) (maximum number) to \(x_\mathrm{min}\) (minimum number).
In ‘DS,’ 13 variables extracted from categorical data do not need normalization. Hence, the remaining nine numeric features are normalized. After dealing with categorical features, elimination of the mentioned variables, and normalization of numeric features, the dataset ‘DS’ is transformed to ‘DS00_Full’ which is one of the datasets for machine learning analyses in this paper. The full and preprocessed dataset, i.e., ‘DS00_Full’ with new features is shown in Table 6. It shows that ‘DS00_Full’ is a dataset with 22 features, whereas the 23rd column is for traffic class which is the dependent variable for machine learning classification.
4.2 Feature selection
4.2.1 Backward elimination
The p-value under t-statistic test determines whether two given datasets are different from each other with respect to their mean and distribution (spread). While mean is the average value, the spread is expressed in the calculations via standard deviation. The value of t-test score ‘t’ with two datasets \(D_{1}\) and \(D_{2}\) can be determined using Eq. (2).
In Eq. (2), \(x_{1}\) and \(x_{2}\) are mean valuesFootnote 3, \(s_{1}\) and \(s_{2}\) are standard deviations, and \(n_{1}\) and \(n_{2}\) are sample sizes of distributions \(D_{1}\) and \(D_{2}\), respectively. In t-test of the given nature, the probability (p-value) is calculated to decide if an established null hypothesis can be rejected. The p-value conveys overlapping probability and identifies the area under curve which overlaps for the given distributions. The null hypothesis \(H_{o}\) and alternate hypothesis \(H_{a}\) are established in the following manner:
\(H_{o}\): \(D_{1}\) and \(D_{2}\) are not different (\(x_{1}\) = \(x_{2}\))
\(H_{a}\): \(D_{1}\) and \(D_{2}\) are different (\(x_{1}\)\(\ne \)\(x_{2}\))
The analysis of p-value scores is driven by t-statistic test of independence as given in Eq. (2). This test is performed during backward elimination process of the feature selection approach. The backward elimination process is defined in Algorithm 1. With each iteration, the least significant feature is eliminated until we get all the variables under p-value of significance level, i.e., 5%. The tool used for backward elimination in this paper is statsmodels.formula.api class in Python. This is a wrapper method of determining the feature significance where a regressor is used in each iteration to verify the significance under p-value score. Finally, as conveyed by the p-value scores, the least significant 6 features are eliminated (remaining ones are mentioned in Table 7). The features are eliminated from the feature set contained by ‘DS00_Full’ and eventually the second dataset ‘DS01_PVal’ is obtained. It shows that ‘DS01_PVal’ is a dataset with 16 significant features, whereas the 17th column is for traffic class which is the dependent variable for machine learning classification.

4.2.2 Chi-square test
The Chi-square (Chi2) test of independence for two datasets with categorical values is applied to measure whether the given datasets are different from each other with respect to their observed values in relation to the expected outcomes. Chi2 score is given as:
In Eq. (3), \(\chi ^2\) is Chi2 score, ‘N’ is the total number of data instances (number of cells in ‘\(m\times n\)’ table), ‘OC’ refers to the observed count (count of a specific condition or expression which is observed), and ‘EC’ is the expected count (count of a specific condition or expression which is expected based on the probability calculated from sample). The test considers both input and target values to be categorical. For continuous data inputs, it creates a sliding window where upper and lower bounds are applied for each slice to virtually label it with a single categorical value. The probability is driven by individual probabilities of events provided that the events are independent as given below:
In Eq. (4), ‘P’ refers to the probability where ‘A’ and ‘B’ are two independent events. If \(C_{1}\) and \(C_{2}\) are two different datasets under Chi2 test of independence, the null hypothesis ‘\(H_{o}\)’ and alternative hypothesis ‘\(H_{a}\)’ may be established as follows:
\(H_{o}\): \(C_{1}\) and \(C_{2}\) are not different
\(H_{a}\): \(C_{1}\) and \(C_{2}\) are different
The analysis of Chi2 test of independence is an approach given in Eq. (3). This test is performed to select the top scoring significant features. The threshold of number of features to be selected from ‘DS00_Full’ to obtain another dataset ‘DS02_Chi2’ is seven. This value is selected due to observations from related work that around one-third of the total population of features is taken when feature selection is considered against such kinds of statistical tests [38]. As ‘DS00_Full’ contains 22 features, its approximate one-third are taken for machine learning analyses (Top seven features exhibiting Chi2 scores mentioned in Table 7). It shows that ‘DS02_Chi2’ is a dataset with 7 significant features, whereas the 8th column is for traffic class which is the dependent variable for machine learning classification.
4.2.3 Information gain test
The term ‘Entropy’ is the degree of disorder in a dataset. Hence the information component is highly variable across a range of instances when the entropy is high. The entropy ‘H(d)’ is given by Eq. (5) where ‘\(p_{i}\)’ is the probability of information component in the vector ‘d’ and ‘N’ is total number of information values that the vector ‘d’ contains.
On the other hand, values showing low variability across a range of instances provide the higher information gain. The information gain ‘IG(\(Y \vert X\))’ is calculated as:
In Eq. (6), ‘IG(\(Y \vert X\))’ is the information gain of ‘Y’ provided ‘X’ is given. H(Y) is the entropy of ‘Y’ and ‘\(H(Y \vert X)\)’ is the entropy of ‘Y’ given the entropy of ‘X.’ In this way, the information gain score can be calculated for a dataset feature against the target class provided the information gain and entropy of the target variable are known. Features can be ranked according to the information gain scores where the features with high information gain have more significance to classify the target variable. Like Chi2, information gain method of determining the feature significance is also a filter method which directly selects the features based on information gain scores without any involvement of a regressor. The analysis of information gain test is an approach given in Eq. (6). The threshold of number of features to be selected from ‘DS00_Full’ to obtain another dataset ‘DS03_IG’ is seven for the same reason described above for Chi2 test in Sect. 4.2.2 (Top seven features with respective information gain scores are mentioned in Table 8). It shows that ‘DS03_IG’ is a dataset with 7 significant features, whereas the 8th column is for traffic class which is the dependent variable for machine learning classification.
Table 9 presents the significant features against each dataset used for machine learning analyses in this paper.
5 Performance evaluation with machine learning
The datasets prepared for machine learning experiments in the previous section are used to derive various machine learning models and subsequent performance evaluation. Five algorithms of supervised machine learning used in this paper are K-nearest neighbors (KNN), naive Bayes (NB), support vector machine (SVM), random forest (RF), and artificial neural network (ANN). It is demonstrated that the machine learning coupled with feature engineering can be an effective approach to detect DDoS attacks. In the performance evaluation phase, area under curve (AUC) scores are compared in two ways. First it is observed how a specific machine learning algorithm behaves for different datasets, and secondly it is analyzed how a particular dataset carrying significant features is effective to be used by different machine learning algorithms in terms of optimized AUC scores.
5.1 Machine learning models
5.1.1 K-nearest neighbors
K-nearest neighbors (KNN) is a classification algorithm that detects the class of a new point in the system with respect to its distance from the nearest existing points. The existing points (already present in the system) are determined via some distance metric. The most common distance metric is Euclidean Distance given in Eq. (7).
Euclidean distance is a distance measure of straight line between two points in a vector space. In Eq. (7), ‘d(a, b)’ is Euclidean distance between two points ‘a’ and ‘b’ where (\(a_{1}\),\(a_{2}\)) and (\(b_{1}\),\(b_{2}\)) are coordinates of the respective points in two-dimensional space. The number of existing points in the system to qualify as neighbors of the new point is an initially set count indicated as ‘K.’ Thus the algorithm is named as K-nearest neighbors [39].
5.1.2 Naive Bayes
Naive bayes (NB) [40] is a statistical classifier based on conditional probability shown in Eq. (8).
It explains that the probability of occurrence of an event ‘x’ given the event ‘y’ (denoted as ‘\(P(x \vert y)\)’) is equal to the overall probability of ‘x’ (denoted as ‘P(x)’) times the probability of ‘y’ given ‘x’ (denoted as ‘\(P(y \vert x)\)’) divided by the overall probability of ‘y’ (denoted as ‘P(y)’). For example, if a server is analyzed for DDoS infection provided it receives inbound traffic with SYN signals, it may be denoted by Eq. (9).
5.1.3 Support vector machine
Support vector machine (SVM) is a popular classifier for data in high-dimensional space, i.e., data with large number of features. The idea is to find optimal hyperplanes and separate each dimension in a way that the margin between the closest points across hyperplanes is maximized. The closest points lying on separation boundaries are called support vectors. The idea is depicted in Fig. 5 for a two-dimensional space. SVM is a complex approach due to multidimensional computations [41].

SVM depiction in two-dimensional space
5.1.4 Random forest
Random forest (RF) is another popular classifier under supervised learning. One of the ideas behind RF is the concept of bagging which emphasizes on the fact that a single classifier may not produce an effective machine learning model for a number of reasons such as data imbalance, overfitting or parameterization errors, etc. Therefore, a combined result which is formed by taking individual outputs from a number of models can increase detection accuracy of machine learning model. In bagging approach, the results from individual classifiers are analyzed independently from each other. Another approach, called boosting, emphasizes on impacting the results based on the outcomes of other classifiers. The RF model is commonly applied with bagging approach where individual models are represented by decision trees [42]. Usually in the RF method, a dataset ‘D’ of ‘n’ samples is split into ‘S’ random subsets, each having a sample size of ‘r’ where \(r<n\). The value of ‘S’ is a configurable parameter in RF implementation.
5.1.5 Artificial neural network
Artificial neural network (ANN) is inspired by the human brain which works on interconnection of neurons (called synapses) and their learning methodology. The synapses are not real connections between neurons, but they only pass the signals virtually. In ANN, interconnected layers are introduced in a cascaded manner. The interconnections also have associated weights which are adjusted during the learning process and hence the bonding of interconnections grows up with updated weights [43]. A simple artificial neural network consists of input, hidden and output layers. The signals pass on from input layer to hidden layers (multiple hidden layers may exist), and then, finally to the output layer. This mechanism is known as feed forwarding. The weights are usually initialized with low and random values. Measuring the output after each epochFootnote 4, the error between detected values and actual target values of training data is calculated according to a specified cost function. The error is backpropagated from the output layer to hidden layers and then back to input layer. This mechanism is known as backpropagation.
A common implementation of activation function in ANN for hidden layers is rectified linear unit (ReLU) function [44] which is given in Eq. (10), where ‘f(x)’ is a function of input variable ‘x.’ The equation shows that output of ReLU is ‘x’ for ‘\(x > 0\)’ and zero for ‘\(x \le 0\).’
The output layer of ANN for binary classification problems is configured with the sigmoid activation function given in Eq. (11), where ‘f(x)’ is a function of input variable ‘x.’
There are different cost functions available to calculate error and update weights in ANN. The most common cost function is given in Eq. (12), where ‘C’ is calculated error, ‘\(y_{p}\)’ is detected output, and ‘y’ is actual output.
5.2 Improvements and analyses
Machine learning improvements and analyses module of the proposed strategic framework is a key element to validate the machine learning results and avoid possible overfitting and misleading accuracies. The details of steps inside machine learning improvements and analyses module are provided below:
5.2.1 Optimization
Machine learning algorithms are usually not the best fitting models in default state. There can be a number of tunable parameters to calibrate and adjust according to the algorithm used. It is usually done with ‘trial and error’ where different parameters or their combinations are checked to minimize the detection errors. Classification accuracy is a common metric of determining the effectiveness of an algorithm, i.e., higher accuracy leads to a better combination of parameters. For example, the number of neighbors that decide the class of a new data point is a configurable parameter of KNN algorithm. Hence an optimized value of ‘K’ can be sought to find the improved accuracy and less error rate. Kernel trick can be used for optimization in SVM models where radial basis function (RBF) is commonly deployed to obtain detections of nonlinear datasets. In ANN model, different number of hidden layers can be tested to observe if the accuracy improves or the error decreases.
5.2.2 Validation
Machine learning results in terms of accuracy and error rate on a specific formation of training and testing datasets may invite the overfitting problem. It can be a case where the training dataset is formed in such a way that all the features reflect in the same manner also in the test dataset. In such a case, accuracy readings can be so high due to the overfitting of training data. It can therefore lead to a false sense of the model’s effectiveness. To avoid this overfitting problem and trust the machine learning accuracy results, k-fold cross-validation is commonly used. In this technique, the train-test split is made in a randomized manner for ‘k’ number of times where ‘k’ different splits of the whole dataset are created in each round. There are ‘\(k-1\)’ splits of data for training and one split for testing. With each round, the testing split is changed and an accuracy score is measured. It validates that the applied configuration of parameters does not lead to overfitting if the change in accuracies remains within a short range of values.
5.2.3 Evaluation
The evaluation step is the last item in proposed strategy where different accuracy scores as well as the readings of other selected metrics can be compared to determine the best configuration approach for a machine learning model to obtain the best outcome. An important aspect of evaluation is to avoid the accuracy paradox which leads to a wrong sense of model’s accuracy by classifying the results only in one class for all data instances. It provides zero values for false positive and true negative readings but can still show high levels of accuracy. To avoid this paradox, a receiver operating characteristic (ROC) graph is plotted between true positive and false positive readings where the area under curve (AUC) provides the true accuracy of model’s classification.
The flow inside machine learning improvements and analyses module in Fig. 3 explains that the post machine learning steps of optimization, validation and evaluation can be executed in a repeatable and iterative manner. The repetition of steps can be decided by observing the values whether they fall within predetermined threshold ranges. The thresholds and resulting actions are expressed in Algorithm 2.

5.3 Experimental results
The experiments are conducted under specified flow. Each dataset is input to a particular machine learning model one-by-one and then analysis is made under different settings for optimal response. Algorithm 3 represents the flow of experimental analysis. The experiments with feature sets under consideration are performed using scikit-learn machine learning library of Python programming language [45]. Different classes pertaining to KNN, NB, SVM, and RF are imported to use and create objects for learning and detection. 70% of the data is used for training, whereas remaining 30% is used for testing. The split of 70:30 is one of the common techniques of analysis [21]. However, other splits are also used such as 60:40 [34]. It means that out of 1,048,575 dataset instances, 734,002 are randomly selected for training and 314,573 are used for testing & validation. The classification accuracy and other metrics on test data are used to determine the effectiveness of applied model. For ANN-based machine learning experiments, TensorFlow library is used with Python language to program neural network objects [46].

5.3.1 Results with KNN
The experiment with KNN model involves optimizing the ‘K’ value for different algorithm runs while working on the individual feature sets (DS00_Full, DS01_PVal, DS02_Chi2, DS03_IG). It is observed that with the default value of 5 neighbors (K=5), the accuracy scores of DS00_Full, DS01_PVal, DS02_Chi2, and DS03_IG are 92.95%, 93.08%, 91.59%, and 93.36%, respectively, which show that the accuracy persists with a very low impact even with 7 features of DS02_Chi2 and DS03_IG versus 22 features of DS00_Full. However, the default parameter of 5 neighbors is not an optimal value in all cases. Each dataset is studied for different K-values ranging from 1 to 50 against the average error rate. It is observed that the optimal K-values are 10, 8, 4, and 6 for datasets DS00_Full, DS01_PVal, DS02_Chi2, and DS03_IG, respectively. For example, examining K-values against error rates for dataset DS00_Full is shown in Fig. 6. The optimal K-value here is 10 as it shows the least rate of error. Table 10 shows machine learning results obtained with default and optimized parameter settings of given values for each dataset under KNN algorithm.

K-value versus Error rate of ‘DS00_Full’ dataset
5.3.2 Results with NB
The experiment with NB algorithm involves comparing the model’s performance between two classifiers namely multinomial and Gaussian. The multinomial classifier detects output on the basis of counts of an incident’s occurrence. Hence, it assumes that all input features represent discrete data. On the other hand, the Gaussian classifier is a better fit for continuous data under normal distribution. While comparing accuracy scores, the overall performance of Gaussian classifier is found to give optimized results under configurations of naive Bayes machine learning. Accuracy obtained for dataset ‘DS02_Chi2’ with default classifier (MultinomialNB) is less than 85% (threshold criterion of acceptance under Algorithm 2); hence, this paper discourages MultinomialNB classifier for ‘DS02_Chi2’ dataset under naive Bayes machine learning. However, NB-based machine learning model for ‘DS02_Chi2’ dataset is possible to obtain for given data of DDoS problem with optimized classifier (‘GaussianNB’) as it provides accuracy score of 87.1098%. Table 11 shows machine learning results obtained with default and given optimized parameter settings for each dataset under naive Bayes algorithm.
5.3.3 Results with SVM
SVM is a very powerful method of detections in high-dimensional space. In this analysis, different combinations of SVM-related parameters are used to find the optimal response. Under two different kernel functionsFootnote 5, i.e., ‘Radial Basis Function (RBF)’ and ‘Sigmoid,’ four different values of each of the ‘C’ parameter (SVM’s penalty parameter) and \(\gamma \) (the kernel coefficient) are applied. The values of ‘C’ and ‘\(\gamma \)’ parameters examined are (\(C = 1, 10, 100, 1000\)) and (\(\gamma = 1, 0.1, 0.01, 0.001\)). To automate the process of obtaining the best combination of these parameters, the grid search technique is used in Python. For all tested cases, ‘RBF’ remains the dominant kernel while some changed ‘C’ and ‘\(\gamma \)’ values are observed for optimal responses specially in low-dimensional space of ‘DS02_Chi2’ and ‘DS03_IG’ datasets. The value \(\gamma = \textit{auto}\) is default state of SVC object in Python. The term ‘auto’ represents a value equal to 1 / n where ‘n’ is the number of input features in a given dataset. Moreover, the penalty parameter ‘C’ takes a decreasing trajectory while the kernel coefficient (\(\gamma \)) increases with reduced number of features. Table 12 shows machine learning results obtained with default and given optimized parameter settings for each dataset under SVM algorithm.
5.3.4 Results with RF
RF is another powerful method of detections via ensemble approach where a number of decision trees vote for the final output. In this analysis, different combinations of RF-related parameters are used to find the optimal response. Under two different decision tree output criteria, i.e., ‘Gini impurity’ and ‘Entropy,’ four different values of ‘n_estimators’ parameter (no. of decision trees behind RF’s final output) are applied. The values of ‘n_estimators’ parameter examined are (n_estimators = 10, 100, 500, 1000). To automate the process of obtaining the best combination of these parameters, the grid search technique is used. For all tested cases, ‘Entropy’ remains the dominant criterion for optimal response except low-dimensional space of ‘DS02_Chi2’ dataset where a larger share of discrete variables shows that ‘Gini impurity’ is suitable for such kind of features. The default decision criterion ‘Gini impurity’ is a method used by CART (Classification and Regression Tree) algorithm [47] of decision tree classificationFootnote 6. It is a measure of misclassification frequency an element of the dataset may receive. Gini impurity of an element with a label ‘j’ can be computed by the sum of probability \(p_{j}\) of label ‘j’ being selected times the probability of mistake in categorizing that element. Equation (13) gives the derived computation of gini impurity.
In Eq. (13), I\(_\mathrm{GINI}\) is the gini impurity calculated for a set of elements having ‘N’ classes where \(j \in \{1, 2,\ldots ,N\}\). Table 13 shows machine learning results obtained with default and given optimized parameter settings for each dataset under RF algorithm.

ANN architecture for optimized analysis of ‘DS00_Full’ dataset
5.3.5 Results with ANN
The experiments with ANN include numerous examinations under various settings. After careful examination and calibration, it is found that two hidden layers can be used for optimal response of the network with feature sets under consideration. Therefore, the comparisons are made for artificial neural networks of one versus two hidden layers for each dataset. Examinations also reveal that for both types of network settings (default and optimized), a well-calibrated combination of number of epochs and batch size can be 500 and 10,000 respectively. Under such configurations, behavior of one hidden layer versus two hidden layers is analyzed using ReLU (rectified linear unit) activation function mentioned in Eq. (10). The output of ReLU function is 0 for input 0 or less; otherwise, the output is same as input for positive values. The number of neurons in first hidden layer is configured to be d/2 where ‘d’ is the number of input connections from previous (input) layer. For the only hidden layer in case of default ANN or first hidden layer in case of optimized ANN, the hidden neurons are configured to be 11 and 8 for ‘DS00_Full’ and ‘DS01_PVal’ as they have 22 and 16 input features, respectively. For ‘DS02_Chi2’ and ‘DS03_IG’ datasets, the neurons at first hidden layer are 4 as they both have 7 features at input layer (half of 7 is 3.5, so it is decided to take 4 neurons at the hidden layer). On the other hand, the second hidden layer in case of optimized ANN for all datasets contains the same number of neurons as the first hidden layer. These values are driven by careful testing in experimentation phase. For ANN model, the default and optimized configurations of hidden layers and respective number of neurons for datasets are applied using ‘Keras’ machine learning library with ‘TensorFlow’ in background. The output layer is configured with ‘Sigmoid’ activation for binary classification of ‘Normal’ and ‘DDoS’ classes. ‘Adam’ optimizer governs the gradient descent, and loss function of ‘binary_crossentropy’ establishes the criterion of finding cost while calculating accuracies. The initial weights in the network are assigned ‘uniform’ values. Table 14 shows machine learning results obtained with default and optimized parameter settings of given values for each dataset under ANN algorithm. Figure 7 depicts the architecture of ANN for optimized analysis of DS00_Full dataset which gives the highest accuracy mentioned in Table 14.
5.4 k-fold cross-validation
The experimental results are obtained after k-fold cross-validation, a technique commonly used to ascertain the accuracy results of machine learning algorithms. In order to avoid overfitting and validate the right parameter tuning of an algorithm, k-fold cross-validation is configured with 10 splits (\(k=10\)) and an accuracy score is measured for each of the 10 rounds with different test data each time. In this paper, the ranges are defined as thresholds expressed in Algorithm 2 (point ‘b’). An example is taken for the dataset ‘DS00_Full’ where optimized accuracy is 93.5090% under KNN algorithm with ten neighbors. For 10-fold cross-validation, we get 10 accuracies in return. These accuracies are compared with the accuracy value of 0.935090, and it is found that the standard deviation is just 0.65%, whereas the mean accuracy is just 0.29% above the initially obtained value of 0.935090. Both these conditions fulfill the criteria given in Algorithm 2; hence, the accuracy score of 0.935090 is validated. The standard deviation of more than 5% may indicate that the initially obtained accuracy is the result of one-time incidental formation of over-fitted training data because high deviations in accuracies would be observed in validation phase. Also, the mean value of accuracies more or less than 2% of initially obtained accuracy may indicate that the validation phase formulates training splits significantly different from the split used in initially trained environment. It signifies the importance of validation phase in the proposed framework of Fig. 3. If the criteria mentioned in Algorithm 2 (point ‘b’) is not fulfilled, the steps of optimization and validation are repeated to check if there is a possibility to meet the criteria of Algorithm 2. Otherwise, machine learning algorithm is discouraged for the given dataset and related problem.
5.5 AUC analyses and discussion with comparisons
The evaluation step of proposed framework in Fig. 3 involves evaluating the accuracies in terms of area under curve (AUC) with receiver operating characteristic (ROC). It helps avoid the accuracy paradox, a term which refers to a fact that confusion matrix can provide values of true and false classifications at a single operating point [48]. This condition leads to a paradox where the given accuracy value may not be valid for other operating points or changes in the model’s performance. To avoid accuracy paradox, the ROC graph is plotted between true positive and false positive rates and AUC statistic provides real accuracy of the model for varying rates. In order to make this evaluation acceptable for the proposed framework, AUC accuracies must follow the accuracies calculated via confusion matrices. If the criteria mentioned in Algorithm 2 (point ‘c’) of evaluation is not fulfilled, the steps of optimization and validation are repeated to check if it is possible to meet the criteria of Algorithm 2. Otherwise, machine learning algorithm is discouraged for the given dataset and related problem. For comparisons of results, the AUC scores are compared in two ways. First it is observed how a specific machine learning algorithm performs for different datasets (Sect. 5.5.1), and secondly it is analyzed how a particular dataset carrying significant features is effective to be used by different algorithms in terms of optimized AUC scores (Sect. 5.5.2).

AUC analyses of ROC curves for KNN machine learning model across different datasets

AUC analyses of ROC curves for NB machine learning model across different datasets

AUC analyses of ROC curves for SVM machine learning model across different datasets

AUC analyses of ROC curves for RF machine learning model across different datasets

AUC analyses of ROC curves for ANN machine learning model across different datasets
5.5.1 Comparison of machine learning algorithms across datasets
Figures 8, 9, 10, 11 and 12 show AUC scores of various machine learning algorithms for different datasets analyzed in this research. It is observed that ‘DS00_Full’ dataset shows the highest accuracy scores for all machine learning algorithms except RF model. The AUC scores of ‘DS00_Full’ dataset for KNN, NB, SVM, and ANN models are 93.5318%, 93.2577%, 93.5319%, and 93.5319%, respectively. However, in SVM model, two other datasets, i.e., ‘DS01_PVal’ and ‘DS03_IG’ exhibit the same AUC score. On the other hand, in RF model, the highest score is shown by ‘DS02_Chi2’ dataset (93.2473%) followed by ‘DS03_IG’ (93.1832%). The overall highest score, i.e., 93.5319% is observed for ‘DS00_Full’ dataset with SVM and ANN algorithms, and also for datasets ‘DS01_PVal’ and ‘DS03_IG’ with SVM algorithm. KNN algorithm exhibits the best performance overall as its AUC scores for all datasets remain above 93%. The scores show that with an approximate difference of only 0.03% in accuracies, the possible reduction in the feature set is about 68%, i.e., 22 features of ‘DS00_Full’ versus 7 features each of ‘DS02_Chi2’ and ‘DS03_IG’ having minimal performance hit. It is followed by SVM algorithm where the model is able to retain high scores of accurate detections while moving from a large dataset in terms of features (‘DS00_Full’ with 22 features) to a smaller one (‘DS03_IG’ with 7 features). However, low-dimensional datasets, i.e., ‘DS02_Chi2’ and ‘DS03_IG’ are better dealt by RF model as compared to high-dimensional datasets, i.e., ‘DS00_Full’ and ‘DS01_PVal.’ The NB model’s MultinomialNB classifier is discouraged for chi-squared-driven dataset of significant features. This model does not fit well the data of discrete features even with the optimized GaussianNB classifier; however, it performs well for another dataset of the same number of features when more continuous data is carried by the features (AUC score: 87.1545% for ‘DS02_Chi2’ vs. 92.7203% for ‘DS03_IG’). A machine learning model’s accuracy is heavily dependent on the type of feature values, i.e., discrete or continuous. It is observed that a model’s accuracy is affected as soon as it jumps from ‘DS01_PVal’ dataset (16 features with more continuous data) to ‘DS02_Chi2’ (7 features with more discrete data) but tries to regain better performance when applied to the ‘DS03_IG’ dataset (7 features with more continuous data) without a change in dimensionality. This fact is obvious from Figs. 9, 10 and 11. In fact, ‘DS03_IG’ is the most promising dataset as its AUC scores remain competitive with other datasets under all machine learning models while having the least dimensionality, i.e., 7 input features. The reason of this competitive performance even with a small number of features is the fact that all features of ‘DS03_IG’ dataset are not only the most significant but also continuous variables.
5.5.2 Comparison of datasets across machine learning algorithms
Figures 13, 14, 15 and 16 show AUC scores across various machine learning algorithms exhibited by different datasets analyzed in this research. Feature engineering is an important aspect of proposed strategic framework and applying it aims to select the most significant variables among the available features. As a result, the datasets are produced with reduced number of features. This reduction does not only provide a list of feature significance related to the problem under consideration but also helps applying the machine learning with reduced processing overhead. However, elimination of insignificant features from a dataset can still produce a degraded performance which is mostly acceptable due to slight decrease in accuracies. Still there are features which negatively impact the detection, and their elimination can produce enhanced performance of machine learning algorithms. From Figs. 13, 14, 15 and 16, it is observed that the dataset ‘DS00_Full’ exhibits the best detection accuracy in terms of AUC scores with SVM and ANN machine learning models (AUC score: 93.5319%). Although a comparatively high number of features introduces more processing overhead for algorithms, the relevance of features still play its role toward improved accuracy scores.

AUC analyses of ROC curves for ‘DS00_Full’ dataset across different machine learning algorithms

AUC analyses of ROC curves for ‘DS01_PVal’ dataset across different machine learning algorithms

AUC analyses of ROC curves for ‘DS02_Chi2’ dataset across different machine learning algorithms

AUC analyses of ROC curves for ‘DS03_IG’ dataset across different machine learning algorithms
The dataset ‘DS01_PVal’ also shows the best AUC score with SVM machine learning model (AUC score: 93.5319%). It shows that under the SVM model, dataset ‘DS01_PVal’ has similar detection accuracy as compared to ‘DS00_Full’ dataset but with reduced number of features (22 vs. 16 input variables). It shows that six (6) most insignificant features are eliminated from dataset ‘DS01_PVal’ while keeping similar level of information for accurate detections by machine learning algorithms. It is helpful for the algorithms to process same information with reduced processing overhead. AUC scores shown by ‘DS01_PVal’ dataset are also close to the best score under KNN and ANN models, while the performance is still promising under NB and RF models too.
The dataset ‘DS02_Chi2’ has 5 discrete feature types out of 7 total features. This has made the ‘DS02_Chi2’ dataset different in terms of AUC scores obtained with various machine learning algorithms as shown in Fig. 15. The best AUC score of the dataset is 93.5110% obtained with KNN algorithm followed by the score of 93.2473% shown with RF model. In fact, the RF model shows its best detection score for the dataset ‘DS02_Chi2.’ The low-dimensional datasets in this research are better dealt by the RF model as compared to high-dimensional datasets. It also indicates that the RF model is better to implement when the considerable amount of data in a dataset is contained by the features of discrete data types. While SVM and ANN models also show competitive AUC scores of 92.7165% and 90.9810%, respectively, the NB model with GaussianNB classifier has the least score of 87.1545%.
‘DS03_IG’ is the most promising dataset with AUC scores of more than 93% under four of the five machine learning algorithms, i.e., KNN, SVM, RF, and ANN. Although ‘DS00_Full’ and ‘DS01_PVal’ also exhibit the same level of detections, but a considerable amount of feature reduction in ‘DS03_IG’ makes it a winner among the others. Hence, this study not only highlights the importance of information gain criterion for feature significance, it also shows how similar detection scores as compared to high-dimensional data are possible with nearly one-third of the processing overhead. The best AUC score for ‘DS03_IG’ is obtained with SVM model (93.5319%) followed by KNN model (93.5214%). The ANN, RF, and NB algorithms also produce competitive detection accuracies (93.3002%, 93.1832%, and 92.7203%, respectively). All of the seven variables with continuous data in ‘DS03_IG’ represent flow-level features of network traffic. It highlights the feature engineering efforts of this research including the elimination of features with domain knowledge where the flow-level features are given more importance over packet-level features.
5.5.3 Comparison for overall performance
Figures 17 and 18 show that KNN turns out to be the best algorithm in experimental analyses of this research followed by SVM, whereas ‘DS03_IG’ is the most promising dataset. Figure 17 reveals that all datasets provide AUC scores of more than 93% only with the KNN machine learning algorithm. SVM and ANN are also competitive models where only ‘DS02_Chi2’ dataset has below 93% AUC scores. However, SVM model is still better than ANN in terms of AUC scores. The dataset ‘DS03_IG’ tries to maintain high accuracy across various machine learning models. In Fig. 18, it is shown that minimum errors are observed with KNN model across various datasets whereas SVM has also low errors except ‘DS02_Chi2’ dataset. On the other hand, the dataset ‘DS03_IG’ also tries to maintain low errors across different machine learning algorithms.

Optimized AUC scores of datasets

Error rates of datasets with optimized settings
5.5.4 Comparison with related work approaches
In Table 15, a comparison of this work is provided with other related works mentioned in Sect. 2. It is observed that the detection accuracy of this work is competitive to other approaches. In addition to this, our work offers more elements of trust in DDoS attack detections by following the strategy to avoid generally inbuilt problems of machine-mined data such as collinearity, multicollinearity and duplication. It proposes a strategic framework to encompass a thorough treatment of features followed by the machine learning improvements.
6 Conclusion and future work
In this paper, the problem of DDoS attacks is addressed with a proposed strategic-level framework to improve machine learning approach of DDoS detection and mitigation. Application layer DDoS attacks are more difficult to detect with traditional solutions as they appear legitimate at the underlying layers. The proposed framework in this research includes two major components, i.e., Feature engineering and Machine learning with improvements and analyses. Both feature engineering and machine learning are applied on a given DDoS dataset, and it is emphasized that a strategic framework can apply feature engineering and machine learning in a comprehensive manner to detect DDoS attacks while avoiding the overfitting and collinearity. Fifteen features are initially removed with feature elimination under domain knowledge and flow-level features are prioritized over packet-level features. First, a dataset of 22 features is obtained which is called ‘DS00_Full’ in this paper. From ‘DS00_Full,’ three more datasets, i.e., ‘DS01_PVal,’ ‘DS02_Chi2,’ and ‘DS03_IG’ are extracted by applying the feature selection methods of p-value (t-statistic test), Chi2, and information gain with 16, 7, and 7 features, respectively. Five supervised machine learning algorithms, i.e., K-nearest neighbors (KNN), naive Bayes (NB), support vector machines (SVM), random forest (RF), and artificial neural network (ANN) are applied on the four datasets to detect DDoS attacks. The classification metrics include accuracy, true\(\backslash \)false positives, true\(\backslash \)false negatives, and error. Each machine learning model is first applied with default parameters and then with optimized parameter settings for given sets of values to obtain the optimal response. After k-fold cross-validation with \(k=10\), the analysis is made with area under curve (AUC) calculations of receiver operating characteristic (ROC) curve to evaluate optimized accuracies. ‘DS00_Full’ dataset shows the highest accuracy scores for all machine learning algorithms except RF model. The highest AUC score of ‘DS00_Full’ dataset is 93.5319% for SVM and ANN models. The KNN algorithm exhibits the best performance overall followed by SVM algorithm, whereas low-dimensional data is better analyzed by the RF algorithm. The NB model’s multinomial classifier is discouraged for analysis of chi-squared-driven dataset due to the reason that model’s accuracy remains below the threshold of acceptance as per the criterion set in this research. However, the NB model can still be used with Gaussian classifier to get optimized accuracy. ‘DS03_IG’ is the most promising dataset as its AUC scores remain competitive with other datasets under all machine learning experiments. A small set of features of this dataset also makes it a good choice for substantial reduction in the processing overhead.
In future, more experiments may be conducted to include diversity of the machine learning algorithms, e.g., supervised, unsupervised, and semi-supervised models across multiple DDoS-related datasets. Also, the feature selection is a wide open research area and we believe that hybrid methods of feature selection using various approaches of statistical tools and meta heuristics such as random search or genetic algorithm can be the most effective way of feature selection for DDoS attack detections.
Notes
The wrapper method applies a regressor on the identified feature and validates its significance with accuracies of regression. Another approach is the filter method which directly selects the features based on statistical scores without any validation approach of regression.
The data curves are supposed to be normal distributions where sample size > 30. As the population mean is not known and we are only dealing with samples, the t-statistic test is applied
Epoch is a round of completion when all the records of a dataset have been fed to the neural network. If epoch No. 1 is just completed, all the records will again be fed in epoch No. 2 and so on. It is not necessary that all the records are fed simultaneously or sequentially in one batch for an epoch. This part is driven by the batch size parameter which is configurable for ANN.
Making a change in kernel according to the underlying data is termed as ‘kernel trick.’
CART is one of the decision tree algorithms. There is a bunch of others including ID3, C4.5, MARS (multivariate adaptive regression splines) etc.
References
Mitrokotsa, A., Douligeris, C.: Denial of Service Attacks, Network Security: Current Status and Future Directions, pp. 117–134. Wiley, Hoboken (2006)
Zhang, L., Yu, S., Wu, D., Watters, P.: A survey on latest botnet attack and defense. In: 10th International Conference on Trust, Security and Privacy in Computing and Communications (TrustCom), IEEE, pp. 53–60 (2011)
State of the Internet Security—Q4 2017, Report from Akamai, 4(4), (2018)
Nagesh, K., Sumathy, R., Devakumar, P., Sathiyamurthy, K.: A survey on denial of service attacks and preclusions. In: International conference on informatics and analytics, p. 118 (2016)
KDD Cup 1999 Dataset. http://kdd.ics.uci.edu/databases/kddcup99/kddcup99.html
CAIDA DDoS Attack 2007 Dataset. http://www.caida.org/data/passive/ddos-20070804_dataset.xml
CAIDA Anonymized Internet Traces 2008 Dataset. http://www.caida.org/data/passive/passive_2008_dataset.xml
Tavallaee, M., Bagheri, E., Lu, W., Ghorbani, A.A.: A detailed analysis of the KDD CUP 99 data set. In: Symposium on Computational Intelligence for Security and Defense Applications (CISDA), IEEE, pp. 1–6 (2009)
ISOT Botnet Dataset. https://www.uvic.ca/engineering/ece/isot/datasets/index.php
The Honeynet Project. http://www.honeynet.org/chapters/france
Shiravi, A., Shiravi, H., Tavallaee, M., Ghorbani, A.A.: Toward developing a systematic approach to generate benchmark datasets for intrusion detection. Comput. Secur. 31(3), 357–374 (2012)
Moustafa, N., Slay, J.: UNSW-NB15: a comprehensive data set for network intrusion detection systems (UNSW-NB15 network data set). In: Military Communications and Information Systems Conference (MilCIS), pp. 1–6 (2015)
Gao, Y., Feng, Y., Kawamoto, J., Sakurai, K.: A machine learning based approach for detecting DRDoS attacks and its performance evaluation. In: 11th Asia Joint Conference on Information Security (AsiaJCIS), pp. 80–86 (2016)
Singh, N.A., Singh, K.J., De, T.: Distributed denial of service attack detection using Naive Bayes classifier through info gain feature selection. In: International Conference on Informatics and Analytics, p. 54 (2016)
Azab, A., Alazab, M., Aiash, M.: Machine learning based botnet identification traffic. In: Trustcom/BigDataSE/I SPA, IEEE, pp. 1788–1794 (2016)
Yusof, A.R., Udzir, N.I., Selamat, A., Hamdan, H., Abdullah, M.T.: Adaptive feature selection for denial of services (DoS) attack. In: IEEE Conference on Application, Information and Network Security (AINS), IEEE, pp. 81–84 (2017)
Singh, K.J., De, T.: Efficient classification of DDoS attacks using an ensemble feature selection algorithm. J. Intell. Syst (2017). https://doi.org/10.1515/jisys-2017-0472
Khan, S., Gani, A., Wahab, A.W.A., Singh, P.K.: Feature selection of Denial-of-Service attacks using entropy and granular computing. Arab. J. Sci. Eng. 43(2), 499–508 (2018)
Alejandre, F.V., Corts, N.C., Anaya, E.A.: Feature selection to detect botnets using machine learning algorithms. In: International Conference on Electronics, Communications and Computers (CONIELECOMP), pp. 1–7 (2017)
Al-Hawawreh, M.S.: SYN flood attack detection in cloud environment based on TCP/IP header statistical features. In: 8th International Conference on Information Technology (ICIT), pp. 236–243 (2017)
Li, J., Liu, Y., Gu, L.: DDoS attack detection based on neural network. In: 2nd International Symposium on Aware Computing (ISAC), pp. 196–199 (2010)
Agrawal, P.K., Gupta, B.B., Jain, S., Pattanshetti, M.K.: Estimating Strength of a DDoS Attack in Real Time Using ANN Based Scheme, Computer Networks and Intelligent Computing, pp. 301–310. Springer, Berlin (2011)
Gupta, B.B., Joshi, R.C., Misra, M., Jain, A., Juyal, S., Prabhakar, R., Singh, A.K.: Predicting Number of Zombies in a DDoS Attack Using ANN Based Scheme, Information Technology and Mobile Communication, pp. 117–122. Springer, Berlin (2011)
Bansal, A., Mahapatra, S.: A comparative analysis of machine learning techniques for botnet detection. In: 10th International Conference on Security of Information and Networks, pp. 91–98 (2017)
Lu, L., Feng, Y., Sakurai, K.: C&C session detection using random forest. In: 11th International Conference on Ubiquitous Information Management and Communication, p. 34 (2017)
Zekri, M., El Kafhali, S., Aboutabit, N., Saadi, Y.: DDoS attack detection using machine learning techniques in cloud computing environments. In: 3rd International Conference of Cloud Computing Technologies and Applications (CloudTech), pp. 1–7 (2017)
Yuan, X., Li, C., Li, X.: DeepDefense: identifying DDoS attack via deep learning. In: International Conference on Smart Computing (SMARTCOMP), IEEE, pp. 1–8 (2017)
Alkasassbeh, M., Al-Naymat, G., Hassanat, A.B., Almseidin, M.: Detecting distributed denial of service attacks using data mining techniques. Int. J. Adv. Comput. Sci. Appl. 7(1), 436–445 (2016)
Singh, K., Singh, P., Kumar, K.: Application layer HTTP-GET flood DDoS attacks: research landscape and challenges. Comput. Secur. 65, 344–372 (2017)
Tripathi, N., Hubballi, N.: Slow rate denial of service attacks against HTTP/2 and detection. Comput. Secur. 72, 255–272 (2018)
Jonker, M., King, A., Krupp, J., Rossow, C., Sperotto, A., Dainotti, A.: Millions of targets under attack: a macroscopic characterization of the DoS ecosystem. In: Internet Measurement Conference, pp. 100–113 (2017)
Aamir, M., Zaidi, M.A.: A survey on DDoS attack and defense strategies: from traditional schemes to current techniques. Interdiscip. Inf. Sci. 19(2), 173–200 (2013)
Shakeel, F., Sabhitha, A.S., Sharma, S.: Exploratory review on class imbalance problem: an overview. In: 8th International Conference on Computing, Communication and Networking Technologies (ICCCNT), pp. 1–8 (2017)
Idhammad, M., Afdel, K., Belouch, M.: Semi-supervised machine learning approach for DDoS detection. Appl. Intell. 48, 1–16 (2018)
Haixiang, G., Yijing, L., Shang, J., Mingyun, G., Yuanyue, H., Bing, G.: Learning from class-imbalanced data: review of methods and applications. Expert Syst. Appl. 73, 220–239 (2017)
Miller, S., Busby-Earle, C.: The role of machine learning in botnet detection. In: 11th International Conference for Internet Technology and Secured Transactions (ICITST), pp. 359–364 (2016)
Kirubavathi, G., Anitha, R.: Botnet detection via mining of traffic flow characteristics. Comput. Electr. Eng. 50, 91–101 (2016)
Osanaiye, O., Choo, K.-K.R., Dlodlo, M.: Analysing feature selection and classification techniques for DDoS detection in cloud. In: Proceedings of Southern Africa Telecommunication (2016)
Larose, D.T., Larose, C.D.: k-Nearest neighbor algorithm. Discovering Knowledge in Data: an Introduction to Data Mining, 2nd edn, pp. 149–164. John Wiley & Sons (2014)
Wu, X., et al.: Top 10 algorithms in data mining. Knowl. Inf. Syst. 14(1), 1–37 (2008)
Suthaharan, S.: Support Vector Machine, Machine Learning Models and Algorithms for Big Data Classification, pp. 207–235. Springer, Berlin (2016)
Breiman, L.: Random forests. Mach. Learn. 45(1), 5–32 (2001)
Nielsen, M.A.: Neural Networks and Deep Learning. Determination Press (2015). http://neuralnetworksanddeeplearning.com/
Glorot, X., Bordes, A., Bengio, Y.: Deep sparse rectifier neural networks. In: 14th International Conference on Artificial Intelligence and Statistics, pp. 315–323 (2011)
scikit-learn: Data science library for Python. https://pypi.org/project/scikit-learn/
TensorFlow: Open source ML platform. https://www.tensorflow.org/
Loh, W.-Y.: Classification and regression trees. Wiley Interdiscip. Rev. Data Min. Knowl. Discov. 1(1), 14–23 (2011)
Bradley, A.P.: The use of the area under the ROC curve in the evaluation of machine learning algorithms. Pattern Recognit. 30(7), 1145–1159 (1997)
Author information
Authors and Affiliations
Corresponding author
Ethics declarations
Conflict of interest
The authors declare that they have no conflict of interest.
Ethical approval
This article does not contain any studies with human participants or animals performed by any of the authors.
Additional information
Publisher's Note
Springer Nature remains neutral with regard to jurisdictional claims in published maps and institutional affiliations.
Rights and permissions
About this article

Cite this article
Aamir, M., Zaidi, S.M.A. DDoS attack detection with feature engineering and machine learning: the framework and performance evaluation. Int. J. Inf. Secur. 18, 761–785 (2019). https://doi.org/10.1007/s10207-019-00434-1
Published:
Issue Date:
DOI: https://doi.org/10.1007/s10207-019-00434-1