
Abstract
Conceptual models represent the Organizational domain for which an information system is developed. These models are important tools in defining the requirements for the system. When describing an Organization or part of it, a key concept is the notion of roles played by actors in the domain. Actors in an Organization act in various roles, hence, showing that roles in a conceptual model can promote understanding of how the Organization works. However, despite the importance of roles in understanding Organizations and their prevalence in various aspects of information systems development, no consensus exists on what roles are, or how to represent them in conceptual models. In this paper, we formally define role as a conceptual modeling construct based on literature analysis, ontological concepts, and principles of classification. Using this definition, we derive guidelines for representing roles in conceptual models and suggest rules for modeling roles with the widely used extended entity-relationship grammar. Finally, we test the effectiveness of the modeling rules by conducting an experimental study to compare the domain understanding of readers using two types of conceptual modeling scripts. One script was obtained by violating the rules and the other by not violating the rules. We obtained data on domain understanding (using problem-solving questions) and on the process of understanding (using eye tracking). The results indicate that the role-based rules are not only useful for understanding the models but also provide direct clues as to why this is so.
1 Introduction
Because any information system (IS) is built upon a model of a domain [1], IS professionals have long stressed the need to construct such models well [2]. In this paper, we focus on the construction of conceptual models, also known as conceptual modeling scripts. Conceptual models represent the domain supported by the IS independent of implementation details [3], with the goal of improving stakeholders’ understanding of the domain [4].
Requirements engineering researchers have long been interested in the use of conceptual models in requirements engineering [5, 6], their appropriate formulation [7, 8], and their empirical evaluation [9, 10].
The general purpose of our study is to test a method for improving the ability of a conceptual model to represent a domain, thereby improving stakeholders’ domain understanding.
Conceptual modeling has long been a key topic in research and practice [11, 12]. Originally, modelers focused on technical aspects. For instance, data modelers “concentrated on the physical structure of databases [rather than] user’s perception[s]” [13, p. 155]. Over time, however, modelers began to focus more on the real-world domain being modeled. For instance, rather than focusing on features of databases, such as relations/keys, Chen’s [14] ER grammar focused on features of the real world, such as entities, attributes, and relationships. Other researchers extended this idea, suggesting that semantic data models should model other features of the real world as well, such as parts and wholes (aggregation) and classes and subclasses (classification) [13, 15]. Outside the database field, researchers began modeling additional real-world concepts, such as goals [16].
As Hull and King [13, 15] asked, how can one determine the relevant set of real-world concepts for a grammar? This has been the driving question for over 20 years of research on the ontological foundations of conceptual modeling [17, 18]. Such researchers have used ontological theory to describe what real-world concepts are likely to be salient in a given domain [19] and how best to define and use constructs such as classes [20], attributes [21, 22], and relationships [23].
We extend this line of work by examining the concept of a “role”. Specifically, we study the representation of roles in conceptual modeling. This concept differs from those examined in past ontological work which mostly focused on well-known data modeling constructs such as classes, attributes, and relationships. The concept of a role is less well known in conceptual modeling and, we argue, greatly underemphasized relative to its real-world importance. To our knowledge, there are currently no clear guidelines for modeling roles. We extend past work by formally defining the concept of a role, and we propose the first method for representing roles clearly and explicitly in conceptual models. Our method is powerful in that it allows modelers to show several characteristics of roles that are known to be critical but that cannot be shown clearly and explicitly with existing modeling approaches. Moreover, our method can be applied without changing the syntax of existing modeling grammars. The specific purpose of our study is to propose this new method and test whether it improves Individuals’ domain understanding.
Our paper is structured as follows. In the next section, we provide some background on the concept of roles and approaches for modeling them. The subsequent section formalizes the notion of role in light of ontological theory and classification theory. We then propose our method for modeling roles and describe an experiment we conducted to test it. After discussing the results of the experiment, which support our method, we discuss the implications of our study and conclude the paper.
2 Background
It is difficult to overstate the importance of understanding roles. Biddle [24, pp. 67–68] writes that roles are “one of the most important characteristics of social behavior,” Walsh and Ungson [25] write that roles are the “key constituents of Organizational structure,” and Steimann [26, p. 102] writes that “[t]he concept of role is such a fundamental one that it is hard to avoid it when talking about the world.” Our paper is motivated by the belief that existing conceptual modeling grammars do not do justice to the importance of roles in Organizations. We focus on models of the static structure of a domain, sometimes called conceptual data models. We recognize that roles are also relevant for models of dynamics. For instance, business process modelers can use the “lane” and “pool” constructs to describe different roles in a business [27]. However, these constructs capture only a partial view of roles; they do not support modelers in showing that instances acquire different properties when interacting in different roles, that different types of actors can play the same role (e.g., a customer can be an Individual or a company), or that a single type of actor can have different roles. While we believe that the role concept is understudied in all conceptual modeling grammars, we focus on models of static structure for reasons of scope; future work could supplement ours by focusing on models of the dynamics of a domain.
Our argument is not that there are no concepts for representing roles in conceptual data models. Indeed, we will show that modelers can use existing data modeling concepts to show roles. Rather, there are two problems.
The terminological problem is that there are existing methods for representing roles, but these methods do not represent the true nature of a real-world role; they are modeling something else. For instance, Chen [14] included roles in his original ER specification. However, Chen’s roles mean something else—they are just annotations that help clarify the semantics of relationships. As he explained (p. 12): “the role of an entity in a relationship is the function that it performs in the relationship.” This definition is widespread in conceptual data modeling, e.g., in EER and UML [28]. Such a definition is problematic as it can easily include phenomena that are not really roles. Consider the Object-Role-Modeling grammar (ORM). While ORM goes further than ER grammar by having a specific construct to represent roles, ORM still defines roles in the same way—as a description of a relationship [29, 30]. For instance, an ORM modeler can specify the role “has” between an object and a value of one of its properties. As will become clear in the next section, this simply does not represent the true nature of a real-world role.Footnote 1
In addition to this terminological problem, the substantive problem is that there is no detailed method for representing roles clearly and explicitly in conceptual data models. As a result, there is no way for readers of conceptual models to know what to look for in a conceptual model if they want to learn about roles in a domain. Given the importance of roles in Organizations (as noted above), this means that conceptual models are currently not as informative as they should be. To illustrate the lack of guidance in the literature, we checked ten database textbooks for guidance on modeling roles. As Table 1 shows, none of them offered guidelines for modeling roles. Only one of the ten text books contained patterns for modeling roles, but even in this case, the patterns alone were insufficient.
Thirty years ago in sociology, Biddle [24] made a similar argument to us—that the role concept was widely used, but only superficially; it needed to be defined more clearly and studied more deeply. Steimann [31] was perhaps the first to state this in conceptual modeling, and he and others highlighted the lack of consensus on what roles are, the lack of an accepted definition of roles, and the lack of guidance for modeling them [28, 32,33,34]. We address this problem by defining roles and providing and testing the first theory-driven method for representing them in conceptual models.
3 Defining roles
The aim of this section is to provide a definition of the role concept for conceptual modeling. We begin by referring to generally accepted characteristics of roles. We then apply principles from ontology and classification theory to define a role concept that possesses these characteristics.
3.1 Characteristics of roles
A major challenge when piecing together the literature on roles is that different authors emphasize different aspects of roles. Based on our review of the literature, Table 2 lists five characteristics of roles that are generally accepted in prior work, particularly in the IS/IT fields. Our aim in this section is to synthesize these aspects of roles into a working definition of the role concept. We then formalize it in the subsequent section.
In essence, roles tend to be viewed in the literature as abstractions that define common behavioral properties held by instances of classes. These behavioral properties are associated with relationships among instances in the domain, i.e., interactions of instances with instances of the same or other classes. Past literature stresses the need to understand these interactions—a point that we emphasize and formalize in this paper. For instance: (a) because interactions can start and cease to exist, roles can be acquired and lost (for example, the appearance and disappearance of attributes is mentioned in [14]); (b) because an instance can interact with several instances, in different ways, an instance might possess more than one role at a time, and a hierarchy of roles and sub-roles may exist; and (c) because instances of different classes can be engaged in the same type of interaction, a given role can be fulfilled by instances of different classes. These three implications suggest a strong conceptual distinction between roles and classes. While accepting this view, research has not yet reached a clear understanding of how best to represent this difference in conceptual models [28, 44, 45, p. 106]. For instance, the common method for showing roles in the ER grammar (as annotations on relationships) does not fulfill the requirements noted above because there is no way in such an approach to show that instances of different classes can participate in the same role, nor that a hierarchy of roles can exist.
To overcome the lack of a generally accepted definition of the role concept in the literature [34, 45], we now draw on these five characteristics of roles to suggest a working definition of the role concept:
Working definition For modeling purposes, the concept of a role can be viewed as a set of relational properties that reflect interactions among instances of one or more classes.
3.2 Formalizing the definition of role using ontology and classification theory
We use ontology and classification theory to formalize roles. We use ontology because it deals with the structure of reality and the meaning of real-world concepts [53, 54]. We draw on classification theory because it explains how people conceive of classes [20, 55].
We use a set of concepts adapted from Bunge [56], a widely used ontology in IS research [17, 57,58,59]. Bunge’s ontology is useful because it offers detailed treatments of two concepts that are helpful for defining roles: functional schema and interaction.
According to Bunge’s ontology [56], the world is made of things that possess both intrinsic properties (such as a Person’s age) and mutual properties (that exist between two or more things, such as a Person’s salary, mutual to the Person and an Organization). The values of properties obtained reflect human views of similar things. The relevant properties of a thing are modeled in terms of a set of attributes or state functions. The set of attribute functions chosen for a given purpose is termed a functional schema.
Definition
A functional schema of a thing x is a pair 〈M, F〉 such that M is a set and F is a set of functions: F = 〈F 1, …, F n 〉 → :M → V 1 ⊗ … ⊗ V n . A component in the functional schema is a view of a property.
M typically designates times where properties are observed.
A thing is said to act on another thing if the first affects the state of the other. Two things are said to interact if at least one acts on the other. The action of one thing on another is manifested via mutual properties which affect the functional schema—set of properties of interest. Hence, interaction would be manifested as changes of functional schemata where the changed attributes reflect the mutual changed properties.
The concept of interaction can be formally defined as:
Definition
Given things x and y, the set of states of y if x is available is different than the set when x is not available.
The changes can be modeled as changes in the functional schemata of the things involved in the interactions (x, y). Since the added state functions depend on both x and y, they reflect mutual properties.
We will use the concepts of interactions and functional schema to formalize how roles are defined. Prior work has proposed that the relationship concept in semantic data models (such as the ER model) and the association construct in UML could be used to reflect the ontological notion of an interaction and that modelers should attend to the properties that can be acquired (or lost) when interactions occur (or cease) [23, 60].
We add to our definition insights from classification theory. In classification, Individual things are conceived in conceptual models as instances of classes [20]. Hence, we define roles by considering instances of classes that might be interacting. Specifically, a role reflects interactions of an instance of a class with some other instances (which might belong to the same or other classes). Thus, an instance will acquire a role when it actually interacts with another instance (of the same or another class).
Drawing on these ideas from ontology and classification theory, we propose that a role can be defined in terms of mutual properties acquired by some instances of a class when they engage in interactions. When the interactions cease, the associated mutual properties will also cease, manifesting the loss of roles. Thus, we define: “for modeling purposes, a role can be viewed as a functional schema whose functions represent mutual properties arising out of an interaction among instances of one or more classes.”
The link between relationships, interactions, and roles helps define roles formally:
Definition
Two base classes exist (they can be the same) which has things x and y.
A possible interaction can exist between the base classes.
An interaction between at least one thing (y) and the affected thing (x) is manifested by:
-
(1)
A subclass of the things in x which have additional mutual attributes to their schema due to interaction with y.
-
(2)
A way to indicate the additional mutual properties that occur in the interaction.
We note that implied in the definition is that the instance (x) to which a role is assigned can come for one or more classes. For example, a customer can be an interaction with a Person or with an Organization. In both cases, the interaction will add the same mutual properties to the affected instance.
We link this definition to the five properties described in Table 2. First, roles are possible interactions. Thus, they are an abstraction of instances. Second, roles are assigned to instances (x). Third, roles can only exist if the affected instance (x) is involved in interaction with a thing from another base class. Finally, the same role can be applied to instances of different base classes.
Our definition affords a clear distinction between classes, base classes, roles, and role subclasses. A class reflects a set of instances with common properties. While in Bunge’s ontology it is called a kind (which generalizes a class to more than one property), we have used the notion of base class, to separate the idea from a role. However, roles are kinds which have properties of the base class, and additional mutual properties attached to them. Using a way to show the additional mutual properties is creating a sub-kind of the original base classes.
We use the term base class to refer to a class whose instances might engage in an interaction. A role cannot have instances fulfilling it unless instances exist that can engage in that interaction. Thus, the instances of a role are instances of one or more base classes that have additional mutual properties that reflect interactions. Because all these instances have the same properties, they are a subclass of the base class. We term this subclass the role subclass of the base class. That is, our definition implies that role subclasses are subclasses that inherit properties from both classes and roles. Our working definition and our formal definition also highlight the importance of understanding interactions if one is to understand roles. Accordingly, the method we propose in this paper and the empirical approach we adopt to test it (described later) focus especially on how interactions are modeled and understood.
To illustrate our definition, consider Fig. 1. It shows how each Person has the attributes Name and Address. A Person who assumes an Employee role will acquire the attributes Salary and Starting_Date—mutual properties with an Organization. A Person can also assume the role student and acquire the attributes Number_Of_Courses and Registration_Date—mutual properties with a university. Finally, he or she can become a customer and acquire the attributes Account_No. and Discount_Privilege—mutual properties with a vendor. An instance can even have two roles reflecting different interactions with the same instance, e.g., a Person can be an Employee and a student. In Fig. 1, the Person class is the large circle with its intrinsic attributes. The other three circles reflect the mutual properties arising from each type of interaction.

A Person possesses several roles
A functional schema to model the role in Fig. 1 must represent these acquired properties and associate them with the appropriate classes such as Person, Organization, and vendor. The purpose of our next section is to present a method that can help modelers to meet this requirement in extended ER models (EER).
Figure 1 is a general description of how to model roles. However, we need to define parts more specifically. In particular, we do not indicate in this figure where a role can be attached to a member of the base class more than once (e.g., several Organizations the Person works for). We will explain how this can be done together with how to represent roles using the extended entity relationship model.
4 A method for modeling roles in the EER grammar
Because there is no existing specific graphic notation to model roles, we examine the use of the EER grammar to do so. It is important to note that this is different to using the EER to model data for an operational database. Rather, we are studying its use as a graphic method for including roles in conceptual classification.Footnote 2
There are three reasons for using the EER. First, the original ER model is the most widely used conceptual modeling grammar [12, 61], but as we will show, existing approaches for modeling roles in ER scripts introduce construct overload, offering us an opportunity to improve a widely used grammar. Second, the extended ER model (EER) introduced more concepts to the original ER model, such as supertypes, subtypes, parts, and wholes [62], which improved its ability to “capture an accurate representation of reality” [63, p. 197]. Because of its emphasis on semantics, it is a very suitable grammar for our study. Third, other researchers have also examined an EER grammar [23, 64], thereby allowing us to contribute to its improvement through cumulative progress.
At present, there are two approaches for modeling roles in the EER grammar:
-
The explicit approach is to annotate a relationship to describe the role that an entity type plays, following Chen [14] (Fig. 2, left panel). It is explicit because the annotation is used solely for stating roles. Unfortunately, this explicit approach is an ineffective way to represent roles because it is far too general (as not all relationships reflect roles Footnote 3) and because it does not allow modelers to show key characteristics of roles noted earlier (e.g., role hierarchies and roles with multiple participating classes).
Fig. 2 
Modeling roles in EER [example adapted from 43, p. 84]
-
The implicit approach is to show roles via subclasses (Fig. 2, right panel). It is implicit because there is nothing in the grammar or script that states that the subclass represents a role. Rather, the reader must infer this from the script, based on his/her knowledge of the domain shown in the script. The implicit approach is a more reasonable basis for showing roles than the explicit approach because, at least a priori, it would seem able to show some of the characteristics of roles noted earlier. For instance, one could use a hierarchy of subclasses to show that multiple classes play the same role or that roles have different subtypes (e.g., one could extend the script in the right panel of Fig. 2 to show different subtypes of Employee). Nevertheless, we will show in our subsequent analysis that the implicit approach is deficient compared to the method that we will offer.

How can one design a method for modeling roles? Because the key components of a conceptual modeling grammar are constructs and syntactic rules for combining them [65], a conceptual modeling method must involve both aspects. Intuitively, therefore, three approaches could be taken to develop a method for modeling roles: (1) a new method could be created with new constructs and rules, (2) an existing method could be altered substantially by adding new constructs and rules, or (3) an existing method could be altered only moderately by adding new rules that allow modelers to use existing modeling constructs to model new concepts or situations in a domain. This third approach can be achieved by combining existing constructs in specific ways, thus defining “patterns” of the grammar constructs. Recent work on the development and refinement of modeling methods has used the third approach [19, 66]. We do likewise, to build upon that work. Rather than modifying the grammar’s constructs or its syntactic rules, this third approach involves adding semantic (mapping) rules for representing specific concepts or situations in a domain. In short, our method for modeling roles involves a new set of rules that can be applied to model roles using existing EER constructs and syntax. The advantage of this approach is that it does not require any change to existing modeling infrastructure (e.g., no changes to EER CASE tools). Thus, if it proves to be effective, it can be adopted in practice quite quickly; it simply involves training modelers in the new rules.
Using the concepts defined earlier to explain the use of roles (base class, role subclass, and interaction), we propose a set of rules for modeling roles in EER. These rules allow modelers to show roles in EER models using three constructs in the existing EER syntax [63, p. 197]: entity type (originally termed entity set), relationship, and subset hierarchy. In a subset hierarchy, instances of an entity type can be partitioned into overlapping sets, each considered a subset entity. It is again important to indicate that these are not modeling data for database design, but a conceptual model to include roles.
Table 3 presents the guidelines together with examples.
The rules imply that roles are not modeled separately, but rather as a role subclass of the base entity type(s). This reflects the observation that a role can only exist if there are base classes whose instances can assume the role, just as only classes with instances should be modeled [20]. The interaction is shown between the subclass that fulfills the role (Employee is a subclass of Individual) and the other (which could be the same) class. This is in line with earlier proposals to model only mandatory relationships [23]. Following Bera et al. [19], we refer to EER models that follow all the rules as guided scripts and those developed with violations as unguided scripts.
We note that EER could include mapping ratios between elements of the diagram. We make notes related to the use of these cardinalities to enhance the semantic meaning of a role diagram below.
Figure 3 shows a guided script of the employment scenario that follows the proposed rules. It shows that Employees are Individuals who have a specific interaction with an Organization—that of working with it. It also shows that several mutual properties, such as date of hire, emerge when an Individual becomes an Employee.

EER script showing Employee as a role of a Person
We note three aspects of Fig. 3 that show the effect of our proposed method. First, the relationship is not drawn between Individual and Organization. This is because the relationship reflects an interaction associated. The link between relationships, interactions, and roles, noted above, helps us to extend these ideas to model roles formally as indicated above (Sect. 3.2).
Only instances of the base class that are in the role will have the interaction (mutual properties). Moreover, if the relationship was linked to the Person class, a modeler would need to show that the relationship and mutual properties are optional, conflicting with proscriptions against them [22, 23, 55].
Second, note that we use the entity type (class) symbol to represent a role. This is because a role reflects a subset of entities that engage in interactions. One could argue that we have used the same symbol (a subset entity) to reflect two types of phenomena—base entity types (such as Individual, some members of which might engage in interactions) and roles (such as Employee), thereby creating construct overload [17]. However, the potential overload in Fig. 3 is alleviated by the subtype symbol. This might not be the case in larger scripts that include multiple subtypes, as an entity type can be a subtype without being a role (e.g., a cat is a subtype of mammal, but it is not a role). However, our rules alleviate construct overload by omitting attributes from the role subclass. That is, our rules imply the following modeling convention:
Entity symbols that represent base (“real”) entity types will have at least one attribute. Entity symbols which represent roles will have no attributes.
Because properties of a role are only mutual (relational) properties, we show those in the relationships that represent the interactions. Hence, there is no need to show the properties of roles separately. Thus, our modeling convention avoids the need to introduce a special new symbol (e.g., an octagon) to show roles, and enables practitioners to continue to use existing syntax.
Thus, in models that follow our guidelines, entity types that reflect roles will:
-
(1)
be shown as subset entities,
-
(2)
be related to other entity types, and
-
(3)
not have attributes.
All other subset entities must have at least one attribute.
Third, note that our rules could imply a potential increase in the number of classes (entity types) shown in a script. This is because our rules imply that a role subclass cannot be shown on its own. Rather, the rules force modelers to show a role subclass with its base classes, and to show the (potentially other) class that the role subclass interacts with by virtue of the role. Consider Fig. 4. The left column, adapted from Teorey et al. [63, p. 197], shows Faculty (with attribute Rank) as a subset of Person (with attributes Name and SSN). Our rules suggest that this model would be inadequate if it aimed to show that a Person can have the role of a faculty member. To show that a faculty member is a role, a modeler would have to include an interaction (shown as a relationship) with another entity type, such as an “appointment” with a university. The right side of Fig. 4 indicates how this would be modeled according to our rules, with the addition of two entity types (classes). Our argument is not that the script on the right of Fig. 4 is more appropriate for every task. Rather, we argue that the script on the right is preferable if the purpose is to show a role to support domain understanding. This follows Bera et al.’s [19] suggestion that visual models should reflect the salient aspects of a domain for the task being considered.

Modeling faculty as a subset entity (left) versus a role (right)
Overall, our rules imply that if domain understanding is the goal, a conceptual modeling script of a domain in which roles are salient should show all of the following four concepts: the base class(es) whose instances can engage in interactions, the roles, the interactions, and the mutual properties emerging out of the interaction related to each role. Unguided models often show only some but not all of these concepts. Of these four concepts, the interaction construct is particularly crucial because it serves as the bridge between the role and the base class.
As indicated above, we could use cardinalities to indicate more semantic information about roles. For instance, using the example of the right side of Fig. 4, assume:
-
University is linked to Appointment as: University <N:M> Appointment
-
Person is linked to the role class as: Person <P:Q> Faculty.
With this example, the meaning of M, N, P, and Q can be provided as per Table 4.
Overall, while the use of cardinalities can make roles more expressive, the use of cardinality is not necessary for modeling roles. Thus, they are not part of our role modeling guidelines, and they are not included in our experiment in the next section for this reason (for a similar approach, see [67]). Future research, however, could usefully examine how to apply the role modeling guidelines in different cardinality scenarios. In addition, while we did not include examples here, several base classes could be linked to one role, e.g., Individual and company are two types of customer. More detailed diagrams elaborating this example are provided in “Appendix 1”.
In summary, we have drawn on ontological theory and classification theory to offer a formal definition of roles that synthesizes together key aspects of roles in the literature and propose the first method for representing roles in conceptual models. According to Gemino and Wand [9], researchers can evaluate such a method in two general ways: (1) a “write” task that examines modelers’ ability to use the method to represent role situations, or (2) a “read” task in which we examine whether scripts that comply with the method improve users’ understanding of a domain. For reasons of scope, we focus on the second approach alone in the next sections. However, to provide some comfort regarding the first type of evaluation, we show in “Appendix 1” that the method is capable of representing a wide range of ways in which roles can be salient in a domain.
5 Testing the effectiveness of the method: a two-part experiment
The modeling rules we proposed above are intended to guide modelers in representing situations where roles are salient. We evaluated the method experimentally by comparing the domain understanding obtained by readers using a guided conceptual modeling script to that of readers using an unguided script. We used a between-groups design such that each subject received either a guided or unguided script, based on random assignment. We obtained two types of data: One focused on the product of understanding, and one focused on the process. Because the purpose of a conceptual model is to help stakeholders to understand a domain [4], the relevant product is the understanding of a domain that readers gain from a script. To test domain understanding, we use inferential problem-solving questions, following Mayer [68] and prior IS studies [19, 69, 70]. To test the process of understanding a domain from a script, we use eye tracking. Several studies have used verbal protocol analysis to study this process [19, 71,72,73], but this has several limitations, discussed later. Eye tracking allows us to overcome some of these limitations but has very rarely been used in IS research. The data for both sets of comparisons (both product and process) were obtained from the same experiment. Thus, we describe the experiment in generic terms first and then include specific sections to describe each one.Footnote 4
5.1 Sample
The experiment was conducted with students in graduate classes in Systems Analysis and Design in a Southern US University. This sample was chosen partly for convenience (accessibility to the University’s eye tracking laboratory) but also because the courses covered approximately 12 h of database concepts, such as EER models. Thus, we had confidence that the subjects could perform the tasks in our experiment (reading EER models) using the syntax covered in the course. As experienced graduate students, they are also reasonable proxies for junior professionals, allowing us to generalize to our population of interest [74]. Thirty-six participated in the main study out of which 18 received the guided scripts and 18 the unguided scripts. Subjects received a 1.5% course credit for participation. While a sample size of n = 18 per group might appear small, it is consistent with several eye tracking studies in psychology [75]. Moreover, as we show later, it did not prevent us from obtaining statistically significant results in our tests. The main reason for a small sample size is that each subject’s eyes need to be calibrated Individually, which takes considerable time.
5.2 Treatment materials
To compare readers’ abilities to interpret guided versus unguided scripts, some criteria have to be chosen to create the unguided scripts. Because our method involves five rules, violations could occur in 25–1, or 31, ways, e.g., violations of rule 1 or rules 1 and 2, or rules 1, 2, and 3, and so on. For feasibility, we focused on just one comparison. Specifically, we tested the impact of violating rule 3 (model role as a subset entity of an interacting entity) and rule 5 (model the mutual properties that reflect the interaction as attributes of the relationship). We chose these rules because they are particularly important for creating the construct patterns that enable distinguishing roles from other kinds of entity types. Our interest is not in the specific difference in understanding caused by any specific violation, but rather in the overall effect of violating the rules (violating rules 3, 5, or both) on domain understanding. Thus, we compare our treatment (compliance with all five rules) with a control group (violating rules 3 and 5). This design ensures internal validity because the only difference between the diagrams is due to the violations of the rules. Note, however, that this design also maintains ecological validity because the practices used in the control group are not unrealistic with respect to practices in industry. For instance, violations of rule 5 are similar to the “implicit” approach shown earlier in Fig. 2 (as they show mutual properties not on the relationship). Meanwhile, violations of rule 3 are similar to the “explicit” approach shown earlier in Fig. 2, in which the role information is limited to the relationship alone rather than the subclass (as they do not show a role as a sub-entity). It differs from the explicit approach in that we do not show the explicit annotation, but this is realistic because such annotations are often omitted in practice too (see, for example, Chen [14], p. 19). For this reason, we do not include role annotations in our guided scripts either.Footnote 5
To illustrate the type of comparison we wish to make, consider Fig. 5, which shows scripts that comply with rules 3 and 5 and scripts that violate them. Figure 5a and d shows the guided version. In Fig. 5e, rule 3 (role class exists without any attributes) is violated as the role is indicated in the relationship (Employed_In) and not as a separate entity. Figure 5f violates both rule 3, as the role (Employee) has an attribute, and rule 5 (mutual properties should reflect the interaction) as relationship (Employed_In) does not contain the mutual property (Start_Date) of Organization and Employee.

Guided and unguided EER diagrams—“an Individual is an Employee”
Although the same domain concepts appear in the guided and unguided scripts, we claim that because the unguided scripts do not model roles explicitly, they do not provide a clear and accurate representation. The guided scripts show roles explicitly because a strict convention (subset entities that have no attributes) is used to show them.
We note here that when using the EER to provide understanding of roles, all rules should be followed. If they are not followed, some misunderstanding might appear. For example, the meaning of start date in Fig. 5b and e cannot be fully meaningful for database design, if cardinalities are not shown. However, when modeling roles using the rules, start dates are always located in the relationships between a role designator and the other base class.
We used the domain of aquarium management to develop the EER scripts, as we felt that it would be moderately familiar to subjects. Although subjects might have visited an aquarium, we expected that they would not have detailed knowledge of how an aquarium is managed. We wished to avoid a very familiar domain, or a very unfamiliar one, because we were concerned that subjects’ domain knowledge might override the effect of our treatment in such cases, biasing our conclusions (e.g., relying solely on domain knowledge in a very familiar case, or being unable to perform the task in a very unfamiliar case) [64, 76,77,78]. The scripts were created based on a narrative of the domain in Harrington [79]. “Appendix 2” shows the scripts used in the experiment.
As explained above, the guided script complied with all the proposed rules, while the unguided script violated rules 3 and 5. For example, in the unguided EER script (Fig. 14, “Appendix 2”), the entity denoting the role of Veterinarian includes the mutual property of Veterinarian and the Animals—Checkup Report. Rule 3 states that an entity that reflects a role should not contain attributes, and rule 5 states that the relationship reflecting the interaction should contain the mutual properties associated with that interaction. The main distinction between the guided and unguided EER scripts is that the former distinguishes between entity types that represent roles from those that represent base classes (e.g., Animal Handler is a role, but Exhibit Tank is not), whereas the latter does not make this distinction (e.g., Animal Handler and Exhibit Tank are both entities, and the script does not indicate that Animal Handler is a role).
Because the experiment investigates whether a difference in the semantics of two scripts affects readers’ understanding of a domain (in this case, semantics about roles), it was important to control for non-semantic differences between the diagrams that might confound the results. One potential confound is the layout of the diagram [72]. We therefore ensured that there was minimal difference in their layout. Essentially, the terms in both diagrams were the same. However, two differences in the use of the words were needed to accommodate the rules. First, the same terms appear in different locations in the two diagrams (e.g., the attribute “Suggested Diet” appears in the Conducts Checkup relation in the guided script, whereas this attribute appears in the Animals entity in the unguided script). Second, the guided script had two roles—Exhibited animal and Quarantined animal—that were explicitly modeled as entities without- attributes, whereas these two roles appear implicitly in the unguided script in the relations—Are Exhibited and Quarantined (see also Fig. 6 below). Also note that the size of each entity and relationship in the guided and unguided scripts was the same even if the information inside them was different. This ensured that eye movement metrics could be compared between the two groups.

Parts of guided (a) and unguided (b) EER scripts used in the study
5.3 Experimental task and predictions
The primary task in the experiment was to read the script of the aquarium domain (either the guided or unguided script, based on random assignment) and answer two inferential problem-solving questions. These questions (shown below) required subjects to develop creative solutions that go beyond the semantics of the diagram.
We expected that subjects receiving the guided scripts would perform more effectively in this task than subjects receiving the unguided scripts. We drew this expectation from cognitive fit (CF) theory [73] and multimedia learning (MML) theory [19, 80]. CF theory predicts better task performance when a representation emphasizes aspects of the domain relevant to the task (in our case, by showing them explicitly). MML argues that even small differences in the material can have a significant impact on understanding and hence performance. In our case, the general task is developing an understanding of a domain from a conceptual model. We operationalized this task via two questions about actions that need to be taken in the domain in certain circumstances. The questions were:
If a quarantine tank is broken, how can this situation be handled?
If veterinarians do not report to work, what problems can the aquarium face?
Because actions must inevitably be taken by actors acting in a specific role, making roles salient in a script (as per our modeling rules) should facilitate performance in such questions [19]. The unguided script obscures information about roles because it suffers from construct overload [17]—it fails to distinguish between roles (and the interactions that define them) and regular entity types. Thus, if users need to learn about a domain in which roles are salient (which is the case in most Organizational contexts, and in our task), users of guided scripts should be able to understand the domain better (and thus perform better in this task) than users of unguided scripts. Thus, we propose:
Proposition
Individuals reading EER scripts of a domain in which roles are salient will obtain a better understanding of the domain if their EER scripts are guided than if they are unguided.
To explain this effect in more detail, consider Fig. 6, which shows extracts from the scripts in our experiment, and Table 5, which examines one of the experimental tasks. Figure 6a shows two roles in the domain—Quarantined and exhibited Animals. These roles exist because of the interactions shown via the Quarantined and Are Exhibited relationships. Figure 6b shows the same domain in the unguided script. Note that in Fig. 6a, Animals is modeled as a role, and thus, its attributes are shown in the other parts of the guided script (see “Appendix 2”), whereas the unguided script shows Animal as a regular entity type. As Table 5 explains, the guided script is more suited to the task than the unguided script.
As noted earlier, we tested subjects’ domain understanding in terms of the product and the process of understanding. Of the two, testing the product of understanding is more straightforward because it is the traditional approach. Thus, as in prior studies using inferential problem-solving questions, we measure the product of understanding according to subjects’ total number of correct answers to the questions, as judged by independent coders [19, 70, 71].
Hypothesis 1
(Product of understanding) Subjects receiving guided scripts will achieve a higher total score in the problem-solving questions than subjects receiving the unguided scripts.
Examining the process of understanding is more complex. In the past, conceptual modeling researchers used verbal protocol analysis for this purpose [19, 71, 72, 81]. Verbal protocol analysis is limited in that it requires subjects to express their thoughts, which they may be unable or unwilling to do [82], it is ill-suited to studying how people navigate pictorial representations (such as conceptual models) [83], and the effort required to verbalize thoughts can alter subjects’ mental processes [84]. Eye tracking overcomes these limitations as it is non-invasive and does not burden users with extra effort. Eye tracking offers a window into how Individuals read and scan information, especially pictorial representations [85], and the way in which they focus their attention, whether voluntarily or not [75, 84, 86].
Eye tracking software can track the specific elements of a script that a user is viewing and reveal how subjects are engaging with those elements. In this study, we are particularly interested in whether or not our method improves the efficiency of understanding EER scripts. Past research suggests that more efficient searching would be indicated by subjects searching the script in a focused manner, quickly honing in on a small, relevant area of the script [75, 87]. In contrast, less efficient searching would be indicated when subjects attend to a large (rather than a focused) visual area, move their gaze around the script (switching foci of attention rather than focusing on any one element), and spend a long (rather than a short) time searching the script for an answer [88]. We capture these ideas in specific metrics that we explain later. We use such metrics to test the following hypothesis.
Hypothesis 2
(Process of understanding) Subjects receiving guided scripts will engage in more efficient searching of the script when answering the problem-solving questions than subjects receiving the unguided scripts.
5.4 Experimental procedures
The experiment had two parts: training and main study. In the training stage, subjects were given a pretest questionnaire to identify their prior modeling knowledge and prior domain familiarity (in aquarium management). Next, subjects spent 15 min reviewing basic EER concepts. For subjects assigned to the group receiving the guided script, the document describing basic EER concepts also described the notation for representing roles. Subjects next practiced answering problem-solving questions using a simple case. Finally, they received feedback on their performance in the practice task.
After completing the training, subjects commenced the main study at a computer terminal with eye tracking infrastructure. The study began with each subject being shown either the guided or unguided script. They were then asked to verbally describe its contents. This was not used to obtain a dependent measure or a control measure; it was just to engage subjects with the script, which is necessary for them to develop a deeper understanding of it and engage in problem-solving [89]. Next, they were shown the problem-solving questions. The same problem-solving questions were given to both groups (guided and unguided). For each question, subjects were first shown a computer screen with the question. When they felt that they understood it, they proceeded to a screen that showed the script. Subjects’ eye movements were recorded only when this screen was displayed. Subjects were asked to verbally state their answers while viewing the script (rather than, for example, writing them in a separate textbox). This procedure ensured that the script occupied the entire screen area during the problem-solving questions. If we had instead allowed participants to move their gaze between the question, the script, and their answers, during the task, this would have made it more difficult to test H2 because H2 only makes predictions regarding their searching of the script. For the same reason, subjects were required to stay on the screen that showed the script while answering each question, i.e., they could not go back to see the question. However, subjects could ask the research assistant to repeat the question if required. Once subjects completed the first question, the sequence was repeated (with the same script) for the second question. When subjects completed the main study, they were thanked and dismissed.
In addition to the two control variables collected during the training stage (prior modeling knowledge and domain knowledge), we also recorded the time that participants took to complete the questions in the main study. In addition, both eye movement and verbal data were recorded while they performed the tasks. We used EyeLink 1000 to record subjects’ eye movements (http://www.sr-research.com/EL_1000.html). This software uses infrared video-based tracking technology to measure the pupil center and the size of the pupil of each subject’s right eye. Subjects were seated in front of a computer, and the head mount was adjusted to their height so that they could keep their head fixed in one position during the task. The eye tracker was then calibrated to the subject’s pupils, and a sequence of validation tests were conducted to make sure the eye tracker was correctly synchronized with their pupils. Once the validation results were sound, subjects were allowed to proceed to the main study.
We conducted two pilot studies to ensure the experiment would proceed smoothly. The aim of the first pilot study was to check our procedures and materials and to get a sense for our likely results. Because we did not include eye tracking in this pilot, we could use a larger sample size. We recruited 73 subjects at a Canadian University enrolled in an Accounting Information Systems course. The results of this pilot showed that the treatment was significant. Subjects had no major problems with the procedures, but their responses indicated that one of three problem-solving tasks was unclear, so we dropped this question for the main study. The purpose of the second pilot was to test the feasibility of collecting eye movement data during the task. This study involved five subjects who had the same profile as those in the main study. No issues were identified in this pilot, and so no changes were made prior to the main experiment.
6 Results
We present the results for H1 and H2 in turn. We provide a more detailed examination for H2 because eye tracking results are less familiar to conceptual modeling and requirements engineering researchers.
6.1 Results for H1: problem-solving results
The first step in examining the results involved coding the problem-solving questions. We recruited two MIS graduate students to serve as independent coders and grade subjects’ responses, and we provided them with a detailed coding document containing possible answers to the questions. The first coder coded all the responses, and the second coder coded a randomly selected subset of 30% of the subjects’ responses. We checked the inter-rater reliability of the two coders’ scores for all the Individual responses they coded in common, and it was high (Cohen’s κ = 0.73).
After coding the problem-solving answers, we checked the descriptive statistics. As Table 6 shows, there was very little difference in EER modeling familiarity and domain familiarity between the groups, as would be expected because subjects were randomly assigned. The time taken during the tasks was measured by the eye tracking software. Across the two groups, subjects spent on average 114 s to perform the two tasks. On average, subjects in the unguided group took longer than subjects in the guided group (126 > 102 s). Although we had not hypothesized any effect in terms of time, this is in line with our expectation of greater difficulty in the unguided group.
Next we checked the reliability and validity of the instruments used for the problem-solving questions. Reliability was evaluated by calculating the Cronbach’s alpha for the scores of the two problem-solving questions. The value obtained was 0.74 which exceeds the generally accepted value of 0.7 [90]. To test construct validity, we conducted a multivariate analysis of variance (MANOVA) to see whether the results for the two problem-solving questions converged. MANOVA is performed to see the effects of independent variables on multiple dependent variables. In our case, two problem-solving questions are treated as two dependent variables. The results for both questions were significant (p = .005 and p = .04) and in the same direction, providing support for convergent validity.
On the basis of these tests, the reliability and validity of the problem-solving items were deemed satisfactory and we proceeded to test H1. We tested H1 using analysis of covariance (ANCOVA) to identify the effect of covariates (e.g., domain knowledge) on the treatment. As Table 6 shows, the treatment was significant (F = 7.94, p < 0.05), supporting H1. The control variables were not significant, most likely because there was no systematic difference among groups in these variables, as noted above. We note that the effect size in Table 7 is not large (2.69 > 2.22). This was expected due to the design of our experiment. That is, we designed the experiment to test the significance of the effect (reflected in our test of H1), not the effect size. The effect size is likely a function of the number of rules violated in a script, relative to its size, as well as the specific questions asked. We return to this issue in Discussion.
6.2 Results for H2: eye tracking results
To our knowledge, only three studies (all quite formative in nature) have used eye tracking to study how Individuals interpret conceptual models [91,92,93]. Thus, in addition to reviewing the methods in these studies, and in the few IS studies that have used eye tracking [e.g., 94], we drew upon the broader eye tracking literature. We describe these methods first, to provide the necessary context, prior to reporting our results.
6.2.1 Relevant eye tracking metrics
Researchers can obtain eye tracking metrics for an entire visual area (e.g., an entire script) or for specific locations in an area, known as “Areas of Interest” (AOIs) (e.g., elements in a script). In each case, they have access to a range of metrics. We focus on three popular metrics: fixations, saccades, and pupil dilation. Fixations refer to a stabilization of a subject’s eyes on an object, while saccades refer to movements between fixations [75]. In fixations, eyes remain relatively still while visual information is extracted [84]. The number of fixations on an area is termed fixation count, and the total fixation time in an area is termed fixation duration [95]. When eyes fixate on an area, the brain starts to process the visual information received from the eyes [86]. While fixation duration indicates the engagement of attention (how long one looks) [96], fixation count reveals the amount of cognitive processing [95]. Pupil dilation is a related metric that indicates attention and cognitive workload, i.e., more dilation reflects more effort and attention [97, 98].
Figure 7 illustrates these ideas. Assume that we set each entity type (rectangle) and each relationship (diamond) to be an AOI. This would provide us with eye movement metrics for each element in the script (each AOI), in addition to metrics for the entire area. Now, assume that a subject first gazed at a point in the box for Animals (position 1) and then looked to Conducts Checkup (positions 2–3), back to Animals (position 4), and then to Veterinarian (positions 5–6). Figure 7 shows the movement of the subjects’ eyes via the numbers 1–7. It also shows that each AOI has two fixations (a total of 6 fixations) and that there were five saccades (the arrows between fixations). Finally, each time the eye is stationary, a fixation is created which is indicated by a circle where the size of the circle indicates the duration.

Understanding eye metrics for part of a role model
In general, higher fixations on smaller, more focused, areas suggest more focused and efficient searching [87]. It also indicates the importance of that element to the viewer [75]. In contrast, high overall fixations on a large visual area (such as an entire script) indicate less efficient search process [88]. Fixation number and duration are related because duration is linked to the processing applied to the object being fixated [99]. In general, very long fixation durations (especially over a large area, such as an entire script) indicate difficulty in extracting information from a display and likewise a large number of saccades indicates inefficient information search [88].
6.2.2 Applying eye tracking measures in our experiment
Theories of problem-solving suggest that if subjects have to refer to visual representations to solve a problem, they will incur less cognitive load [100, 101] and engage in more directed search [102] if the representation provides cues that highlight key material for solving the problem. As we noted earlier, the guided script in our study should provide more effective cues than the unguided scripts. In this light, consider Fig. 8, which shows two guided scripts (an abstract script and its instantiation in the aquarium domain). Because roles are defined by interactions that are, in turn, shown by relationships, the links between the role and the interaction (Exhibited Animal and Are Exhibited), and between the interaction and the class (Are Exhibited and Exhibited Tank), are crucial for understanding the role. Thus, as noted earlier, the interaction construct serves as the bridge between all the concepts needed to understand the role. Together, these links and the interaction construct provide visual cues for understanding the role, which should assist users of the guided script in our experiment.

Example script for showing the bridging role of the interaction construct
Because the interaction construct provides such a key bridging function for understanding roles, we posit that in a task that requires understanding roles, the interaction construct should be a particularly instructive AOI. Specifically, we predict that users of guided scripts will focus on the interaction construct because it is so fundamental for understanding the role, whereas we predict that users of unguided scripts would find it more difficult to decide where to focus among the concepts in the script.
To make these predictions more specific, we expect that, for viewers of unguided scripts, we will see larger metrics (fixations and saccades) for the script as a whole, indicating more dispersed, less focused attention, and more movement around the script, compared to the same metrics for users of guided scripts. On the other hand, for viewers of guided scripts, we expect that the corresponding metrics will be greater for the specific AOI associated with interactions. Such results would indicate that the guided scripts afford more direct and efficient searching. We summarize these predictions in Table 8 where H refers to high numbers and L refers to low numbers.
Some of the cells in Table 8 have no values. This is because saccade counts are generally taken for an overall visual display [75], and so we do not predict this value for Individual AOI’s. Likewise, pupil dilations are generally measured for specific AOIs [97] and not for an overall visual area. Based on these predictions, we can now operationalize H2 in more detail:
H2A
The total fixation time, count, and saccade count for the overall model will be higher for Individuals reading unguided scripts compared to those reading guided scripts.
H2B
The fixation time, fixation count, and pupil dilations on relations indicating interactions will be higher for Individuals reading guided scripts compared to those reading unguided scripts.
We can also add one final hypothesis that links H2 with H1. Specifically, if we are correct that the interaction construct is a particularly crucial construct to examine when answering questions about roles, then viewers of guided scripts who pay more attention to the interaction construct should perform more effectively on the problem-solving questions. Accordingly, we predictFootnote 6:
H2C
For Individuals viewing the guided scripts, there will be a positive relationship between the fixation count in areas indicating interactions and problem-solving scores on the task.
6.2.3 Eye tracking results
We use independent sample t tests to test H2A and H2B and regression to test H2C. First, we report the results for the overall script, for H2A. These results are shown in Table 9, which reports the average values for each metric across all subjects. As the table shows, the average fixation duration, fixation count, and saccade count are significantly higher in the unguided group, supporting H2A.
To test H2B, we first examined the list of possible answers to the problem-solving questions and identified the interactions that were relevant for answering them. We show these interactions in Table 10.
To test H2B, we again conducted independent t tests. However, instead of using total fixation duration and count (as in Table 8), we use percentage of fixation duration and percentage of fixation count for the specific AOIs. This percentage is calculated by identifying the total duration or count for a specific AOI and dividing it by the total duration or count for the entire model. A high percentage reflects the importance of that AOI to the viewer [75]. This metric is suitable for comparison between two groups because Individual values for specific AOIs are standardized. To calculate the relative change in pupil dilation, the difference in maximum and minimum pupil size for all fixations on an AOI was identified and this value was divided by the minimum pupil size for all fixations on the same AOI. This process ensures standardization of the eye pupil dilations for all subjects [103].
Because the AOIs differ between the two problem-solving tasks, we report the results for each problem-solving task. The results are calculated based on the sum of the metrics for the AOI’s representing the interactions in Table 10. Thus, for task 1, the results are based on the sum of the metrics for the AOIs representing the four interactions in Table 10, and for task 2, the results are based on the sum of the metrics for the AOIs representing the two interactions in Table 10. This is the source of the values for %FixationTime and %FixationCount. For example, in Table 11, the guided group spent 26% of the time on understanding the four interactions for task 1, compared to 14% in the unguided group. To obtain %IncreasePupil, we calculated the average percentage increase in pupil size for all relevant interactions. Overall, the results show that for both tasks, the metrics are significantly higher in guided group than in the unguided group, supporting H2B. “Appendix 3” provides a detailed analysis for each AOI, which supports this overall analysis.
Finally, to test H2C, we conducted regression analysis. The results are shown in Table 12. To run the model, we first added all the percentage fixations on the AOIs for each task (i.e., the four interactions in Table 10 for task 1 and the two interactions in Table 8 for task 2) and then used this total as an independent variable, the dependent variable being each subject’s total problem-solving score. As Table 12 shows, the extent to which subjects who received the guided scripts focused on the interaction constructs was a significant predictor of their performance in the task, supporting H2C. In addition to using percentage count, we also used percentage time as the independent variable and obtained the same result as in Table 12 (not reported for brevity).
Overall, our results support all our hypotheses. It is worth noting, also, that following the role modeling guidelines did not significantly change the size of the scripts in our study (there were 22 entities and 24 relationships in the guided script and 21 entities and 22 relationships in the unguided script). Thus, our results show that it is possible to improve understanding with very little cost in terms of added complexity.
In addition to providing metrics useful for hypothesis testing, eye tracking software provides visualizations that can help in communicating results. Accordingly, we conclude by showing two sample heat maps that represent the visual processes followed by two representative subjects in problem-solving task 2 (Fig. 9). A heat map is superimposed on top of a model and highlights where subjects have been looking while performing a task [75]. These maps depict a contour analysis of the intensity of eye gaze, with higher peaks indicating regions of greater fixation [104].

Parts of heat maps of two subjects using the guided (left) and unguided (right) scripts in task 2
Our theory suggests that users of guided scripts should show more focused attention overall and should focus particularly on the interaction construct, because this is the bridge for them to understand how the role operates in response to circumstances in the domain. In contrast, users of the unguided scripts should exhibit both more distributed attention (less focus) and more attention overall (more resources expended). These patterns are borne out in Fig. 9. The left side shows that the user of the guided script focused on the two interactions—“conducts checkup” and “inspects”—whereas the user of the unguided script had more areas of focus (more red patches) and a wider area of attention (a broader green area).
7 Conclusion
The role concept is of particular importance in IS analysis and design because it is linked to the actions and changes that the system is expected to support. However, while being recognized as important, no generally accepted formal definition of role or rules for using it in conceptual (domain) models is available. We addressed this problem by formalizing the notion of a role as a conceptual modeling construct and providing a method for mapping domain information into conceptual models that include roles. It is important to note that the purpose of such models is not to guide database design (which is the purpose of, for example, Teorey et al. [63, p. 197] and Elmasri [43]), but rather to support application domain analysis. By corollary, existing practices for showing roles in semantic data models may not suffice if the purpose is to convey domain understanding—as shown by our study’s results.
Because modeling grammars and methods are artifacts, we took a design science approach in our work. The proposed method was developed as a set of semantic modeling rules (namely rules for how to represent certain phenomena meaningfully) and then instantiated in the specific case of the EER grammar, the most widely used conceptual data modeling technique in practice [11, 12]. Although researchers have extended the range of semantics that can be modeled with ER diagrams over the years, such as incorporating aggregation, refinement, specialization, inheritance [43], and uncertainty [105], to our knowledge, no extensions have focused particularly on modeling the Organizational semantics associated with roles. This is an important extension offered by our work. Based on our results, we believe that the extension could be very helpful to stakeholders charged with interpreting conceptual modeling scripts.
The results of the eye tracking data complement the problem-solving data. The empirical work, in particular the eye tracking experiment, indicated that the role-based rules are not only useful for understanding the models but also provided direct clues as to why this is so. The eye movement data clearly show the importance of interactions in modeling roles. The fact that our eye movement data confirmed our hypotheses is particularly instructive because eye tracking is one of the few ways to illuminate Individuals’ mental processes without intruding on those same processes.
The contributions of this work are in three areas—theory, methodology, and practice. The theoretical contribution includes a formal definition of the role concept and guidelines for mapping domains where roles are important. From a methodological perspective, our work contributes by testing both the product and process of understanding and introducing eye tracking technique in conceptual modeling studies. Finally, the work shows how the guidelines can be used in practice by demonstrating their implementation in a commonly used modeling grammar without changing it. Future work should extend our empirical studies by examining the application of the rules with different grammars (e.g., UML class diagrams), different cases (e.g., those more or less familiar, or more or less complex, than the domain we used), and a different number of violations of our rules (e.g., to examine the sensitivity of the effect size to the number of violations). Future research could also further refine our method to model additional situations where objects attain roles (e.g., sub-roles) and to model time-varying relationships [106], e.g., to model transient roles [45]. Case studies and action research studies could also be conducted to see the value of the proposed method in practice. Overall, the work presented here reflects the start of a program of research that we believe offers great benefit to those charged with understanding roles in Organizations and ensuring that Organizational information systems reflect and support roles appropriately.
Notes
Note that this is not a criticism of ORM. ORM provides a comprehensive data modeling approach. The approach offered in this paper, in contrast, is focused specifically on modeling roles. Moreover, it is important to note that even if these role annotations in ER diagrams and ORM diagrams did reflect the true nature of a real-world role (which they do not), they are frequently omitted in practice (e.g., [8, 25]).
Although we focus on EER, our proposed method could also be adapted quite easily to other approaches such as UML class diagrams when used for conceptual modeling.
For example, one could add a label such as “is a part of” between two entity types (e.g., wood and building), but this would not reflect a role in our definition. Only some relationships, not all, reflect roles.
While it might add credibility to our results to add additional cases, the results of a single case do show the differences we were examining. We return to this issue when discussing future research opportunities.
As one of our reviewers noted, annotations could still be useful. For instance, annotations could be used to make guided scripts even clearer. Alternatively, annotations could be used to overcome the limitations of unguided scripts. The experiment reported here is just a first step. Future studies would be needed to test these different scenarios.
We only make this prediction for users of the guided scripts. We cannot make a prediction for users of the unguided scripts because there is no clear connection between any specific area of the script and performance in the task.
References
Kent W (1978) Data and reality. 2000: 1st books library (originally published by North Holland)
Denning P (2003) Great principles of computing. Commun ACM 46(11):15–20
Yourdon E (1989) Modern structured analysis. Prentice Hall, Englewood Cliffs
Mylopoulos J (1992) Conceptual modeling and telos. In: Loucopoulos P, Zicari R (eds) Conceptual modeling, databases and CASE: an integrated view of information systems development. John Wiley, New York, pp 49–68
Pohl K (1993) The three dimensions of requirements engineering. In: 5th international conference on advanced information systems engineering (CAiSE). Springer, Berlin
Siddiqi J, Shekaran MC (1996) Requirements engineering: the emerging wisdom. IEEE Softw 13(2):15–19
March ST, Allen GN (2009) Challenges in requirements engineering: a research agenda for conceptual modeling. In: Lyytinen K et al (eds) Design requirements engineering: a 10-year perspective. Springer, Berlin, pp 157–165
Bera P, Evermann J (2014) Guidelines for using UML association classes and their effect on domain understanding in requirements engineering. Requir Eng 19:63–80
Gemino A, Wand Y (2004) A framework for empirical evaluation of conceptual modeling techniques. Requir Eng 9(4):248–260
Siau K, Lee L (2004) Are use case and class diagrams complementary in requirements analysis? an experimental study on use case and class diagrams in UML. Requir Eng 9:229–237
Siau K, Rossi M (2011) Evaluation techniques for systems analysis and design modelling methods: a review and comparative analysis. Inf Syst J 21:249–268
Fettke P (2009) How conceptual modeling is used. Commun AIS 25(1):571–592
Peckham J, Maryanski F (1988) Semantic data models. ACM Comput Surv 20(3):153–189
Chen PPS (1976) The entity-relationship model: toward a unified view of data. ACM Trans Database Syst 1(1):9–36
Hull R, King R (1987) Semantic database modeling: survey, applications, and research issues. ACM Comput Surv 19(3):201–260
Yu ESK (1993) Modeling organizations for information systems requirements engineering. In: Proceedings of the IEEE international symposium on requirements engineering. San Diego, CA, Jan 4–6. pp 34–41
Wand Y, Weber R (1993) On the Ontological Expressiveness of Information Systems Analysis and Design Grammars. J Inf Syst 3:217–237
Burton-Jones A, Weber R (2014) Building conceptual modeling on the foundation of ontology. In: Topi H, Tucker A (eds) Information systems and information technology, volume 2, computing handbook set, 3rd edn. Taylor and Francis, Boca Raton, pp 151–1524
Bera P, Burton-Jones A, Wand Y (2011) Guidelines for designing visual ontologies to support knowledge identification. MIS Q 35(4):883–908
Parsons J, Wand Y (1997) Choosing classes in conceptual modeling. Commun ACM 40(6):63–69
Weber R (1996) Are attributes entities? a study of database designer’s memory structures. Inf Syst Res 7(2):137–162
Bodart F et al (2001) Should optional properties be used in conceptual modelling? a theory and three empirical tests. Inf Syst Res 12(4):385–405
Wand Y, Storey VC, Weber R (1999) An ontological analysis of the relationship construct in conceptual modeling. ACM Trans Database Syst 24(4):494–528
Biddle BJ (1986) Recent developments in role theory. Ann Rev Sociol 12:67–92
Walsh JP, Ungson GR (1991) Organizational memory. Acad Manag Rev 16(1):57–91
Steimann F (2007) The role data model revisited. Appl Ontol 2:89–103
BPMN Business Process Modeling Notation (2004) BPMI.org
Steimann F (2007) A radical revision of UML’s role concept. In: Evans E, Kent S, Selic B (eds) UML 2000: proceedings of the 3rd international conference. Springer, pp 194–209
Verheijen G, Van Bekkum J (1982) NIAM: an information analysis method. In: Olle TW, Sol HG, Verrijn-Stuart AA (eds) Information systems design methodologies. Amsterdam, North-Holland, pp 537–590
Halpin TA (2008) Information modeling and relational databases, 2nd edn. Morgan Kaufman, San Francisco
Steimann F (2000) On the representation of roles in object-oriented and conceptual modeling. Data Knowl Eng 35:83–106
Zhu H, Zhou M, Seguin P (2006) Supporting software development with roles. IEEE Trans Syst Man Cybern A Syst Hum 36(6):1108–1122
Cabot J, Raventos R (2004) Roles as entity-types: a conceptual modeling pattern. In: Proceedings of the 23rd international conference on conceptual modeling (ER ‘04). LNCS, p 328
Almeida A, Guizzardi G (2008) A semantic foundation for role-related concepts in enterprise modelling. In: International IEEE enterprise distributed object computing conference. Munich
Hoffer JA, Prescott MB, McFadden FR (2008) Modern database management. Pearson Prentice Hall, Upper Saddle River
Pratt PJ, Adamski JJ (2002) Concepts of database management. Course Technology, Boston
Kendall KE, Kendall JE (2014) Systems analysis and design, 9th edn. Prentice Hall, Upper Saddle River
Ponniah P (2007) Data modeling fundamentals: a practical guide for IT professionals, 1st edn. Wiley, Hoboken
Coronel C, Morris S, Rob P (2010) Database systems: design, implementation, and management, 9th edn. Cengage Learning, Boston
Connolly T, Begg C (2003) Database systems: a practical approach to design, implementation, and management, 6th edn. Pearson, Upper Saddle River
Dietrich SW, Urban SD (2005) An advanced course in database systems: beyond relational databases. Prentice Hall, Upper Saddle River
Umanath NS, Scamell RW (2007) Data modeling and database design. Thomson Course Technology, Boston
Elmasri R, Navathe S (2014) Fundamentals of database systems, 7th edn. Pearson Education, Upper Saddle River
Loebe F (2007) Abstract vs. social roles: towards a general theoretical account of roles. Appl Ontol 2:127–158
Colman A, Han J (2007) Roles, players, and adaptable organizations. Appl Ontol 2:105–126
Genilloud G, Wegmann A (2000) A foundation for the concept of role in object modelling. In: Proceedings of the fourth international enterprise distributed object computing conference (EDOC 2000). IEEE, Makuhari, pp 76–85
Sowa JF (2000) Knowledge representation: logical, philosophical, and computational foundations. Course Technology, Boston
Pernici B (1990) Objects with roles. ACM SIGOIS Bull 11(2–3):205–215
Masolo C et al (2004) Social roles and their descriptions. In: Dubois D, Welty CA (eds) Ninth international conference on the principles of knowledge representation and reasoning. Whistler, pp 267–277
Zhang H, Kishore R, Ramesh R (2007) Semantics of the MibML conceptual modeling grammar: an ontological analysis using the Bunge–Wand–Weber framework. J Database Manag 18(1):1–19
Boella G, Torre L, Verhagen H (2007) Roles: an interdisciplinary perspective. Appl Ontol 2:81–88
Guarino N (1992) Concepts, attributes and arbitrary relations: some linguistic and ontological criteria for structuring knowledge bases. Data Knowl Eng 8(2):249–261
Angeles P (1981) Dictionary of philosophy. Harper Perennial, New York
Wand Y et al (1995) Theoretical foundations for conceptual modelling in information systems development. Decis Support Syst 15:285–304
Parsons J, Wand Y (2008) Using cognitive principles to guide classification in information systems modeling. MIS Q 32(4):839–868
Bunge M (1977) Treatise on basic philosophy: volume 3: ontology I: the furniture of the world. Reidel, Boston
Fonseca F (2007) The double role of ontologies in information science research. J Am Soc Inf Sci Technol 58(6):786–793
Wand Y, Weber R (1990) An ontological model of an information system. IEEE Trans Softw Eng 16:1282–1292
Green P, Rosemann M (2000) Integrated process modeling: an ontological evaluation. Inf Syst 25(2):73–87
Evermann J, Wand Y (2005) Ontology based object-oriented domain modelling: fundamental constructs. Requir Eng 10:146–160
Davies I et al (2006) How do practitioners use conceptual modeling in practice? Data Knowl Eng 58(3):358–380
Saiedian H (1997) An evaluation of extended entity-relationship model. Inf Softw Technol 39(7):449–462
Teorey TL, Yang D, Fry JP (1986) A logical design methodology for relational databases using the extended entity-relationship approach. ACM Comput Surv 18(2):197–222
Khatri V et al (2006) Understanding conceptual schemas: exploring the role of application and IS domain knowledge. Inf Syst Res 17(1):81–99
Wand Y, Weber R (2002) Information systems and conceptual modelling: a research agenda. Inf Syst Res 13(4):363–376
Evermann J, Wand Y (2006) Ontological modeling rules for UML: an empirical assessment. J Comput Inf Syst 46(5):14–29
Bera P, Evermann J (2014) Guidelines for using UML association classes and their effect on domain understanding in requirements engineering. Requir Eng J 19(1):63–80
Mayer R (1989) Models for understanding. Rev Educ Res 59:43–64
Gemino A, Wand Y (2003) Evaluating modeling techniques based on models of learning. Commun ACM 46(10):79–84
Gemino A (1998) To be or may to be: an empirical comparison of mandatory and optional properties in conceptual modeling. In: Annual conference of the administrative sciences association of Canada. College of Commerce, University of Saskatchewan, Saskatoon, Saskatchewan
Burton-Jones A, Meso P (2008) The effects of decomposition quality and multiple forms of information on novices’ understanding of a domain from a conceptual model. J Assoc Inf Syst 9(12):748–802
Shanks G et al (2008) Representing part-whole relations in conceptual modeling: an empirical evaluation. MIS Q 32(3):553–573
Vessey I (1991) Cognitive fit: a theory-based analysis of the graphs versus tables literature. Decis Sci 22(2):219–240
Compeau DR et al (2012) Generalizability of information systems research using student subjects: a reflection on our practices and recommendations for future research. Inf Syst Res 23(4):1093–1109
Jacob RJK, Karn KS (2003) Eye tracking in human-computer interaction and usability research: ready to deliver the promises. In: Radach R, Hyona J, Deubel H (eds) The mind’s eye: cognitive and applied aspects of eye movement. Elsevier Sciences BV, Oxford, pp 573–605
Burton-Jones A, Weber R (1999) Understanding relationships with attributes in entity-relationship diagrams. In: 20th international conference on information systems. Charlotte, NC
Pretz JE, Naples AJ, Sternberg RJ (2003) Recognizing, defining, and representing problems. In: Davidson JE, Sternberg RJ (eds) The psychology of problem solving. Cambridge University Press, Cambridge, pp 3–30
Bera P, Burton-Jones A, Wand Y (2014) How semantic and pragmatics interact in understanding conceptual models. Inf Syst Res 25(2):401–419
Harrington J (2002) Relational database design clearly explained. Morgan Kaufmann Publishers, San Francisco
Mayer RE (2001) Multimedia learning. Cambridge University Press, New York
Vessey I, Conger SA (1994) Requirements specification: learning object, process, and data methodologies. Commun ACM 37(5):102–113
Dimoka A, Pavlou P, Davis FD (2011) Neuro IS: the potential of cognitive neuroscience for information systems research. Inf Syst Res 22(4):687–702
Todd PA, Benbasat I (1987) Process tracing methods in decision support systems research: exploring the black box. MIS Q 11(4):493–512
Glaholt MG, Reingold EM (2011) Eye movement monitoring as a process tracing methodology in decision making research. J Neurosci Psychol Econ 4:125–146
Gegenfurtner A, Lehtinen E, Saljo R (2011) Expertise differences in the comprehension of visualizations: a meta-analysis of eye-tracking research in professionals domains. Educ Psychol Rev 23:523–552
Rayner K (1998) Eye movements in reading and information processing: 20 years of research. Psychol Bull 124(3):372–422
Cowen L, Ball LJ, Delin J (2002) An eye movement analysis of web page usability. In: Faulkner X, Finlay J, Detienne F (eds) Proceedings of the 16th British HCI group annual conference. 2002, Springer-Verlag, London, pp 317–335
Goldberg JH, Kotval XP (1998) Eye movement-based evaluation of the computer interface. In: Kumar SK (ed) Advances in occupational ergonomics and safety. ISO Press, Amsterdam, pp 529–532
Mayer RE (1983) Thinking, problem solving, cognition. London, W.H. Freeman and Company
Nunnally J, Bernstein I (1994) Psychometric theory, 3rd edn. McGraw Hill, New York
Kagdi J, Yusuf H, Maletic JI (2007) On using eye tracking in empirical assessment of software visualization. In: Proceedings of the 1st ACM international workshop on empirical assessment of software engineering languages and technologies (WEASEL Tech ‘07). ACM, Atlanta, pp 21–22
Sharif B, Maletic JI (2010) An eye-tracking study on the effects of layout in understanding the role of design patterns. In: Proceedings of the 26th IEEE international conference on software maintenance (ICSM ‘10). Timisoara, pp 1–10
Sharif B, Maletic JI (2009) The effect of layout on the comprehension of UML class diagrams: a controlled experiment. In: Proceedings of the 5th IEEE international workshop on visualizing software for understanding and analysis (VISSOFT 2009). Edmonton, pp 11–18
Cyr D et al (2009) Exploring human images in website design: a multi-method approach. MIS Q 33(3):539–566
Poole A, Ball LJ (2006) Eye tracking in human-computer interaction and usability research: current status and future prospects. In: Ghaoui C (ed) Encyclopedia of human computer interaction. Idea Group, Hershey, pp 211–219
Armstrong T, Olatunji BO (2009) What they see is what you get: eye tracking of attention in the anxiety disorders. Psychol Sci Agenda. March: p. http://www.apa.org/science/about/psa/2009/03/science-briefs.aspx
Privitera CM et al (2010) Pupil dilation during visual target detection. J Vis 10(10/3):1–14
Van Gerven PW et al (2004) Memory load and the cognitive pupillary response in aging. Psychophysiology 41(2):167–174
Just MA, Carpenter PA (1976) Eye fixations and cognitive processes. Cognit Psychol 8:441–480
Mayer RE, Moreno R (2003) Nine ways to reduce cognitive load in multimedia learning. Educ Psychol 38(1):43–52
Mayer RE (2005) Principles for reducing extrandeous processing in multimedia learning: coherence, signaling, redundancy, spatial contiguity, and temporal contiguity principles. In: Mayer RE (ed) The cambridge handbook on multimedia learning. Cambridge University Press, New York, pp 183–200
Newell A, Simon HA, Solving Humanproblem (1972) Englewood Cliffs. Prentice Hall, NJ
Farzin F et al (2011) Reliability of eye tracking and pupillometry measures in individuals with fragile X syndrome. J Autism Dev Disord 41:1515–1522
Wooding DS (2002) Fixation maps: quantifying eye-movement traces. In: Proceedings of the 2002 symposium on eye tracking research and applications (ETRA ‘02). ACM, New Orleans, pp 31–36
Kerre EE, Chen G (eds) Fuzzy data modeling at a conceptual level: extending ER/EER concepts. Physica Verlag
Khatri V et al (2014) Capturing Telic/Atelic temporal data semantics: generalizing conventional conceptual models. IEEE Trans Knowl Data Eng 26(3):528–548
Author information
Authors and Affiliations
Corresponding author
Appendices
Appendix 1: demonstrating the general applicability of the modeling rules
The purpose of this appendix is to provide an indication that the proposed rules can support a range of applications. In particular, we show how they can be used to model four cases in which roles can be salient and which could be, if a method is not available, difficult to model. We use examples from Elmasri and Navathe [43], represented on the left side of the figure. The right side of the figure shows the guided EER models that follow our rules. The annotations in the figure indicate how each rule in Table 3 is brought to bear. For example, the link (1, 2) in Fig. 10 shows that rules 1 and 2 are brought to bear in the identification of university and Person.
-
In Fig. 10, we see a Person who can be in one or more roles (alone or together)—a student and an Employee. To show each as a role, we need to show the linked base classes. Based on the context, these are the university and an Organization.
Fig. 10 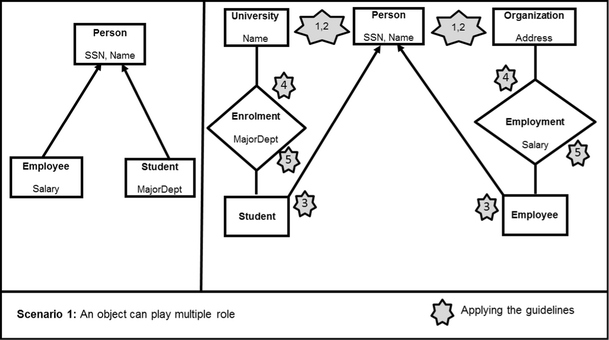
Scenario 1: an object can play multiple roles (e.g., Person can be student and Employee)
-
In Fig. 11, we see a role that can have two base entity classes—a Personal customer and a corporate customer. To show each as a fulfilling the same role, we need to show the linked base class in this case—a bank. In this case, the Account_Holder can be a Person—inheriting all the Person attributes, or a company—inheriting its attributes.
Fig. 11 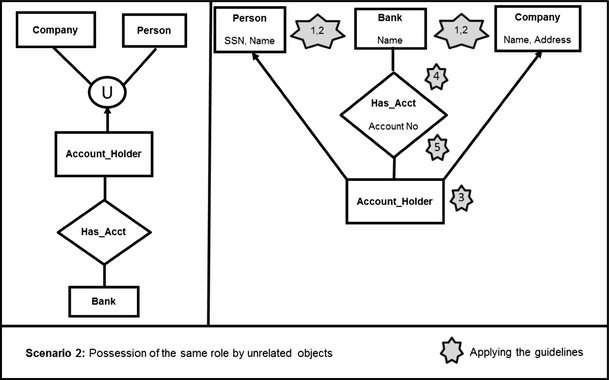
Scenario 2: possession of the same role by unrelated objects (e.g., an account can be possessed by a Person and a company)
-
In Fig. 12, we see a role that can be further specialized. A Person works for an Organization—being an Employee. Then, the Employee (a role) is used as a base class to derive the meaning of a faculty—a specialization of an Employee. In this case, a faculty is linked to a new base class—a university, which is a subclass of an Organization.
Fig. 12 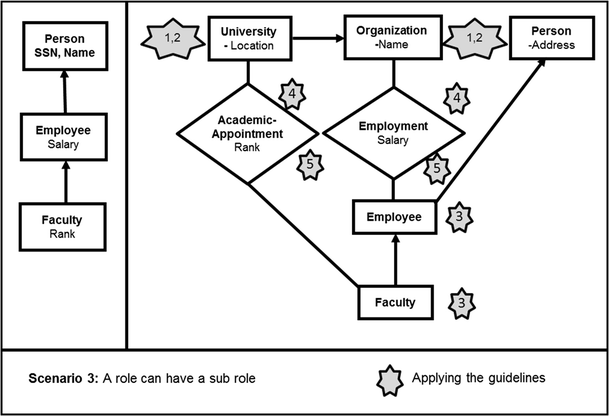
Scenario 3: a role can have a sub-role (e.g., a faculty is a sub-role of Employee)
-
In Fig. 13, we see a Person who takes one or both of two roles—separately or together—a student and an Employee. People who are in both roles obtain a new role with the university—reduced tuition. This is shown by creating an additional level of specialization. The students who are Employees have a reduced tuition with the university.
Fig. 13 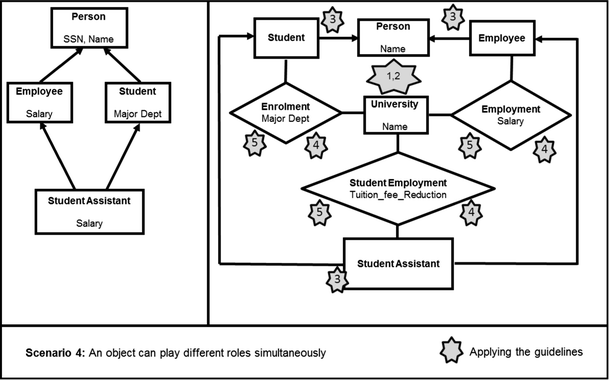
Scenario 4: an object can play different roles simultaneously (joint role) (e.g., a Person can be student and an Employee at the same time)


Overall, our examples show that that the proposed rules are quite flexible and can model each of these four scenarios.
Appendix 2: guided and unguided EER scripts in the experiment

Unguided EER script

Guided EER script
Appendix 3: additional detailed results from eye tracking
Rights and permissions
About this article

Cite this article
Bera, P., Burton-Jones, A. & Wand, Y. Improving the representation of roles in conceptual modeling: theory, method, and evidence. Requirements Eng 23, 465–491 (2018). https://doi.org/10.1007/s00766-017-0275-9
Received:
Accepted:
Published:
Issue Date:
DOI: https://doi.org/10.1007/s00766-017-0275-9