
Abstract
This work proposes a novel method for the detection of glottal activity regions from the speech signal. Glottal activity detection refers to the problem of discriminating voiced and unvoiced segments of the speech signal. This is a fundamental step in the work flow of many speech processing applications. Much of the existing approaches for voiced/unvoiced detection are based on linear measures though the speech is produced from an underlying nonlinear process. The present work solves the problem from a nonlinear perspective, using the framework of multifractal analysis. The fractal property of the speech signal during the production of voiced and unvoiced sounds is sought to obtain the characterization of glottal activity. The characterization is done by computing the Hurst exponent from the evaluation of the scaling property of fluctuations present in the speech signal. Experimental analysis shows that Hurst exponent varies consistently with respect to the dynamics of glottal activity. The performance of the proposed method has been evaluated on the CMU-arctic, Keele and KED-Timit databases with simultaneous electroglottogram signals. Experimental results show that the average detection accuracy or error rate of the proposed method is comparable to the best performing algorithm on clean speech signals. Besides, evaluation of the robustness of the proposed method to noise degradation shows comparable results with other methods for signal-to-noise ratio greater than 10 dB and 20 dB, respectively, for white noise and babble noise.
1 Introduction
According to the human speech production mechanism, a voiced speech signal is produced by the excitation of the vocal tract system by the vibration of vocal folds at the glottis region [31]. The vibration occurs due to the pressure exerted by the air (from the lungs) on the thin vocal fold membranes. This in turn causes the vocal folds to split open and close in succession, giving the air column a specific shape. The process is known as glottal activity (GA), and it is the primary mode of excitation to the vocal tract system. The other mode of excitation to the vocal tract system is the irregular fluctuations of air, known as turbulence [19]. The process corresponds to nonglottal activity (non-GA) regions in an utterance since vocal fold vibration is absent. During the process, there occurs a total or partial constriction in the vocal tract, obstructing the flow of air to produce an unvoiced speech. Thus, the interaction of vocal folds, glottis and vocal tract system brings in dynamic variations in the airflow. This in turn characterizes the regions of GA/non-GA in the speech signal.
Glottal activity detection (GAD) from the speech signal is one of the fundamental steps involved in many speech processing applications such as speaker recognition [35], prosodic modification [17] and speech synthesis [3]. For instance, Adiga et al. [3] reported that an accurate detection of GA can improve the naturalness (quality of being natural) of speech in statistical parametric speech synthesis. Besides, Govind et al. [17] demonstrated the importance of GAD in modifying the speech rate, known as duration modification. Furthermore, Murty et al. [31] reported that the timing of GA with respect to oral activity plays a key role in distinguishing the manner of articulation of stop consonants in Indian languages.
GA in the speech signal can be detected by analyzing the features present in the glottal excitation signal. However, this is a challenging task due to the interaction of the vocal tract system on the glottal excitation signal. Drugman et al. [14] reported the problem as a blind separable one since neither the excitation source nor the vocal tract spectral response is observable. Even so, a noninvasive technique called electroglottography can track the process of glottal vibration by placing two electrodes across the neck region. The electroglottograph measures the time-varying impedance across the vocal fold contact region during continuous speech, and the resultant waveform is known as electroglottographic (EGG) signal [18, 27]. Nonetheless, the EGG signal fails to analyze the functioning of airflow through glottis [14]. This is because EGG device measures the changes in the impedance only, not the airflow in both GA regions and non-GA regions. It is also important to note that the feasibility of recording an EGG signal is limited for real-time speech processing applications. Hence, the detection of the GA directly from the speech signal is of great importance. GA/non-GA detection is otherwise known as detection of voiced/unvoiced regions from the speech signal. Throughout this paper, we interchangeably use the terms GA/non-GA and voiced/unvoiced.
1.1 Review of Glottal Activity Detection Methods
Methods for the detection of GA can be broadly categorized into time domain, frequency domain and statistical model-based techniques. Earlier works in time domain consider different acoustic features estimated from the speech signal that can differentiate GA/non-GA regions. The time domain features used were energy, periodicity, zero crossing rate (ZCR), autocorrelation coefficient at unit sample delay, statistics from linear prediction (LP) residual [6, 43]. For example, Atal and Rabiner [6] have used five different features such as the energy of the speech signal, the ZCR, the correlation between samples, the first LP coefficient and the energy in the normalized prediction error.
During the past decade, researchers have focussed majorly on robust time domain features estimated from the excitation source signal for GAD. This in turn requires suppression of the vocal tract spectral response. A general approach is to use LP analysis to inverse filter the speech signal and estimate the residual, an error signal [40]. The LP residual is found to show a large value of error in the GA regions. The instants of larger error correspond to the closing phase of vibrating vocal folds. Conversely, the residual exhibit random noise-like characteristic in the non-GA regions. However, the LP analysis method is not robust to noise and its performance is greatly dependent on the accuracy of the model. Later, Murty et al. [31] and Dhananjaya and Yegnanarayana [12] proposed GAD methods that do not rely on the estimation of the vocal tract response. The authors used the zero frequency filtering (ZFF) approach to detect the regions of GA. The ZFF is based on the fact that discontinuities due to impulse-like excitations are reflected across all frequencies including zero frequency. Hence, the speech signal is passed twice through zero frequency filters and the trend is removed to obtain the ZFF signal. The ZFF signal exhibits lower energy in non-GA regions since the energy of random noise excitation is distributed in both time and frequency domains. Conversely, the ZFF signal shows higher energy in GA regions since the energy of impulse-like excitation is highly concentrated in the time domain. Moreover, the strength of excitation (SoE) estimated as the slope around instants of positive zero crossings (epochs) of the ZFF signal exhibits discriminating characteristics with respect to GA. The SoE will be higher in the regions of impulse-like excitation due to glottal vibration. Precisely, the GA regions are estimated as the region having SoE greater than one percent of the maximum SoE. Again, the ZFF method is not robust to superimposed impulse-like characteristics. Recently, Koutrouvelis et al. [26] proposed a method termed ‘glottal closure and opening instant estimation forward–backward algorithm’ (GEFBA) based on the instants of significant excitation (epochs) for high-resolution GAD. GEFBA estimates the instants of glottal closures for determining the boundaries of GA by assuming that two consecutive voiced regions differ by a distance greater than twice the maximum pitch period.
Further, the normalized autocorrelation peak strength (NAPS) of the excitation signal is used as a feature for characterizing the GA/non-GA regions [47]. The NAPS will be relatively higher in GA regions when compared to non-GA regions. There are also studies which use a combination of the aforesaid features for GAD. For instance, Adiga and Prasanna [2] used a combination of features such as SoE, NAPS and higher order statistics (HoS) [such as skewness and kurtosis] of the LP residual extracted from different source representations [ZFF signal and integrated LP residual (ILPR)] for improving the performance of GAD. The ILPR can be obtained by inverse filtering the non-pre-emphasized speech signal [38], and it shows prominent peaks during the instants of glottal closure and smaller peaks during the instants of glottal opening. That is, the ILPR exhibits asymmetrical characteristic as that of the derivative of EGG signal and shows higher strength in the GA regions.
Furthermore, there are also methods which use frequency domain features for GAD. In Janer et al. [23], spectral maxima detected from the wavelet transform of the speech signal are used for discriminating GA and non-GA regions. The author hypothesizes that GA regions have at least three number of spectral maxima. The normalized low frequency energy (NLFE) ratio (computed from the spectrogram of the speech signal) is also found useful in characterizing GA/non-GA regions [43]. The authors found that NLFE ratio is higher for GA regions when compared to non-GA regions. Then, discrimination of GA/non-GA regions is made based on the median of the ratio measure. Arifanto [5] used the harmonicity measure estimated from the instantaneous frequency amplitude spectrum of the speech signal for GAD. Further, GAD from noise-degraded speech signals is addressed in Drugman and Alwan [13] based on the summation of residual harmonics (SRH). For GA regions, the amplitude spectrum E(f) of the residual signal shows peaks at the harmonics of the fundamental frequency \((F_0)\). Therefore, SRH is computed from E(f) for each frequency in the range of minimum \(F_0\) to maximum \(F_0\) and voicing decision is made based on a threshold fixed on the estimated SRH.
In summary, the aforesaid time domain or frequency domain methods extract features that show variation in values with respect to GA/non-GA during speech production. A decision on GA is then made based on the fixation of threshold on the individual feature. Also, many of these features may not provide acceptable performance in the presence of noise. In order to avoid threshold fixation and to improve performance, researchers have trained acoustic features using statistical models [3, 39, 42]. These models include the Gaussian mixture model (GMM), support vector machines (SVM), hidden Markov model and deep neural network (DNN). Recently, Adiga et al. [3] modeled GA features such as SoE, HoS and NAPS along with mel-cepstral features in HMM and DNN for a better GA/non-GA decision. However, the statistical model-based approaches are more popular in voice activity detection (VAD), which is otherwise known as speech/non-speech discrimination [15, 34, 44, 53]. Unlike GAD, VAD considers both voiced and unvoiced sounds as speech, and silence and noise as non-speech [4]. VAD is also used in a number of speech technology applications such as speech recognition [50], speech coding [7] and speech enhancement [22]. A detailed description of VAD methods is outside the scope of the present study.
Though the aforesaid methods provide acceptable performance in GAD, they do not provide a clear understanding of the variation in the dynamics of the system during GA/non-GA. In particular, the statistical model-based methods do not provide any significant insights about the mechanism of voice production [12]. Moreover, recent studies show that the dynamic transitions occurring during speech production are attributed to the variations in the synchronization pattern of vocal folds and the sub/supra-glottal system [52]. The process is referred to as eigenmode (a pattern of motion) synchronization/desynchronization. Often, the interaction of sub-glottal (below the glottis) or supra-glottal (above the glottis) system with vocal folds causes changes in the synchronization pattern of the eigenmodes. Also, the transition between different patterns of synchronization controls the vocal fold vibration and voice quality. Briefly, the dynamics of speech production can be thus thought of as a complex system involving the nonlinear interaction of many subsystems [52]. Any difference in the dynamics of the system can be mapped to variations in its complexity. Such a voice map requires understanding speech production in the framework of nonlinear dynamics. Therefore, the scope of this study is to develop a unique way of characterizing the complexity of the speech production system that will aid in distinguishing GA and non-GA regions in the speech signal. In contrast to the existing methods, we try to solve the problem from a nonlinear perspective following the multifractal approach. However, before performing any kind of nonlinear analysis like multifractal analysis, it is essential to first verify that the speech signal is generated from an underlying nonlinear process. Therefore, we use one of the generally accepted statistical tests called surrogate data analysis technique [48] for verifying the nonlinear nature of the speech signal. For details of the surrogate technique and results of the test, kindly refer “Appendix A”. Moreover, the relevance of fractal analysis in characterizing GA/non-GA regions is also illustrated in “Appendix A”.
1.2 Literature on Multifractal Analysis of Speech Signals
The fractal analysis can be used to explain complex dynamics that result in patterns/fluctuations which are scale-invariant. For such a fractal signal, the scale invariance relates the fluctuations in the signal across multiple timescales as follows:
where c is a constant and H is the power law exponent [21]. If the value of H is a constant, the signal is said to be monofractal. In contrast, if H is a distribution, the signal is called a multifractal signal.
The speech signal is also found to possess a scale-invariant structure as studied in [16]. That is, the structure repeats itself on subintervals (self-similarity) of the speech signal. Moreover, there exist spatial and temporal variations in the scale-invariant structure of the signal due to the turbulent excitation of the vocal tract system. These spatial and temporal variations contribute to the multifractal nature of the speech signal. In other words, fluctuations in the speech signal follow different scaling rules. Therefore, multifractal analysis is a promising tool for unveiling the scaling rules of fluctuations corresponding to the voiced and unvoiced speech signal. This in turn will aid in characterizing the GA/non-GA regions in the speech signal. Though many linear measures such as autocorrelation, energy, ZCR and SoE have been used over the years as measures for characterizing the GA regions, fractal theory has not been explored for the characterization of GA to the best of our knowledge.
Researchers have performed a multifractal analysis of the speech signal for determining the speech signal characteristics. Adeyemi [1] investigated the multifractal nature of unvoiced sounds alone by analyzing a few sounds in the alphabet of English language spoken in isolation. The study concludes that the unvoiced speech signals may be multifractal in nature due to turbulent excitation. Besides, the study reveals that the multifractal nature of the speech sound is not peculiar to gender and the type of unvoiced speech sounds. The author also reports that the structural complexity in the unvoiced sound will be more in continuous speech than in isolated alphabets. That is, continuous speech has more intervocalic structure than isolated alphabets. Hence, multifractal analysis of unvoiced sounds in continuous speech should also be explored. Zhao and He [54] performed multifractal analysis of the speech signal for investigating the influence of frame duration and noise on the multifractal characteristics. They considered a different frame duration from 12.5 to 125 ms for multifractal processing of speech signals (female voices) from a Chinese speech corpus. The study concludes that the multifractal characteristics of each speech frame show close resemblance for a fixed frame duration. Conversely, if the frame duration is different, the characteristics of the same speech have a significant distinction. They also report that the multifractality of the speech signal is greatly affected in the presence of noise. Gonzalez et al. [16] report that there is no rigid boundary on the frame duration for characterizing the fractal nature of the speech signal. They observe that the speech signal may posses monofractal or multifractal characteristics depending upon the frame duration at which the analysis is performed. The authors conclude through empirical studies (on Portuguese speech databases) that most of the speech data possess multifractal behavior when analyzed in the timescale of 50–100 ms. They also report that multifractal features can enhance the speaker recognition performance when combined with mel-cepstral features. Researchers have also utilized the effectiveness of multifractal features for discriminating music and speech signal as reported in Bhaduri and Ghosh [8]. Here, the authors found that the width of the multifractal spectrum corresponding to the speech signal is more than that of the music signal. Further, the same research group has used the Hurst exponent (HE) [20] measure estimated from multifractal analysis for discriminating anger and sad emotion in the speech signal [9]. They found that the HE for an anger emotional speech is lesser than that of the sad version. Similarly in Liu and Zhang [29], authors have used features based on the multifractal spectrum for characterization of four different emotional speech signals (happiness, anger, neutral and sadness) in the Mandarin language.
1.3 Novelty of the Present Work
Although the aforesaid works provide insights into the fractal behavior of the speech signal, a complete characterization of the fractal nature of the speech signal during the production of voiced and unvoiced sounds of continuous speech is not done. The fractal nature of voiced/unvoiced sounds in continuous speech is worth identifying. Precisely, the involvement of multiplicity of scales in the dynamics of voiced or unvoiced speech production can be verified. Such verification will allow us to characterize the variation in dynamics during GA/non-GA. Therefore, the proposed study focuses on quantifying this variation of dynamics using measures from the multifractal analysis. Here, we use the capability of HE measure obtained from the evaluation of the scaling property of fluctuations present in the speech signal. We show that the variation of the HE can distinguish GA and non-GA during the production of the speech signal. To the best of our knowledge, the present work is the first application of multifractal analysis in the characterization and detection of GA/non-GA in continuous speech.
The rest of the paper is organized as follows: In Sect. 2, we initially provide a brief overview of the multifractal detrended fluctuation analysis (MFDFA). Then, we explain the proposed method for GAD using multifractal analysis. In Sect. 3, we discuss the experiments conducted in the present study for unraveling the effectiveness of multifractal analysis in GAD. Firstly, we illustrate the usefulness of HE measure in characterizing GA/non-GA. Secondly, we discuss the empirical studies conducted for the fixation of an optimal threshold for the detection task. Then, we compared the performance of the proposed approach with state-of-the-art methods on both clean speech signals and signals degraded in the presence of noise. Finally, in Sect. 4 we conclude the present work.
2 Proposed Method for Glottal Activity Detection Using MFDFA
In the present study, we employ MFDFA technique to understand the difference in scaling rules of fluctuations in GA regions and non-GA regions of the speech signal. A brief description of the steps involved in MFDFA is given in the following subsection.
2.1 Multifractal Detrended Fluctuation Analysis
The multifractal detrended fluctuation analysis (MFDFA) is a fractal analysis method proposed by Kantelhardt et al. [24] by extending the concept of detrended fluctuation analysis (DFA) [36]. MFDFA helps in identifying the fractal nature of time series whose fluctuations scale differently. The analysis includes the following steps: For a given time-series data x(i) of length N, where \(i=1,2,3,\ldots ,N\)
Step 1 an integrated time series is constructed as follows:
where \(\bar{x} = \frac{1}{N}\sum \nolimits _{i = 1}^N {x(i)} \) is the mean of the time series.
Step 2 The integrated time series is further divided into \(N_\mathrm{s}\) nonoverlapping segments of equal span s. Here, \(N_\mathrm{s}=N/s\) where N and s are the length of the time series and the length of the scale in samples, respectively.
Step 3 For each value of the scale s, the qth-order overall root-mean-square (RMS) variation is computed as follows:
where \({y_v}(i) = \sum \nolimits _{k = 0}^p {{E_k}{{(i)}^{p - 1}}}\) is the polynomial fit for trend removal where \(E_k\) is the kth coefficient of the fit polynomial with degree p. \(F_\mathrm{s}^q\) is known as the structure function or fluctuation function.
The advantage of computing various qth-order fluctuation function is that the negative q-order will amplify segments with extremely small RMS and positive q-order will amplify segments with extremely large RMS. Thus, the overall q-order RMS is able to distinguish between the structure of small and large fluctuations.
Step 4 Find out the scaling behavior of the structure function \(F_{\mathrm{s}}^q\) by analyzing the logarithmic plot of \(F_{\mathrm{s}}^q\) versus s for each q order. Now if there exists an inverse power law behavior such that \(F_{\mathrm{s}}^q \propto {s^{H(q)}}\), then the logarithmic plot will show a linear relation between \(F_{\mathrm{s}}^q\) and s with H(q) as the slope. H(q) is known as the generalized HE. It is a measure of the long-range temporal correlation in the signal. For a multifractal signal, H(q) will have different values for different orders of q. In contrast, H(q) is independent of q for a monofractal signal.
Step 5 The generalized HE (H(q)) is converted to scaling exponent T(q) using the relation
Since multifractal data have multiple HE, the scaling exponent T(q) will have nonlinear relationship with q. Further, T(q) is converted to q-order singularity exponent h(q) and singularity dimension D(q) via the Legendre transform [30]:
The plot of h(q) versus D(q) is known as the singularity spectrum or multifractal spectrum. For a multifractal signal, the multifractal spectrum will be a large arc (inverted) as shown in Fig. 1. The value of h(q) for which D(q) reaches maximum or peak value is known as the dominant singularity exponent. This peak or the central tendency of the spectrum represents the average fractal nature of the signal [21]. Further, the width of the spectrum is obtained by taking the difference between the maximum and minimum values of h(q). The spectral width is a measure of fractality of the signal under investigation. Precisely, a larger spectral width corresponds to strong multifractal nature of the signal. In contrast, a narrow width implies that the signal has approximately monofractal nature. For an absolutely monofractal signal, the width of the spectrum will be zero. Theoretically, a complete multifractal spectrum requires the selection of q order in the range from \(-\,\infty \) to \(+\,\infty \). Here, q tends to \(-\,\infty \) and \(+\,\infty \) corresponds to \(h{(q)_{\mathrm{max}}}\) and \(h{(q)_{\mathrm{min}}}\) respectively. Furthermore, the multifractal spectrum may not be always symmetric in shape. The spectrum exhibits right or left truncation depending on the sensitivity of the multifractal structure to local fluctuations with small or large magnitudes, respectively. Furthermore, the multifractal spectrum is different from the spectrogram plot which represents the variation in frequency content in a signal by means of variation in colors. Instead, it describes the dynamics of a system by means of a continuum of singularity exponents. A detailed description of the multifractal spectrum is available in [21].
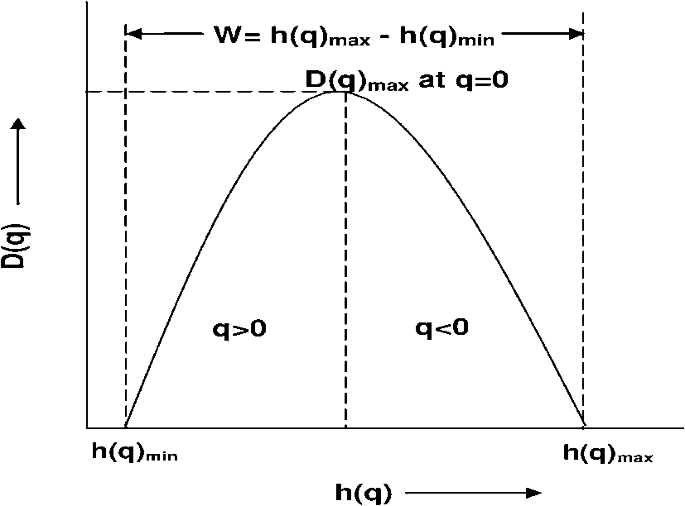
Schematic diagram of the multifractal spectrum. The width of the spectrum (W) ranges from \(h{(q)_{{\mathrm{max}} }}\) to \(h{(q)_{{\mathrm{min}} }}\)
2.2 Proposed Framework
The proposed framework is shown in Fig. 2. The method relies on the estimation of HE for discrimination of GA and non-GA regions of the speech signal. Our approach is motivated from the observation that the HE reveals the difference in fractal nature of voiced and unvoiced speech sounds. The experimental evidence is shown in Sect. 3.1. Here, a frame-based analysis is followed in order to estimate the HE. Precisely, the frame length is kept as 400 samples (50 ms) for a sampling frequency of 8 kHz. The frame overlap is kept one sample less than that of the frame duration. This ensures that the length of the estimated HE feature vector is the same as that of the signal. The choice of 50 ms for the analysis frame is fixed based on the observation made by Gonzalez et al. [16]. The authors found that a frame duration of 50 ms (minimum) is suitable for multifractal processing of speech signal. Now, for each of the extracted frames of the speech signal, we perform MFDFA. The timescale is fixed based on the fundamental frequency \(F_0\) (inverse of the characteristic timescale) present in the speech signal. Precisely, we varied the scale from two to four cycles of the average \(F_0\) as in Nair [32] and Nair and Sujith [33]. Further, the qth-order fluctuation function is computed for 100 values of q ranging from − 2 to 2 [54]. A higher positive and negative q-order is not preferable as it inflicts numerical errors in the singularity spectrum [21]. Then, we compute the generalized HE of order two for all the frames. We refer to the generalized HE of order two as the HE. Further, the decision on the GA/non-GA is made based on a threshold fixed on the HE by empirical studies. We fix the threshold that gives a minimum error in the detection of GA by evaluating the performance of the proposed method. The results of the empirical experiments are discussed in Sect. 3.2.

Block schematic of the proposed method for GAD. \(F_0\) is the fundamental frequency and HE is the Hurst exponent
3 Experimental Results and Discussion
In this work, we have conducted the following experiments with regard to GAD from speech signal.
Experiments for illustrating the utility of HE in the characterization of GA/non-GA regions.
Experiments for fixing the optimal HE for a decision on GA/non-GA.
Experiments for evaluating the performance of the proposed approach on clean and noise-degraded speech signal.
A brief description of the database used for performing the aforesaid experiments is given below.
Speech Data and Ground Truth The present study uses standard databases such as CMU-arctic database [25], KED-Timit database [10] and Keele database [37]. The CMU database consists of around thousand speech and simultaneous EGG signals of US English male (BDL) and female (SLT) speakers and US English (JMK) by Canadian English male speaker, sampled at 32 kHz. The KED-Timit database contains 453 speech utterances along with simultaneous EGG signals, sampled at 16 kHz. All the utterances were spoken by a male speaker in US English. The recordings were down-sampled to 8 kHz during performance evaluation. Further, the Keele database includes speech and simultaneous EGG recordings from five male and five female speakers in the English language, each for an average duration of 35 s. The recordings are sampled at 20 kHz and provide reference pitch for every 10 ms duration. For GA regions, the reference pitch is a positive value. For non-GA regions and uncertain regions, the reference pitch values are found to be zero and negative values, respectively. It is to be noted that except the Keele database, the other databases considered do not provide any ground-truth GA regions. Nevertheless, manual phoneme level labeling has been provided for the Timit utterances. These manual markings can be used for extracting the ground-truth GA regions. However, the manual markings have many errors at the boundaries of stop consonants, fricatives, etc. as observed by Dhananjaya and Yegnanarayana [12]. In such a scenario, a more reliable approach might be the use of simultaneous EGG signal for the estimation of ground-truth GA regions. In the literature, we find that researchers have used different methods for estimating the ground-truth GA regions from the EGG signal. Dhananjaya and Yegnanarayana [12] and Adiga and Prasanna [2] extracted the ground-truth GA regions by applying the standard ZFF method on the EGG signal. In GEFBA, Koutrouvelis et al. [26] used an algorithm named ‘SIGMA’ [49] for estimating the ground-truth GA regions. Recently, Lal et al. [27] proposed a method based on variational mode decomposition (VMD) for accurate estimation of GA in the EGG signal. In the present study, we therefore made a comparative analysis of the performance of these approaches in the estimation of GA regions from the EGG signal. The results of the comparative study are given in “Appendix B”. We find that the performance of the ZFF method and the VMD-based method is nearly equal. In this work, we use the ZFF method for estimating the ground-truth GA regions of speech signals from CMU-arctic and KED-Timit databases.
3.1 Illustration of the Utility of the HE in the Characterization of GA/Non-GA Regions
In order to illustrate the utility of HE in the characterization of GA/non-GA regions, a voiced segment and an unvoiced segment of speech signal spoken by the same speaker are selected. Then, we perform MFDFA on these segments. The multifractality in these segments is investigated by computing the generalized HE from the variation of the structure functions \((F_{\mathrm{s}}^q)\) at different timescales of measurement (s) and different orders (q). If there exists a temporal correlation in the segment for the corresponding timescale (fixed based on \(F_0)\), the system is expected to exhibit periodic oscillations with HE value near to zero.
The analysis of voiced segments (Fig. 3a corresponding to vowel sound /ax/ and Fig. 4a corresponding to vowel sound /uw/) shows that the generalized HE (H(q)) lies fairly close to zero at different q orders (Figs. 3b, 4b). This is because of the absence of scale invariance for the voiced segment. Fluctuations in the voiced segment happen dominantly at one timescale. In other words, there is a single timescale associated with fluctuations in the voiced segment due to the pitch period oscillations of the vibrating vocal folds. This makes the fluctuations bounded in time for the GA regions. The multifractal spectrum for the voiced segment (Figs. 3c, 4c) is thus clustered around zero, indicating a loss of multifractality.

Illustration 1: Fractal analysis showing periodic nature of voiced sound and random noise-like nature of unvoiced sound. a A voiced speech segment (/ax/), corresponding b distribution of HE for various q-orders and c multifractal spectrum, d–f equivalent plots for unvoiced segment (/s/)

Illustration 2: Fractal analysis showing periodic nature of voiced sound and multifractal nature of unvoiced sound. a A voiced speech segment (/uw/), corresponding b distribution of HE for various q-orders and c multifractal spectrum, d–f equivalent plots for unvoiced segment (/s/)
Furthermore, the analysis of the unvoiced segments (Figs. 3d, 4d) reveals that the segment either exhibits random noise-like behavior or multifractal behavior depending on the fluctuations present in it. Here, both unvoiced segments correspond to unvoiced fricative sound /s/ from the words see and sleep, respectively, in Figs. 3d and 4d. Nevertheless, the fluctuations in the signal or signal structure corresponding to the same fricative sound /s/ differ drastically in the aforesaid words during continuous speech production. Consequently, the fractal nature of the unvoiced sound also shows variations depending on the fluctuations present in it. This can be observed from the plot of multifractal spectrum for unvoiced segments shown in Figs. 3f and 4f. From Fig. 3e (corresponding to /s/ from see), it is observed that the generalized HE lies close to 0.5 for different orders of q. This means that the fluctuations are uncorrelated at all amplitudes. This is evident from Fig. 3f also, where the spectrum is concentrated around 0.5. In contrast, for the unvoiced segment shown in Fig. 4d (corresponding to /s/ from sleep), there exists a slight variation in the slope of the measured fluctuations or the HE for different orders of q (Fig. 4e). This is a direct consequence of the multifractal nature of the unvoiced segment of speech due to the turbulent airflow. That is, the high- and low-amplitude fluctuations scale differently. Hence, the spectrum will be broader for the unvoiced segment due to turbulent airflow (Fig. 4f). Therefore, we conclude that fluctuations in unvoiced segments are not just due to random excitations. It could be due to the nonlinear interaction between turbulence airflow at the glottis and the vocal tract system. Again, we confirm the difference in the fractal nature of the voiced and unvoiced speech by reconstructing the attractor in phase space. Here, an attractor means the set of points in the phase space [45] to which the dynamics of the speech production system eventually converges. For instance, the attractor for voiced speech is the inner dark circular region in the set of closed trajectories in the phase space (shown in Fig. 18b of “Appendix C”). We observed that the reconstructed phase space for voiced and unvoiced sound possesses different multifractal structures. For details of phase space reconstruction and corresponding experimental results, kindly refer “Appendix C”.
In summary, we found that the HE is a potential measure for identifying the difference in scaling rules of fluctuations in GA and non-GA regions. Consequently, the measure can detect the transition from GA to non-GA (and vice versa) in the speech signal. An illustration of the variation in HE (estimated using the proposed framework) with respect to GA is shown in Fig. 5. It is observed that the HE values (Fig. 5b) are fairly close to zero for GA regions (around the time instants 1001–3500 and 4801–6300 samples). In contrast, we observe significantly higher values of HE for non-GA regions (around the time instants 1–1000 and 3501–4800 samples).

Estimation of HE for speech signal containing GA/non-GA regions. a Speech signal, b HE values obtained for the segment of speech signal
3.2 Fixation of Optimal Threshold for HE
The decision on the presence or absence of glottal vibration is made based on a threshold fixed on the estimated HE. The optimal threshold value of the HE for GAD is fixed based on empirical studies conducted on speech signals. The experiments are performed on the first hundred speech files of CMU-arctic SLT database, KED-Timit database and Keele female database. The threshold is fixed such that best performance is attained in the detection of GA regions from the speech signal. Here, we use the recent performance measure proposed by Koutrouvelis et al. [26], called voiced–unvoiced detection error \(( VUV _\mathrm{E})\), as the measure for fixing the optimal value of the threshold. The determination of \( VUV _\mathrm{E}\) is done by applying the operation XOR on two sets X and Y, where X is the set of estimated samples and Y is the set of reference samples. A sample value of one corresponds to a voiced region and zero corresponds to an unvoiced region:
The error represents the proportion of samples that are misclassified during the detection.
In our experiments, initially, we computed the HE value for the speech signal using the proposed method described in Sect. 2.2. We fix the threshold for HE as 0.05, a value close to zero. Then, we estimated the \( VUV _\mathrm{E}\) (with respect to the ground-truth GA regions) in the detection of GA regions from the speech signal. Further, we computed the \( VUV _\mathrm{E}\) for different values of threshold, ranging from 0.06 to 0.25 in steps of 0.01. Figure 6 shows the variation in \( VUV _\mathrm{E}\) as the threshold value is increased from a minimum value (0.05) to a higher value (0.25).

Variation in voiced/unvoiced detection error for different values of HE
The results clearly indicate that the \( VUV _\mathrm{E}\) reaches a minimum when the threshold is fixed around 0.1. It should be noted that the error is high when the threshold is fixed below the value of 0.1. This might be due to the minor aperiodic fluctuations present even in the GA regions. Precisely, the GA regions are also influenced by turbulent airflow at the glottis. This in turn causes imperfections in the periodicity of GA regions. Hence, the HE measure will not be exactly zero in GA regions.

GAD using the proposed method. a Speech signal, b EGG signal with ground-truth glottal regions marked using thick line (blue) as observed from the c reference pitch values, d HE values obtained for the speech signal with estimated glottal regions marked using thick line (red) (Color figure online)
Moreover, we found that the deviation in error from the minimum value is less than one percent for a threshold fixed between 0.1 and 0.14. Hence, one can choose any value in the range of 0.1–0.14. Again, the error is found to be gradually increasing after a threshold value of 0.14. A higher threshold will consider non-GA regions as GA regions and increase the \( VUV _\mathrm{E}\). In the present work, we fix the threshold as 0.1 for the HE measure.
3.2.1 Detection of GA Regions Using the Proposed Framework
After fixing the optimal threshold value for HE through empirical studies, GA regions in the speech signal are detected as illustrated in Fig. 7. Here, Fig. 7a shows the same segment of the speech signal illustrated in Fig. 5a, which is taken from the Keele database. The reference GA regions are shown in the corresponding EGG signal using a thick line (blue) (Fig. 7b). These reference regions are obtained from the corresponding positive pitch \((F_0)\) values given in the database for GA (Fig. 7c). The non-GA regions are marked with a value zero (Fig. 7b). Now, the estimated GA regions are depicted in Fig. 7d using a thick line (red). By comparing Fig. 7b, d, it is clear that the estimated GA regions nearly coincide with the ground-truth regions.
3.2.2 Effectiveness of the Proposed Method in Comparison with Other Methods for GAD
The effectiveness of the proposed approach in detecting GA regions from the speech signal containing different sound units (such as vowels, semivowels, voiced/unvoiced stop sounds and fricatives) is illustrated in this section. We took a speech signal (uttering the sentence ‘She had your dark suit in greasy wash water all year’ named ‘kdt001’) from the KED-Timit database. Figure 8a shows the speech signal with phoneme level markings provided in the database (indicated on top with red line separation). The description of the phoneme category of labeled sounds is given in “Appendix D”. Figure 8c shows the HE values computed using the proposed method. The estimated GA/non-GA regions are shown on top of HE values using a thick red line. The EGG signal corresponding to the utterance is depicted in Fig. 8b for a visual comparison of actual and estimated GA/non-GA regions. It is to be noted that the manual phoneme labeling has an error in the region marked using a dashed blue circle in Fig. 8a. By visual inspection of the simultaneous EGG signal, it is evident that the circled region does not correspond to a region with vocal fold vibration. However, the region has been marked as a voiced stop consonant (/d/ and its closure /dcl/) during manual labeling. Further, we observe that the proposed method is able to identify the GA regions in weak voicing regions (between time instants 5501–5900 and 6851–7050) and voiced stop consonant (around the time instant 5400) as shown in Fig. 8c. Moreover, fricatives (/s/ and /sh/) and unvoiced stop consonant (/k/ and its closure /kcl/) are correctly identified as non-GA regions.

GAD from the speech signal containing different sound units. a Speech signal with phoneme sound labeling on top, b EGG signal, c HE values obtained using the proposed method. The estimated GA regions are shown in thick red line. A manual labeling error is indicated in the dashed blue circle (Color figure online)
Furthermore, we compare the proposed approach with state-of-the-art methods such as GEFBA, ZFF and SRH. The estimated GA regions are represented (using a thick red line) on top of the output signal from each method (Fig. 9b–e). GEFBA relies on the estimation of epochs (GCIs) from the speech signal for GAD. Precisely, GEFBA includes two major phases such as glottal flow estimation and simultaneous GAD/GCI (and GOI) estimation. A rough approximation of the excitation signal, known as glottal flow derivative (GFD), is obtained by LP-based inverse filtering of the speech signal (Fig. 9b). Then, move-forward and move-backward procedures are followed per pitch period to detect an epoch/GCI (marked using ‘*’) and other glottal parameters (instants of glottal opening, return phase, closed phase). Most importantly, the algorithm fixes six strict criteria based on a set of control parameters for simultaneous GAD and GCI (and GOI) estimation. The criteria will be satisfied when the structure of the pulses (negative spikes) in the GFD is almost similar. Also, GEFBA hypothesizes that two consecutive GA regions are separated by a distance greater than the maximum pitch period. However, if at least one criterion fails, GEFBA discards the glottal parameters including epochs. This is evident from Fig. 9b where the epochs are discarded at the weak voicing regions (between time instants 6851–7050). Consequently, GA regions are identified as non-GA regions.

Illustration of the effectiveness of the proposed method in comparison with other methods for GAD. a Speech signal with phoneme sound labeling on top b GFD signal from GEFBA with GCIs/epochs marked using ‘*,’ c SoE obtained from the ZFF signal, d SRH values, e HE values obtained using the proposed method. The estimated GA regions are shown in thick red line on b–e. A manual labeling error is indicated in the dashed blue circle (Color figure online)
The ZFF method also depends on the epochs extracted from the speech signal for reliable GAD. As discussed in Sect. 1.1, the ZFF method estimates epochs as the zero crossings of the ZFF signal. The slope of the ZFF signal around the estimated epochs corresponds to the SoE. Any region with SoE less than one percent of the maximum SoE is identified as non-GA regions [12]. Though the method provides reliable detection in regions of higher SoE, the performance is found to be degraded (Fig. 9c) when the SoE is very minimal (toward the end portion of semivowel or glide /r/ around the time instant 7050 and 8550). Further, the SRH method relies on the residual harmonics of the speech signal for GAD. The method initially takes the sum of the harmonics and inter-harmonics of the residual signal for each frequency in the range \(F_{0,\mathrm{min}}\) to \(F_{0,\mathrm{max}}\) for estimating the mean pitch \(F_{0,\mathrm{mean}}\). Then, the process is repeated in the range \(0.5{F_{0,\mathrm{mean}}}\) to \(2{F_{0,\mathrm{mean}}}\), assuming the range as standard for normal speakers. Finally, a threshold of 0.07 is fixed on the estimated SRH for GAD. The SRH is expected to show a high value for GA regions. However, we find that the SRH method shows error across the boundaries of voiced segments as shown in Fig. 9d. Moreover, the method shows inconsistent behavior at unvoiced segments (as observed in the region around the time instant 9200). This might be due to the variation in residual harmonics. In contrast, we found that the proposed method performs comparatively better than other methods in identifying GA regions, especially in weak voicing regions (Fig. 9e).
3.3 Performance Evaluation
The performance of the proposed method is evaluated on both speech signals from the Keele database, KED-Timit database, CMU-arctic databases. Besides \( VUV _\mathrm{E}\), we use measures such as accuracy of detection \((A_\mathrm{C})\), voicing error \((V_\mathrm{E})\) and unvoicing error \((U_\mathrm{E})\) for the performance evaluation [3]. These measures are defined as follows:
where \({{n_\mathrm{v}}}\) is the total number of voiced samples identified as unvoiced, \({{n_\mathrm{u}}}\) is the total number of unvoiced samples identified as voiced and \({n_{\mathrm{ref}}}\) is the total number of samples. Moreover,
We evaluate the performance of the proposed approach in estimating GA regions from speech signals using the aforesaid measures. The performance is then compared with standard algorithms such as the ZFF, GEFBA and SRH. The results of the performance comparison are given Tables 1, 2 and 3 with the best performance indicated in boldface for the accuracy measure. From the results, it is clear that the proposed approach provides comparable accuracy in the identification of GA regions with respect to the state-of-the-art methods. The average performance of the proposed method on the Keele database and CMU-arctic BDL (in terms of accuracy) is found to be slightly higher than the next best performing GEFBA method. For the KED-Timit database, the performance of the proposed method is near to the next best performing ZFF method. The performance of GEFBA is also near to the proposed approach in the KED-Timit database. Furthermore, the performance of the GEFBA is found to be slightly higher than that of the proposed method for CMU-arctic SLT and JMK databases. We observed that the GEFBA estimates GCIs more reliably (higher identification rate) from the speech signals of SLT and JMK when compared to that from the BDL. This is reflected in the voicing error (as indicated by high \(V_\mathrm{E})\) corresponding to BDL when compared to that of SLT and JMK. The voicing error for the ZFF method is also found to be higher due to the degraded performance of the ZFF at the voicing offset regions. For the Keele database, the difference in error for GEFBA and SRH is found to be very minimal. The higher unvoicing error (as indicated by high \(U_\mathrm{E})\) for SRH implies that more non-GA regions are identified as GA regions. This in turn indicates the degraded performance of the SRH method in discriminating GA and non-GA regions. Furthermore, the voicing error for the proposed method is lower than that of GEFBA and ZFF methods in all databases considered. Precisely, the proposed method detects GA regions more reliably than these methods. This is because of the effectiveness of the HE measure in identifying the temporal correlation in GA regions.
Furthermore, the robustness of the proposed method is evaluated for different noise degradations. The evaluation is done on all the speakers from the CMU-arctic, Keele and KED-Timit databases. We computed the \( VUV _\mathrm{E}\) during the detection of GA regions from the speech signal in the presence of white noise and babble noise. The noise signals are taken from the NOISEX database [51]. Each of these noise signals is added separately to the clean speech signal at varying levels of SNR (20 dB, 10 dB, 5 dB and 0 dB). Tables 4, 5 and 6 show the average \( VUV _\mathrm{E}\) obtained for different noise degradations on speech signals from the CMU-arctic, Keele and KED-Timit databases, respectively. The results indicate that the proposed method detects GA regions with comparable error to the next best performing method for a relatively high SNR condition (20 dB and 10 dB). Precisely, the performance of other methods is lower when compared to that of the proposed method for white noise degradation up to 10 dB in the three databases considered. For babble noise, the proposed approach provides slightly better performance than that of other methods for SNR greater than or equal to 20 dB. Furthermore, the performance of all methods is found to be degraded under low SNR values, with GEFBA providing the least detection error in all the databases. The GEFBA method outperforms all the other methods for a higher level of noise degradation. This is in line with the observation of [26], since GEFBA removes any high-frequency contents during the estimation of GFD. The performance of the ZFF method is also degraded under babble noise when compared to white noise. This is due to the impulse-like characteristic arising from different speakers. Again, the performance of the SRH method is inferior to the proposed method for babble noise. This is due to the degradation of the spectral contents at lower frequencies.

Illustration of spurious multifractality at low SNR. a A voiced speech segment added with babble noise at SNR level of 20 dB, corresponding b linear magnitude spectrum and c multifractal spectrum, d–f equivalent plots for 5 dB, g–i equivalent plots for 0 dB
It is found that the \( VUV _\mathrm{E}\) for the proposed method is higher for low SNR values. The degradation in performance is due to the spurious multifractality caused by crossover [54]. That is, the voiced segment under analysis may contain fluctuations due to more than one characteristic timescale due to the influence of additive noise. This is illustrated in Fig. 10, where a voiced segment of the speech signal is shown with additive babble noise degradations at SNR levels of 20 dB, 5 dB and 0 dB. From the subplots, it is clear that the magnitude spectrum of the speech segments shows sharp peaks (representing pitch period oscillations) for SNR of 20 dB (Fig. 10b). In contrast, the magnitude spectrum corresponding to 0 dB shows a broad frequency profile with many shallow peaks (Fig. 10h). That is, the fluctuation occurs at different timescales. This in turn results in spurious multifractality in the voiced region. In other words, the voiced segments do not possess a loss of multifractal behavior. This is clearly evident from the multifractal spectrum corresponding to voiced segments having SNR of 20 dB (Fig. 10c) and 0 dB (Fig. 10i), respectively. The spectrum is concentrated around the zero value for 20 dB, whereas its width increases for 0 dB. Hence, the HE estimated for voiced segments would show a higher value than the optimal threshold. This in turn categorizes the voiced segments as unvoiced ones and increases the \( VUV _\mathrm{E}\). Further investigation is required to address this issue.
4 Conclusion
In the present study, the usefulness of multifractal analysis in the detection of GA from the speech signal is explored. The main contributions of the study are the following:
A complete characterization of the scaling behavior of fluctuations in GA and non-GA regions in speech using multifractal analysis.
Reliable detection of the GA/non-GA regions of the speech signal using HE measure.
The study confirms that the variation in the scaling behavior of fluctuations during the production of a voiced and unvoiced sound can be better analyzed using MFDFA. We show that the slope of the fluctuation function, HE, can discriminate between GA and non-GA regions. Experimental analysis shows that the non-GA regions exhibit either multifractal or random noise-like nature. In contrast, the GA regions/voiced regions are found to show a loss of multifractal behavior. This difference in the fractal nature is utilized in the detection of GA regions in the speech signal. The HE is found to show a gradual decrease (toward zero) when there is a transition from non-GA to GA. Empirical experiments reveal that a threshold fixed in the range of 0.1–0.14 is optimal in detecting the GA regions.
We evaluated the performance of the proposed approach on speech signals taken from CMU-arctic, Keele and KED-Timit databases using standard measures of GAD. Moreover, we compared the performance of the proposed approach with other standard methods. The performance comparison results show that the proposed method provides slightly better performance than other methods on CMU-BDL and Keele and KED-Timit databases. Also, the performance is found to be comparable with the best performing algorithm on CMU-SLT and CMU-JMK databases. The evaluation of the robustness in the presence of additive noise shows that the proposed method gives lower error rates at higher SNR. However, the performance of the proposed approach reduces for SNR below 10 dB and 20 dB, respectively, for white noise and babble noise. Nevertheless, the present study is an advancement in the understanding of the fractal behavior of the speech signal during GA.
References
O.A. Adeyemi, Multifractal Analysis of Unvoiced Speech Signals, Ph.D. dissertation, University of Rhode Island, USA, 1997
N. Adiga, S.R.M. Prasanna, Detection of glottal activity using different attributes of source information. IEEE Signal Process. Lett. 22(11), 2107–2111 (2015)
N. Adiga, B.K. Khonglah, S.R.M. Prasanna, Improved voicing decision using glottal activity features for statistical parametric speech synthesis. Digit. Signal Process. 71, 131–143 (2017)
G. Aneeja, B. Yegnanarayana, Single frequency filtering approach for discriminating speech and nonspeech. IEEE Trans. Audio Speech Lang. Process. 23(4), 705–717 (2015)
D. Arifianto, Dual parameters for voiced-unvoiced speech signal determination, in Proceedings of ICASSP, vol. 4 (2007), pp. 749–752
B.S. Atal, L.R. Rabiner, A pattern recognition approach to voiced–unvoiced–silence classification with applications to speech recognition. IEEE Trans. Acoust. Speech Signal Process. 24(3), 201–212 (1976)
A. Benyassine, E. Shlomot, H. Su, D. Massaloux, C. Lamblin, J. Petit, ITU-T Recommendation G.729 Annex B: a silence compression scheme for use with G.729 optimized for V.70 digital simultaneous voice and data applications. IEEE Commun. Mag. 35(9), 64–73 (1997)
S. Bhaduri, D. Ghosh, Speech, music and multifractality. Curr. Sci. 110(9), 1817–1822 (2016)
S. Bhaduri, A. Chakraborty, D. Ghosh, Speech emotion quantification with chaos-based modified visibility graph-possible precursor of suicidal tendency. J. Neurol. Neurosci. 7(3), 1–7 (2016)
W.A. Black, Ked timit database (2002). http://festvox.org/dbs/dbs_kdt.html. Accessed 14 Oct 2018
W.A. Black, T. Paul, C. Richard, The Festival speech synthesis system (2014). http://www.cstr.ed.ac.uk/projects/festival/. Accessed 06 June 2019
N. Dhananjaya, B. Yegnanarayana, Voiced/nonvoiced detection based on robustness of voiced epochs. IEEE Signal Process. Lett. 17(3), 273–276 (2010)
T. Drugman, A. Alwan, Joint robust voicing detection and pitch estimation based on residual harmonics, in Proceedings of Interspeech (2011), pp. 1973–1976
T. Drugman, P. Alku, A. Alwan, B. Yegnanarayana, Glottal source processing: from analysis to applications. Comput. Speech Lang. 28(5), 1117–1138 (2014)
D. Enqing, L. Guizhong, Z. Yatong, Z. Xiaodi, Applying support vector machines to voice activity detection, in Proceedings of International Conference Signal Processing (2002), pp. 1124–1127
D.C. Gonzalez, L.L. Ling, F. Violaro, Analysis of the multifractal nature of speech signals, in CIARP in: LNCS, vol. 7441, ed. by L. Alvarez et al. (Springer, Berlin, 2012)
D. Govind, S.R.M. Prasanna, B. Yegnanarayana, Significance of glottal activity detection for duration modification, in Proceedings of Speech Prosody (2012), pp. 470–473
N. Henrich, C. d’Alessandro, B. Doval, M. Castellengo, On the use of the derivative of electroglottographic signals for characterization of nonpathological phonation. J. Acoust. Soc. Am. 115(3), 1321–1332 (2004)
R.S. Holambe, M.S. Deshpande, chap 2, in Nonlinearity Framework in Speech Processing (Springer, Boston, 2012), pp. 11–25
H.E. Hurst, Long-term storage capacity of reservoirs. Trans. Am. Soc. Civ. Eng. 166, 770–799 (1951)
E.A.F. Ihlen, Introduction to multi-fractal detrended fluctuation analysis in Matlab. Front. Physiol. 3(141), 1–18 (2012)
K. Itoh, M. Mizushima, Environmental noise reduction based on speech/non-speech identification for hearing aids, in Proceedings of ICASSP, vol. 1 (1997), pp. 419–422
L. Janer, J.J. Bonet, E. Lleida-Solano, Pitch detection and voiced/unvoiced decision algorithm based on wavelet transforms, in Proceedings of IEEE International Conference on Spoken Language Processing (1996), pp 1209–1212
J.W. Kantelhardt, S.A. Zschiegner, E.K. Bunde, S. Havlin, A. Bunde, H.E. Stanley, Multifractal detrended fluctuation analysis of non-stationary time series. Phys. A 316, 87–114 (2002)
J. Kominek, A. Black, CMU-arctic speech databases, in Proceedings of ISCA Speech Synthesis Workshop (2004), pp. 223–224
A.I. Koutrouvelis, G.P. Kafentzis, N.D. Gaubitch, R. Heusdens, A fast method for high-resolution voiced/unvoiced detection and glottal closure/opening instant estimation of speech. IEEE Trans. Audio Speech Lang. Process. 24(2), 316–328 (2016)
G.J. Lal, E.A. Gopalakrishnan, D. Govind, Accurate estimation of glottal closure instants and glottal opening instants from electroglottographic signal using variational mode decomposition. Circuits Syst. Signal Process. 37(2), 810–830 (2018)
G.J. Lal, E.A. Gopalakrishnan, D. Govind, Epoch estimation from emotional speech signals using variational mode decomposition. Circuits Syst. Signal Process. 37(8), 3245–3274 (2018)
H. Liu, W. Zhang, Mandarin emotion recognition based on multifractal theory towards human–robot interaction, in Proceedings of International Conference on Robotics and Biomimetics (2013), pp. 593–598
B.B. Manelbort, A multifractal walk down Wall Street. Sci. Am. 298, 70–73 (1999)
K.S.R. Murty, B. Yegnanarayana, M. Anand Joseph, Characterization of glottal activity from speech signals. IEEE Signal Process. Lett. 16(6), 469–472 (2009)
V. Nair, Role of intermittency in the onset of combustion instability, Ph.D. thesis, Indian Institute of Technology Madras, India, 2014
V. Nair, R.I. Sujith, Multifractality in combustion noise: predicting an impending combustion instability. J. Fluid Mech. 747, 635–655 (2014)
T. Ng, B. Zhang, L. Nguyen, S. Matsoukas, X. Zhou, N. Mesgarani, K. Vesely, P. Matejka, Developing a speech activity detection system for the DARPA RATS program, in Proceedings of Interspeech (2012), pp. 1–4
A. Pandey, R.K. Das, N. Adiga, N. Gupta, S.R.M. Prasanna, Significance of glottal activity detection for speaker verification in degraded and limited data condition, in Proceedings of TENCON (2015), pp. 1–6
C.K. Peng, S. Havlin, H.E. Stanley, A.L. Goldberger, Quantification of scaling exponents and crossover phenomena in nonstationary heartbeat time series. Chaos Interdiscip. J. Nonlinear Sci. 5, 82–87 (1995)
F. Plante, G.F. Meyer, W.A. Aubsworth, A pitch extraction reference database, in Proceedings of Eurospeech (1995), pp. 827–840
A.P. Prathosh, T.V. Ananthapadmanabha, A.G. Ramakrishnan, Epoch extraction based on integrated linear prediction residual using plosion index. IEEE Trans. Audio Speech Lang. Process. 21(12), 2471–2480 (2013)
F. Qi, C. Bao, Y. Liu, A novel two-step SVM classifier for voiced/unvoiced/silence classification of speech, in Proceedings of International Symposium on Chinese Spoken Language Processing (2004), pp. 77–80
T.F. Quatieri, Discrete-Time Speech Signal Processing: Principles and Practice (Prentice-Hall, Upper Saddle River, 2002)
T. Schreiber, A. Schmitz, Surrogate time series. Phys. D 142, 346–382 (2000)
J.K. Shah, A.N. Iyer, B.Y. Smolenski, R.E. Yantorno, Robust voiced/unvoiced classification using novel features and Gaussian mixture model, in Proceedings of ICASSP (2004), pp. 1–4
C. Shahnaz, W. Zhu, M.O. Ahmad, A multifeature voiced/unvoiced decision algorithm for noisy speech, in Proceedings of IEEE International Symposium on Circuits and Systems (2006), pp. 2525–2528
J. Sohn, N.S. Kim, W. Sung, A statistical model-based voice activity detection. IEEE Signal Process. Lett. 6(1), 1–3 (1999)
S.H. Strogatz, Nonlinear Dynamics and Chaos: With Applications to Physics, Biology, Chemistry and Engineering (Westview Press, Boulder, 2000)
F. Takens, Detecting strange attractors in turbulence, in Lectures Notes in Mathematics, vol. 898 (1981), pp. 366–381
D. Talkin, A robust algorithm for pitch tracking (RAPT). Speech Coding Synth. 495, 495–518 (1995)
J. Theiler, S. Eubank, A. Longtin, B. Galdrikian, J. Farmer, Testing for nonlinearity in time series: the method of surrogate data. Phys. D 58, 77–94 (1992)
M.R.P. Thomas, P.A. Naylor, The sigma algorithm: a glottal activity detector for electroglottographic signals. IEEE Trans. Audio Speech Lang. Process. 17, 1557–1566 (2009)
D. Valj, B. Kotnik, B. Horvat, Z. Kacic, A computationally efficient mel-filter bank VAD algorithm for distributed speech recognition systems. EURASIP J. Adv. Signal Process. 4, 487–497 (2005)
A. Varga, H.J. Steeneken, Assessment for automatic speech recognition. NOISEX-92: a database and an experiment to study the effect of additive noise on speech recognition systems. Speech Commun. 12(3), 247–251 (1993)
Z. Zhang, Mechanics of human voice production and control. J. Acoust. Soc. Am. 140(4), 2614–2635 (2016)
X.L. Zhang, J. Wu, Deep belief networks based voice activity detection. IEEE Trans. Audio Speech Lang. Process. 21(4), 697–710 (2013)
H. Zhao, S. He, Analysis of speech signals characteristics based on MF-DFA with moving overlapping windows. Phys. A 442, 343–349 (2016)
Acknowledgements
The authors gratefully acknowledge Amrita Vishwa Vidyapeetham for the generous funding provided to the first author in pursuing his Ph.D. Further, we thank Dr. Vineeth Nair (IIT Bombay) for providing a better understanding of MFDFA through his Ph.D. thesis.
Author information
Authors and Affiliations
Corresponding author
Additional information
Publisher's Note
Springer Nature remains neutral with regard to jurisdictional claims in published maps and institutional affiliations.
Appendices
A Surrogate Test and Relevance of Fractal Analysis
Basically, the surrogate test examines the validity of a null hypothesis \(({H_0})\) formulated for the original time series. \({H_0}\) is formulated based on the origin of the time series under investigation. Now, surrogates for the original time series are created by a surrogate algorithm, preserving the amplitude distribution, autocorrelation, local mean and variance of the original data. Then, a discriminating statistic is measured for the original data \(({T_\mathrm{o}})\) and its surrogates \(({T_\mathrm{s}})\). Also, the distribution of \({T_\mathrm{s}}\) obtained for the surrogate data can be estimated. If \({T_\mathrm{o}}\) and \({T_\mathrm{s}}\) are significantly different, the null hypothesis \({H_0}\) can be rejected. However, the rejection is carried out in a probabilistic manner, specifying the significance level. The significance level is determined by the number of surrogate data sets as, \(p = 2 \times \frac{1}{{\left( {{{{n}}_\mathrm{s}} + 1} \right) }}\) where \({{{\text {n}}_\mathrm{s}}}\) is the total number of surrogates. The measure of significance for rejection is given by
where \({{\sigma _\mathrm{s}}}\) is the standard deviation of the distribution for surrogates.
The general techniques employed for the generation of surrogate data are random permutation (RP), Fourier transform (FT) and amplitude-adjusted Fourier transform (AAFT) [41, 48]. RP shuffles the data so that any linear correlations present in the original data may be destroyed. However, surrogates preserve the amplitude distribution of the original data. The FT surrogate is based on the null hypothesis that the data originate from a linear Gaussian process. It maintains the amplitude spectrum but the phases are randomized. AAFT algorithm was developed based on the null hypothesis that the original data are a monotonic nonlinear transformation of a linear Gaussian process. Here, the original data are initially rescaled to preserve the Gaussian property. Then, FT surrogates are generated and rescaled back to the amplitude distribution of the original data. Further, the choice of the discriminating statistic is also crucial in the surrogate analysis. The statistic should be selected in such a way that it should not preserve the hypothesis governing the surrogate algorithm. For example, the selection of mean as a discriminating statistic will always satisfy the null hypothesis governing random permutation. In this work, we use the HE estimated using MFDFA as the discriminating statistic.
We use an ensemble of 99 surrogates of the same length as the original speech signal (‘kdt001’ from KED-Timit) in each of the surrogate methods. Figure 11 shows the distribution of the discriminating statistics for the surrogates \(({T_\mathrm{s}})\) and the original speech signal \(({T_\mathrm{o}})\). The corresponding measure of significance t obtained for each surrogate test is also shown in Fig. 11. Here, \({H_0}\) for each surrogate method is rejected if the measure of significance (t) is greater than 2. This is evident from Fig. 11a where the null hypothesis governing RP surrogates is rejected, revealing some temporal correlation in the speech signal. Such a correlated time series is then tested using FT surrogates. If FT is also rejected, then the analysis is continued with AAFT surrogates. Here, we observe that \({H_0}\) governing FT and AAFT are also rejected (Fig. 11b, c). The rejection of \({H_0}\) governing RP, FT and AAFT is an indication of nonlinear process involved in the production of the speech signal. Further, we verified results of the surrogate test in two ways. Firstly, a voiced segment from the same utterance is simulated using LP coefficients and impulse train as excitation. The LP coefficients are obtained by LP analysis (of order 12) of the original speech segment. We use a frame size of 20 ms and frame shift of 10 ms for the LP analysis. The simulated speech output is tested using RP and FT surrogates. We find that the \({H_0}\) governing RP is rejected and FT is accepted (Fig. 12). Secondly, a synthetic version of the aforesaid Timit utterance is generated using ‘HTS-2005’ online tool [11], which uses a source–filter model. Again, we observe that \({H_0}\) governing FT is accepted (Fig. 13b). This is an indication of the linear process involved in the production of both the simulated (LP-based) and HTS synthetic speech signals. Thus, we conjecture that the source–filter model gives a linear approximation of the speech signal. The actual speech production process involves nonlinear interaction of the subsystems/parts from lungs to lips. In this context, a nonlinear technique like fractal analysis appears to be appropriate/relevant for the analysis of speech signals.

Surrogate test for the speech signal ‘kdt001’ from KED-Timit database. Distribution of HE for the surrogates generated using a RP, b FT and c AAFT. The statistic for the original utterance is shown as a vertical dashed line (red). The measure of significance t is indicated on top right for each method (Color figure online)

Surrogate test for the simulated speech signal using LP analysis and impulse excitation. Distribution of HE for the surrogates generated using a RP and b FT. The statistic for the original utterance is shown as a vertical dashed line (red). The measure of significance t is indicated on top right for each method (Color figure online)

Surrogate test for the synthetic version of ‘kdt001’ speech signal generated using HTS-2005, which uses source–filter model. Distribution of HE for the surrogates generated using a RP and b FT. The statistic for the original utterance is shown as a vertical dashed line (red). The measure of significance t is indicated on top right for each method (Color figure online)
In order to investigate the relevance of fractal analysis in characterizing GA/non-GA regions of the speech signal, we have conducted the following experiment. Firstly, we took the aforesaid simulated voiced speech (/aa/) and its original version. Then, we perform MFDFA on these segments. The multifractal spectrum obtained for each of these segments is shown in Fig. 14c. It is observed that the multifractal spectrum of both the segments is clustered near to zero. Secondly, we simulated an unvoiced speech segment (/s/) from the same Timit utterance using LP analysis and random noise excitation. Then, we repeated the fractal analysis on the simulated unvoiced speech and its original version. Figure 15c depicts the resultant multifractal spectrums. From the plot, we can infer that the original unvoiced speech corresponds to a large inverted arc (indicating its strong multifractal nature). In contrast, the spectrum of the simulated unvoiced speech corresponds to a small arc (indicating an approximately monofractal nature). Precisely, the multifractal nature of the unvoiced speech is lost in the LP analysis. This is due to the limitation of the LP analysis in identifying the source–filter interaction. The LP analysis relies on the assumption that source and filter are decoupled entities and the excitation source has no influence on the vocal tract system parameters. However, the excitation source can influence the vocal tract system parameters in the actual speech production process. This in turn can contribute to spatial and temporal variations in the speech signal, resulting in its multifractal nature.

Multifractal analysis on original and simulated voiced speech signal. a Original voiced speech signal, corresponding b simulated version, c multifractal spectrum

Multifractal analysis on original and simulated unvoiced speech signal. a Original unvoiced speech signal, corresponding b simulated version, c multifractal spectrum
Thus, we can conclude that the simulated voiced speech preserves the fractal nature of the original version. However, the simulated unvoiced speech did not capture the spatial and temporal variations (multifractal nature) in the original version. Therefore, the characterization/detection of GA/non-GA (voiced/unvoiced) region based on multifractal analysis may not be effective in the simulated speech signal using LP coefficients and impulse/random noise excitation.
B A Comparative Study of Different Ground-Truth GA Estimation Methods
The ground-truth GA regions of the speech signal from CMU-arctic and KED-Timit databases can be estimated from the corresponding EGG signals. Here, we investigated the performance of three state-of-the-art methods, such as the ZFF method, the ’SIGMA’ algorithm and the VMD method in estimating the ground-truth GA regions from the EGG signal. The ZFF method uses a simple threshold operation on the SoE at the estimated epochs (from the EGG) for the identification of reference GA regions. Precisely, an epoch with SoE greater than one percent of the maximum SoE is considered as the ground-truth GA region [12]. Using the SIGMA algorithm, the boundaries of GA regions are estimated based on the initial and final instants of glottal closure [26]. That is, if the distance between consecutive GA regions is greater than twice the maximum pitch period, the corresponding region is marked as a non-GA region. The VMD method relies on the estimation of epochs from the mode which oscillates close to the fundamental frequency of the speech signal [27, 28]. For GA regions, the method estimates epochs as the positive zero crossings of the selected mode.

Comparison of estimated ground-truth GA regions using different methods. a EGG signal with actual GA regions indicated using dashed blue line, b DEGG signal with estimated epochs from SIGMA marked using ‘\(*\),’ c SoE obtained from the ZFF signal, d VMD output signal with estimated epochs marked using ‘\(*\). The estimated GA regions are shown in thick red line on b–d (Color figure online)
Figure 16 shows the demonstration of GAD from the EGG signal (taken from the Keele database since it has proper ground truth) using the aforementioned methods. The detected GA/non-GA regions from these methods are marked using a thick line (red) on the corresponding output signals (Fig. 16b–d). Reference GA/non-GA regions are shown in Fig. 16a using a dashed blue line. From the visual inspection of Fig. 16c, d, it is clear that the VMD method and ZFF method outperform SIGMA in estimating GA regions, especially at voicing offset regions (region indicated using dashed circle). Therefore, one can choose either the ZFF method or the VMD method for estimation of ground-truth GA regions. Nevertheless, we perform a performance evaluation of the proposed method (and other state-of-the-art methods) using ground-truth GA regions obtained from the ZFF method and VMD method. The evaluation is done on a test database (here, we choose CMU-arctic) since a comprehensive study on ground-truth GAD algorithms is beyond the scope of the present work. Precisely, we compute the \( VUV _\mathrm{E}\) during the detection of GA regions from the speech signal with respect to references from the ZFF method and VMD method. Figure 17a–c shows the \( VUV _\mathrm{E}\) obtained for each method (with respect to the two references) on BDL, SLT and JMK databases, respectively. From the results, it is evident that the \( VUV _\mathrm{E}\) is nearly equal for the two references. Hence, the choice of a method for the estimation of ground-truth GA region is not very critical.

A comparative evaluation of the performance of the proposed method and state-of-the-art methods in GAD from speech signal using the ZFF- and VMD-based ground-truth references. Evaluation on a BDL, b SLT and c JMK databases. I—ZFF method, II—SRH method, III—GEFBA, IV—proposed method
C Phase Space Reconstruction
Generally, all variables defining the state of a complex system are not available in practice. In such a scenario, the dynamics of the system can be visualized by reconstructing the phase space of evolution of the measured variable or time series [33]. The reconstructed phase space will be topologically equivalent to the original one. Also, the variation in the dynamics is always found to be reflected in the structure of the phase space. Therefore, we employ the phase space reconstruction method to visualize the dynamics of the speech production system during the production of voiced and unvoiced speech sounds. We use the time delay embedding technique [46] for reconstruction. Precisely, the speech data are converted into an ensemble of delay vectors. Each delay vector corresponds to a state in the reconstructed phase space. For faithful reconstruction, the embedding parameters such as optimum time delay \(\tau \) and least embedding dimension \(d_0\) are properly determined. \(\tau \) is obtained by computing the first minimum of the average mutual information (AMI). Further, the false nearest neighbors (FNN) technique is used for determining \(d_0\).
For a demonstration of the difference in complexity of the phase space corresponding to the GA/non-GA, we took the same voiced and an unvoiced segment shown in Fig. 4. Then, optimum time delay \({\tau }\) and minimum embedding dimension \({d_0}\) are computed for the segments separately. Figure 18b, d shows the reconstructed phase space for the voiced (Fig. 18a) and unvoiced segments (Fig. 18c), respectively. By visual inspection of Fig. 18b, it is clear that the phase space for voiced segment shows circular patterns (closed trajectories) representing periodic/quasiperiodic oscillations. This occurs due to the periodic/quasiperiodic vibration of vocal folds during the production of voiced speech sounds. On the other hand, the attractor for unvoiced sound (Fig. 18d) is expanded in all directions indicating irregular fluctuations in the airflow. The reconstructed phase space also reveals that the voiced and unvoiced sounds possess different multifractal structure and can be characterized based on multifractal measures.

Demonstration of the reconstructed phase space of the voiced and unvoiced segment of a speech signal. a, b A voiced speech segment and corresponding reconstructed phase space, c, d an unvoiced speech segment and corresponding reconstructed phase space
D Phoneme Category of Sounds
Table 7 gives the phoneme category of sounds mentioned in Figs. 3,4, 8 and 9.
Rights and permissions
About this article

Cite this article
Jyothish Lal, G., Gopalakrishnan, E.A. & Govind, D. Glottal Activity Detection from the Speech Signal Using Multifractal Analysis. Circuits Syst Signal Process 39, 2118–2150 (2020). https://doi.org/10.1007/s00034-019-01253-4
Received:
Revised:
Accepted:
Published:
Issue Date:
DOI: https://doi.org/10.1007/s00034-019-01253-4