
Abstract
To study the influence of the loading rate on the failure process of coal, uniaxial compression tests were performed with various axial strain rates of 0.83 × 10⁻⁵ to 6.66 × 10⁻⁵ s−1 on coal samples, which were collected from the Shamushu Coal Mine in Sichuan Province. The parameters of stress, strain, and acoustic emission during the failure process were collected and recorded. The peak stress, axial strain stiffness, energy dissipation, and acoustic emission characteristics of coal samples with different axial strain rates were analysed. The results demonstrate that (1) as axial strain rates increase, the peak strength and degree of fragmentation of the coal sample after failure also increase, and they exhibit good dependence on the axial strain rate; (2) the axial strain rate has little influence on the change trend in strain stiffness during the process of failure, but as the axial strain rate increases, the strain stiffness value of the horizontal section of the axial strain stiffness curve increases, and the initial stress level of this stage has a forward trend; (3) as the axial strain rate increases, the total energy absorbed by the coal sample increases gradually, and the proportion of elastic strain energy decreases when the peak stress is reached, while the proportion of dissipated energy increases gradually; (4) as the axial strain rate increases, the AE signal’s activity increases in the process of sample failure, the threshold value of the strain level decreases corresponding to AE active and intense periods, and higher amplitude AE signals are produced in the violent period. The research results can provide reference for monitoring and controlling geological hazards, such as pillar instability and failure in underground mining.
1 Introduction
Deep mining of resources has led the geological environment of underground mine working areas to become more complex and varied (Qiu et al. 2014; Wang et al. 2009; Li et al. 2016). Large-scale mining changes the stress and seepage fields of stratum structures, and the forms of instability and failure are becoming increasingly complicated (Liu et al. 2019; Chao et al. 2019, 2020). Dynamic disasters, such as mine earthquakes and rock bursts, have become key, urgent problems in the field of coal mining (Li and Liu 2011; Wang et al. 2013a, b, 2014). In the process of underground mining, the ore pillar is permanently preserved as an important engineering rock mass, which is often affected by the load of the constant strain rate or variable strain rate. For example, when the mining face is continuously excavated, the ore pillar will be in a stress field loaded with a constant strain rate; when the mining work stops, the stress in the area where the ore pillar is located will be redistributed, which will lead to the increase or decrease of the deformation rate of the pillar and then lead to a change of the mechanical properties of the pillar. The mechanical characteristics of rock show obvious loading rate dependence (Bieniawski 1970). In addition, under the influence of mining disturbance, the reserved pillar around the stope and its overlying strata combination structure bear the loading effect of different loading rates, and this has certain effects on the safety of stope production (Yuan et al. 2019; Wang et al. 2013a, b). Therefore, studying the mechanical properties of coal and rock with different loading rates is of great practical significance for coal mine disaster monitoring and prevention (Bailly et al. 2011; Chen et al. 2019).
Loading rate dependence refers to the behaviour of material mechanical properties changing with the change in test loading rate (Yin et al. 2018). In recent years, research on the axial strain rate dependence of coal and rock has been actively explored, and useful research results have been obtained. Zhao et al. (2014) investigated the effect of microstructures on the failure of coal under five different uniaxial compressive strain rates. The results demonstrate that the strength and failure mechanism are strain rate and microstructure dependent. Huang et al. (2013) performed mechanical tests on composed coal and rock with different loading rates and studied the effect of axial strain rate on the behaviour of coal and rock samples. Through the indoor mechanical test, Zhao et al. (2013) studied the influence of loading rate on the fracture test, uniaxial compressive strength, triaxial compressive strength parameters, and creep failure of the Hangcheng coal rock mass. The experimental results demonstrate that the tensile strength, uniaxial strength, and Young's modulus of the coal sample increase with an increase in loading rate. Fukui et al. (2004) independently developed a servo testing machine with double axial loading and studied the relationship between rock shear strength and loading rate. Moreover, Heerden (1985) and Okubo et al. (2006) studied the loading rate dependence of the elastic modulus and peak strength of coal. However, due to the discreteness of the mechanical properties of coal samples, no clear conclusion can be drawn about the dependent relationship among the stiffness, peak strength, and loading rate in the process of coal and rock failure.
In summary, many researchers have conducted studies on the strength characteristics under different loading rates and presented significant conclusions. However, there are few reports on the evolution of axial strain stiffness and energy during uniaxial compression of coal with different axial strain rates. Therefore, it is necessary to conduct in-depth research on the axial strain rate effect of coal. Hence, uniaxial compression tests with different axial strain rates were performed on coal samples collected from the Shamushu Coal Mine of Sichuan Province. The relationship between peak strength and axial strain rate was studied, and the relationship among the axial strain stiffness, energy evolution and acoustic emission parameters, and axial strain rate during the failure process was analysed. The research results can provide a reference for predicting and preventing dynamic disasters in underground coal mining.
2 Experimental Apparatus and Methods
2.1 Coal Specimen Preparation
The lump coal was taken from the S3012 working face of the 2 + 3# coal seam of Shamushu Coal Mine in Yibin, Sichuan Province, southwest China, as shown in Fig. 1. The strike length of the S3012 working face is 752 m, the slope length is 136 m, the depth of the working face is about 450 m, and the average dip angle is 4°. The industrial indicators of the collected coal are as follows: coal moisture content of 0.93%, dry ash basis of 26.31%, dry ash-free basis of 18.48%, fixed carbon content of 54.28%, and coal sample density of about 1483.7 kg/m3. According to the NMR (nuclear magnetic resonance) test, the porosity of the coal rock is 5.58%, and the pore radius is mainly distributed between 0.0014 and 0.03 μm, as shown in Fig. 1d.

Specimens used for this study: a location of sampling; b lump coal; c cylindrical raw coal specimens; d pore size distribution
Large intact coal blocks were drilled from the working face and were shipped to the State Key Laboratory of Coal Mine Disaster Dynamics and Control, Chongqing University, China, for specimen preparation and testing. The coal samples were cored and cut using diamond coring and cutting devices to obtain cylindrical raw coal specimens with a size of φ50 × 100 mm. Both ends of the specimen were then carefully ground using a face grinder, and the specimens were used for this study. According to the International Society for Rock Mechanics Standards (ISRM), the allowable error in the top and bottom surfaces of the sample cannot be > 0.05 mm from the plane parallel to both surfaces. To reduce variability between the samples, the P-wave velocity of the samples was measured, and the orientation of the P-wave velocity was along the axial direction of the sample. Finally, the coal samples with a P-wave velocity of 2050 ± 50 m/s were selected as the test samples and numbered. All of the test samples were divided into four groups (labelled A, B, C, and D) according to different axial strain rates \(\varepsilon^{\prime}\), (\(\varepsilon^{\prime} = 0.83 \times 10^{ - 5} ,{ }1.66 \times 10^{ - 5} ,{ }3.33 \times 10^{ - 5} ,6.66 \times 10^{ - 5} { }\;s^{ - 1}\) respectively), as shown in Table 1.
2.2 Experimental Scheme and Equipment
In this study, uniaxial compression tests were performed on cylindrical coal samples with different axial strain rates. The four axial strain rates are \(0.83 \times 10^{ - 5} , 1.66 \times 10^{ - 5} , 3.33 \times 10^{ - 5} {\text{ and }}\;6.66 \times 10^{ - 5} \;^{ - 1}\). Three specimens were selected for repeated tests at each axial strain rate. The main test equipment included: the Shimadzu AG-IS material testing machine (model AG-250 kN IS), PCI-2 acoustic emission monitoring system, and ASMD3-16 high-speed dynamic resistance strain meter (as shown in Fig. 2).

Experimental apparatus
The Shimadzu AG-IS material testing machine (model AG-250 kN IS) was developed by the Japanese Shimadzu group. The maximum axial load of the testing machine is 250 kN, the axial strain rate ranges from 0.0005 to 1000 mm/s, the minimum sampling interval is 1.25 ms, and the maximum stroke is 1000 mm. In addition, it can be loaded by means of load control and displacement control and perform uniaxial compression/tension, cyclic load, and three-point bending tests. To reduce the friction between the end face of the sample and the loading piston, and to eliminate the end effect, Vaseline was applied to both the upper and lower end faces of the coal samples. The AE signal was pre-amplified (40 dB) and transferred to the PCI-2 AE monitoring system (DISP from American Physical Acoustics Co.), which has a bandwidth of 1 kHz to 3 MHz. The threshold for detection was determined as the threshold of an empty experiment (45 dB). For a better coupling effect, two piezoelectric sensors (NANO-30 Physical Acoustics Co.) were used in this test for real-time acoustic emission signal monitoring. It has a response frequency up to 750 kHz. First, the two sensors were connected to a separate pre-amplifier and then to channel CH1 and channel CH2 of the computer. In this article, counts from the two sensors were not combined, but the data collected by the sensor connected to channel CH2 were used for analysis, and data from another sensor were used as standby data. The AE sensors are installed on the surface in the middle of the sample, and the connecting line of the installation position passes through the central axis of the sample, as shown in Fig. 2. Before the experiment began, an appropriate amount of Vaseline was applied to the surface where the sensor came into contact with the sample, and the sensors were fixed on the sample’s round surface by rubber bands to keep the acoustic coupling over a constant area throughout testing. Finally, a small metal rod was used to lightly touch the surface of the sample to ensure that both acoustic emission sensors could collect data. The ASMD3-16 high-speed dynamic resistance strain gauge is a high-performance product independently developed by Ji'nan Sigma Co. (China). It can accurately measure static and high-speed dynamic strain, stress, residual stress, displacement, temperature, and other physical signals using the company's special computer software. It exhibits high measurement accuracy, good linearity, mobility, and reliable long-term operation while being safe to use. The experimental apparatus is shown in Fig. 2.
3 Results and Discussion
3.1 Coal Deformation Behaviour and Failure Modes
The strength and deformation behaviour of coal is primarily associated with the closure, initiation, propagation, and coalescence of microcracks developed inside the coal sample, and the recorded stress-strain relationship divides the deformation into several stages from crack closure to crack coalescence. In this study, uniaxial compression tests of coal samples with different axial strain rates were performed, and the failure samples were counted and photographed. During the test, the axial stress, axial strain, and radial strain were measured and recorded automatically, and the volume strain was calculated according to Eq. (1). Finally, the variation laws of axial strain (\(\varepsilon_{1}\)), radial strain (\(\varepsilon_{3}\)), and volumetric strain (\(\varepsilon_{v}\)) during the failure process of coal samples with different axial strain rates were obtained. Figure 3 shows the stress-strain curves of coal samples with different axial strain rates.

Stress-strain relationships of the coal samples with different axial strain rates
where \(\varepsilon_{{\text{v}}}\) is volume strain; \(\varepsilon_{1}\) is axial strain; \(\varepsilon_{3}\) is radial strain.
According to Fig. 3, the failure process of coal under uniaxial compression had four stages: compaction, elastic, yield, and failure. According to the stress-volume strain curve, when the axial strain rate is low (0.83 × 10⁻⁵, 1.66 × 10⁻⁵ s−1), the coal volume is always in a compressive state, and it begins to expand after reaching the peak stress level. When the axial strain rate is high (3.33 × 10⁻⁵ or 6.66 × 10⁻⁵ s−1), the volume of coal undergoes compression and dilatation and is finally destroyed after reaching the peak stress level. These differences occur because the internal cracks in the progressive failure process of coal have sufficient time to expand and penetrate when the axial strain rate is low. Therefore, when the volume of a coal sample is in the compression state, the gradually expanding and penetrating cracks have made the coal lose its bearing capacity, and the radial strain of the coal sample is small when damaged. On the contrary, when the axial strain rate is high, the cracks in coal do not have enough time for crack propagation and penetration during the progressive failure process. Therefore, only when the overall deformation of coal reaches a certain degree (i.e., volume expansion) will the coal be destroyed. At this stage in the study, the radial strain of coal was largest when the coal was destroyed.
Figure 4 shows the macroscopic fracture surface morphology of coal sample specimens after uniaxial compression failure with different axial strain rates. Figure 4 shows that, as the axial strain rate increases, the degree of coal breakage after uniaxial compression failure gradually increases as well. The coal failure mode gradually transfers from the shear failure of a single section to the shear failure of multiple sections in the following manner: When the axial strain rate is 0.83 × 10⁻⁵ s−1, as shown in Fig. 4a, the failure mode of coal is relatively simple and occurs mainly along a single main fracture surface. The main part of the damaged specimens does not exhibit large cracks, and the damaged specimens retain integrity. When the axial strain rate increases, the fracture morphology becomes more complex. When the axial strain rate is 6.66 × 10⁻⁵ s−1, as shown in Fig. 4d, the main fracture surface is more obvious, and there are many small shear fracture zones overlapping the main fracture surface. When the peak stress is reached, the crushed stone bursts and the coal is broken into multiple pieces of crushed stone, with poor integrity.

Failure modes of samples after uniaxial compression
The description above demonstrates that the axial strain rate can affect the fracture evolution of coal in the process of uniaxial compression and reveals that an increasing axial strain rate corresponds to higher degrees of coal fragmentation. The results explain that when the overburdened strata of coal pillars are subjected to blasting impact loading, the coal pillars rapidly expand radially until they are destabilised, and the degree of coal fragmentation after destruction is high. On the contrary, when coal pillars continue to undergo slow deformation and failure under the long-term effect of in situ stress, they gradually exhibit deformation until failure. The overall process of deformation is slower and the integrity of the damaged coal pillar is better in the former process.
3.2 Effect of Axial Strain Rate on Peak Stress
The compressive strength of coal is of great significance to underground mining. Specifically, for pillars, which are the main supports, the strength characteristics of coal samples under different axial strain rates are central in mine safety. Scholars have previously attempted to derive empirical equations to express the relationship between the strain rate and coal and rock material strength. For example, Hashiba et al. (2006) and Okubo (2006) proposed the following empirical equation to describe the dependence between the peak strength and axial strain rate:
where \(\sigma_{\alpha }\) is the peak strength at a strain rate of \(\varepsilon^{\prime}_{\alpha }\); \(\sigma_{\beta } \) is the peak strength at a strain rate of \(\varepsilon^{\prime}_{\beta }\); \(n\) is the strain rate dependence coefficient, which is considered an essential parameter characterising rock strength and the time dependency of deformation. A smaller n corresponds with greater clarity regarding the dependence of the axial strain rate at peak strength. On the contrary, a larger n corresponds with less clarity regarding the dependence of the axial strain rate at peak strength.
According to the test results, the mean peak strength (\(\sigma^{p}\))of the coal sample reached 10.55, 12.04, 13.98, and 14.93 MPa as the axial strain rate increased, exhibiting a positive correlation between the peak strength and axial strain rate. The dependence coefficient (n) is 5.30 at different axial strain rates calculated by Eq. 2. Compared with the results of Hashiba et al. (2006) and Okubo et al (2006), the strain rate dependence coefficient of coal in this study is obviously smaller, which indicates that the peak strength of the coal in the Shamushu mining area has a greater dependence on the axial strain rate than other rock materials.
3.3 Analysis of Axial Strain Stiffness
The axial strain stiffness during the failure process of uniaxial compression can reflect the variation law of deformation resistance during the loading process of coal. However, it is difficult to observe the axial strain stiffness of different stress stages without specific analytic methods only by the characteristics of the stress-strain curve. Therefore, many scholars primarily use the first-order derivation method of the stress-strain curve to calculate axial strain stiffness in the deformation process. However, this method cannot accurately reflect the evolutionary characteristics of axial strain stiffness in different deformation stages because of its large fluctuation and low discrimination (Gao et al. 2016; Eberhardt et al. 1998). Therefore, the authors used the moving point linear regression method, and a calculation method sketch is shown in Fig. 5. The calculation steps of this method are as follows: First, the stress-strain curve is decomposed into many small segments; second, the average deformation stiffness of each small segment is calculated; finally, the axial strain stiffness curve in the whole deformation process is obtained. Regarding the method’s sensitivity to the user-defined regression interval, it was found that the general shape of the stiffness curve remained the same with increasing interval sizes, but small-scale fluctuations in the measured deformation response were filtered out when extremely large regression intervals were used. Therefore, the author selects one data point for every 15 × and y data pairs from all of the x and y data pairs (see points A, B, C, D, and E in Fig. 5) and calculates the stiffness from every two adjacent data points. The size of the regression interval is about 3.3% of the total number of x and y data pairs, such as those determined by Eq. (3):

Calculation diagram of axial strain stiffness
where \(\xi_{\varepsilon 1}\) is the axial strain stiffness, GPa; i is the i-th data point of the stress-strain curve data points obtained from all monitoring; \(\xi_{\varepsilon 1} \left( i \right)\) is the axial strain stiffness corresponding to the i-th data point, GPa; \(\sigma_{1} \left( i \right)\) is the axial stress of the i-th data point, MPa; \(\varepsilon_{1} \left( i \right)\) is the strain of the i-th data point.
Due to the limited space of the ar, only one of the typical samples is selected for analysis under each axial strain rate. According to Eq. (3), the diagram presented in Fig. 5 demonstrates the calculation process of B-point axial strain stiffness. By changing the value of i, the axial strain stiffness of all calculated points in the stress-strain process of coal can be calculated. It effectively avoids the disadvantage of the large fluctuation in axial strain stiffness calculated by the traditional first derivative method.
The stress of each coal sample during the loading process was normalised according to Eq. (4), and the relationship between the axial strain stiffness and stress level of coal under different axial strain rates was obtained, as shown in Fig. 6.

Relationship between axial strain stiffness and stress level
where \(\gamma\) is the stress level; \(\sigma_{i}\) is the stress during the failure process of coal, MPa; \(\sigma_{{\text{c}}}\) is the peak stress of coal, MPa.
Figure 6 shows that the axial strain stiffness curves of coal under different axial strain rates occurs in three distinct phases as the stress level gradually increases, i.e., the rising phase, stable phase, and falling phase. This indicates that the axial strain rate has little influence on the change trend of axial strain stiffness during the failure process of coal sample. That is, as the stress level increases, the curve exhibits change characteristics over the three defined phases.
The uniaxial compression process of a coal sample has gone through the stages of pore and fracture compaction, elastic deformation, plastic deformation, and failure. Many scholars begin from the axial strain stiffness curve and regard the stability stage of the curve as the elastic deformation stage of the specimen and the strain stiffness value as the elastic modulus of the specimen (Gao et al. 2018). Figure 6 demonstrates that in the stable phase of the axial strain stiffness curve, the values of the axial strain stiffness fluctuate around a constant value, which is the elastic modulus of coal. Under strain rates of 0.83 × 10⁻⁵ s−1, 1.66 × 10⁻⁵ s−1, 3.33 × 10⁻⁵ s−1, and 6.66 × 10⁻⁵ s−1, the elastic modulus of coal is 1.52 GPa, 1.64 GPa, 1.76 GPa, and 2.03 GPa, respectively. The results show that there is an obvious dependence between the elastic modulus of coal measured by this method and the axial strain rate; that is, the greater the axial strain rate, the greater the elastic modulus of coal obtained by the test. This conclusion is consistent with the research results of many scholars on the influence of axial strain rate on rock strength (Komurlu 2018; Zhao et al. 2013; Fuenkajorn and Kenkhunthod 2010; Huang and Liu 2013).
When the coal is in the stage of elastic deformation, the internal compression is compact, the damage is small, and the mechanical properties are good. Therefore, it is of great practical significance to conduct relevant research in this stage for engineering practices. Based on this, to analyse the influence of the axial strain rate on the distribution of stress levels in the elastic deformation stage of a coal sample, the stress level distribution maps corresponding to each stage of the axial strain stiffness deformation curve under different axial strain rates are drawn according to Fig. 6, as shown in Fig. 7.

Distribution of axial strain stiffness in different phases
The lower and upper limit stress levels of the stress level interval corresponding to the stable phase were recorded as \(\gamma {}_{l}\) and \(\gamma {}_{{\text{u}}}\), respectively, as shown in Fig. 7. With the increase in the axial strain rate, \(\gamma {}_{{\text{l}}}\) reached 62.3%, 60.58, 58.9, and 54.58%, and \(\gamma {}_{{\text{u}}}\) reached 91.45%, 89.75%, 88.59%, and 86.36%. Both values exhibited a downward trend, indicating that the distribution of the elastic deformation stage in the stress level region is dependent on the axial strain rate. Like the axial strain rate, the initial stress level corresponding to the elastic deformation stage decreases as well, and the distribution interval at the stress level exhibits a forward trend.
3.4 Effect of Axial Strain Rate on Energy Accumulation and Release
3.4.1 Principle of Energy Computation
In the process of coal failure, there are four main energy transformations: energy input, energy accumulation, energy dissipation, and energy release (Zhang and Gao 2015). From the first law of thermodynamics (Hawkins et al. 1992), it can be seen that:
where \(U\) is the total strain energy input by external force to the coal sample; \(U^{{\text{e}}}\) is the elastic strain energy of coal sample; \(U^{{\text{d}}}\) is the dissipated energy in the deformation process of coal sample; \(U^{0}\) is the energy input to the coal sample by external energy in the form of thermal radiation or heat exchange. This test is conducted at a constant temperature and normal room temperature, and therefore U0 can be ignored. In the process of rock element compression, when the strain is \(\varepsilon_{i}\), the relationship among \(U_{i}\), \(U_{i}^{e}\), and \(U_{i}^{d}\) can be expressed by Eq. (6).
In the principal stress space, the unit energy (Chen et al. 2018; Solecki et al. 2003) of coal can be expressed as:
According to Hooke's law, Eq. (8) can be rewritten as follows:
where \(E_{0}\) is the modulus of elasticity and \(\mu\) is Poisson's ratio.
This is a uniaxial compression test, so Eqs. (7) and (9) can be transformed into formulas (7′) and (9′) respectively.
According to the concept of definite integral, the total input energy (\(U\)) can be calculated according to the Eq. (10) as follows:
where \(\sigma_{1}^{i}\) and \(\varepsilon_{1}^{i}\) are the stress and strain corresponding to the i-th data point on the stress-strain curve, respectively.
The dissipation energy of coal during the test is as follows:
3.4.2 Energy Evolution Law
According to the energy calculation principle of Sect. 3.4.1, the energy parameter curves of the stress-strain process of a coal sample under different axial strain rates were obtained, and they are shown in Fig. 8. The graph illustrates that the evolutionary behaviours of coal energy parameters under different axial strain rates are similar. The total energy \(U\) and dissipated energy \(U^{{\text{d}}}\) increase with the increase of deformation. The curve of elastic strain energy \(U^{e}\) is in good agreement with the stress-strain curve—that is, the elastic strain energy (\(U^{e}\)) increases gradually before the peak stress, and the elastic strain energy (\(U^{e}\)) curve falls rapidly after reaching the peak stress.

Stress-strain and energy parameter curves of coal under different axial strain rates: a \(\varepsilon^{\prime}\) = 0.83 × 10⁻⁵ s−1, b \(\varepsilon^{\prime}\) = 1.66 × 10⁻⁵ s−1, c \(\varepsilon^{\prime}\) = 3.33 × 10⁻⁵ s−1, d \(\varepsilon^{\prime}\) = 6.66 × 10⁻⁵ s−1
In the initial stage of stress loading, \(U\), \(U^{e}\), and \(U^{{\text{d}}}\) all increase gradually, but \(U^{{\text{d}}}\) gradually exceeds \(U^{e}\). This indicates that in the initial stage of stress loading, most of the total energy (\(U\)) absorbed by coal is converted into dissipated energy (\(U^{{\text{d}}}\)), and only a small part of the energy is stored in the form of elastic strain energy. This is because in the initial stage of stress loading, coal samples are in the stage of crack compaction, and most of the energy is consumed crack closure and friction between rock particles. With the increase of stress, \(U^{e}\) increases rapidly, while \(U^{{\text{d}}}\) increases slowly. This shows that the damage of the coal sample is minimal in this process, and most of the energy absorbed is stored in the sample in the form of elastic strain energy (\(U^{e}\)), except for a small part of the energy converted into dissipated energy (\(U^{{\text{d}}}\)).
When approaching the peak stress level, the elastic strain energy curve tends to be gentle, while the dissipated energy curve rises rapidly. After reaching the peak stress level, the elastic strain energy curve drops rapidly to the minimum. On the contrary, the dissipated energy curve increases rapidly to the maximum. The above phenomena show that the internal damage of coal increases rapidly near the peak stress, and the expansion of damage cracks and friction and dislocation between coal particles consume most of the energy (i.e., \(U^{{\text{d}}}\)). After reaching the peak stress level, the dissipation energy increases further along with the expansion of macro-cracks and breakage. The elastic strain energy (\(U^{e}\)) releases rapidly after exceeding the peak stress, the curve drops, and the dissipation energy curve increases rapidly. This demonstrates that the deformation and failure of coal is a process of constant energy absorption and release. Concurrently, the energy parameter curves of coal exhibit a similar evolution law under different axial strain rates, which shows that the axial strain rate will not affect the energy conversion trend of coal sample deformation and the failure process.
Energy accumulation and dissipation are essential attributes of the coal deformation process. Energy accumulation and dissipation of coal samples are closely related to the strain rate (Zhang et al. 2000). Peak stress is the maximum stress required for the failure of a coal sample. The total energy corresponding to the peak stress level (\(U_{p}\)) is the energy that is input from the outside when the coal is damaged under uniaxial compression. Therefore, the analysis of the energy parameters corresponding to peak stress under different loading conditions is conducive to further revealing the energy mechanism of deformation and damage of coal samples under different axial strain rates. The energy parameters corresponding to the peak stress point of coal samples obtained in this study are shown in Table 2, and the corresponding change curve is shown in Fig. 9.

Energy parameters corresponding to peak stress points at different axial strain rates
As shown in Fig. 9, as the axial strain rate increases, the total energy (\(U_{p}\)) corresponding to the peak stress increases slowly, the dissipated energy (\(U_{p}^{d}\)) increases linearly, and the elastic strain energy (\(U_{p}^{e}\)) increases first before stabilising. This is because the compression process of the coal sample is always accompanied by the transformation of total energy into dissipated energy and elastic strain energy. As for the dissipated energy, the void compaction and displacement dislocation between particles in the coal sample become more intense as the axial strain rate increases, resulting in the continuous increase in dissipated energy. Moreover, the elastic strain energy is that which is accumulated in the coal samples after deformation. It is assumed that the deformation of a coal sample on the same rock block is certain when it reaches failure. Therefore, as the axial strain rate increases, the elastic strain energy of the coal sample gradually tends to stabilise.
To further analyse the distributional characteristics of the elastic strain energy and dissipation energy of the coal sample when the axial stress reaches the peak stress level at different axial strain rates, the elastic strain energy ratio (\(\frac{{U_{p}^{e} }}{{U_{p} }}\)) and dissipation energy ratio (\(\frac{{U_{p}^{d} }}{{U_{p} }}\)) of each coal sample were calculated, as shown in Table 2. Both \(\frac{{U_{p}^{e} }}{{U_{p} }}\) and \(\frac{{U_{p}^{d} }}{{U_{p} }}\) represent the percentage of elastic strain energy and dissipated energy in the total energy absorbed by coal when the peak stress is reached. According to Table 2, as the axial strain rate increases, the elastic strain energy ratio (\(\frac{{U_{p}^{e} }}{{U_{p} }}\)) decreases gradually (85.7%, 84.7%, 80.3%, 70.6%) while the dissipation energy ratio (\(\frac{{U_{p}^{d} }}{{U_{p} }}\)) increases gradually (14.3%, 15.3%, 19.7%, 29.4%). This demonstrates that as the axial strain rate increases, the proportion of elastic strain energy in the total energy absorbed by coal gradually decreases, while the proportion of dissipated energy gradually increases.
It has been shown that the elastic strain energy and dissipated energy of coal increase as the axial strain rate increases once the peak stress is reached and that their increase leads to a slow increase in total energy absorbed by coal. However, at the peak stress level, the proportion of dissipated energy to total energy increases with the increase in axial strain rate, while the proportion of elastic strain energy decreases. Thus, compared with the lower axial strain rate, the higher axial strain rate can convert more energy into dissipated energy and release more by way of displacement, dislocation, or burst of coal particles. This shows that when the mining progress changes, the stability of the coal pillar should be monitored and evaluated in real time by using the monitoring data such as a displacement meter, stress meter, and sound emission. At the same time, necessary protective measures should be taken to prevent the coal pillar from being damaged because of the massive accumulation of elastic strain energy inside the coal pillar to guarantee the safety of mine production.
3.5 Analysis of AE Characteristics of the Coal Sample Under Uniaxial Compression
The sudden release of strain energy in the form of elastic waves under the action of external forces is called acoustic emission (AE). The change characteristics of acoustic emission parameters can elucidate the failure characteristics of materials (Xia et al. 2014). Through acoustic emission monitoring of the engineering rock mass, the damage degree of the rock mass can be judged, and reliable parameters can be provided for mine coal mass disaster prediction (Meng et al. 2016). Based on the uniaxial compression test of coal samples, the acoustic emission characteristics are analysed using the acoustic emission event rate, ring counting rate, and amplitude, and the relationship between the failure mechanism and the characteristics of acoustic emission parameters under different axial strain rates can be investigated. The research results provide theoretical support for predicting pillar damage and failure by using acoustic emission parameters. An acoustic wave caused by an acoustic emission signal pulse exceeding the threshold value is called an acoustic emission event. The AE events can be used to identify local changes in materials and the number of AE events generated by local changes within the material in a unit time is called the AE event rate. The AE ringing count refers to the number of oscillations of signals above the threshold value, and the number of oscillations per unit time that exceed the threshold signal is called the ringing count rate. Figure 10 illustrates the relationship between stress-acoustic emission strain parameters of coal samples under different axial strain rates.

Relationship curves of stress-strain and AE strain parameters under different axial strain rates: a \(\varepsilon^{\prime}\) = 0.83 × 10⁻⁵ s−1, b \(\varepsilon^{\prime}\) = 1.66 × 10⁻⁵ s−1, c \(\varepsilon^{\prime}\) = 3.33 × 10⁻⁵ s−1, d \(\varepsilon^{\prime}\) = 6.66 × 10⁻⁵ s−1
According to Fig. 10, the acoustic emission parameters of the coal sample failure process under different axial strain rates have the following characteristics:
-
1.
In the pore and fracture compaction stage, the acoustic emission event rate and ringing count rate are relatively low, and the signal amplitude is relatively low. The acoustic emission signal is primarily a friction-type acoustic emission (Wen et al. 2011); this stage is called the quiet period (Su et al. 2013). Figure 10 shows that when the axial strain rate is 0.83 × 10⁻⁵ s−1, the quiet period of the coal failure process accounts for approximately 60% of the whole process and ends when the strain reaches 0.633%. Correspondingly, when the axial strain rate is 1.66 × 10⁻⁵ s−1, 3.33 × 10⁻⁵ s−1, and 6.66 × 10⁻⁵ s−1, the quiet period accounts for about 55%, 40%, and 30% of the whole process and ends when the strain reaches 0.599%, 0.457%, and 0.298%, respectively. This demonstrates that under the action of small ground stress, the damage deformation of the coal sample during the deformation process is primarily caused by the compaction of interstitial cracks in the sample, and almost no new fractures are generated. Therefore, there are fewer friction-type acoustic emission signals of low amplitude in this stage.
-
2.
With the increase in axial strain, the specimen deformation gradually enters the stage of elastic crack stable development. During this stage, the stress concentration in the matrix of the specimen is concentrated, new micro-cracks are formed, and a small number of acoustic emission signals is released. As Fig. 10 shows, both the AE event rate and AE ringing count rate begin to increase gradually in this stage, and the amplitude level of the AE signal produced increases after the quiet period; this stage is called the AE active period. The continuous process of coal in the AE active period is different under different axial strain rates. When the axial strain rate is 0.83 × 10⁻⁵ s−1, the active period of the coal sample failure process ends when the strain reaches 0.899%. Correspondingly, when the axial strain rate is 1.66, 3.33, and 6.66 × 10⁻⁵ s−1, the active period ends when the strain is 0.886%, 0.929%, and 0.773%, respectively.
-
3.
When the stress is close to the peak stress level, the coal samples are in the stage of unsteady failure and deformation. In this stage, the AE event rate and the ringing count rate increase sharply, and the amplitude of AE signals also increases significantly compared with the previous two stages. During this deformation stage, the damage of the coal sample increases rapidly, and the failure mode shown in Fig. 4 is formed after the failure of the sample; this is called the acoustic emission violent period. As Fig. 10 shows, the proportion of the violent period in the whole process of coal sample failure under different axial strain rates increases gradually with the axial strain rate.
-
4.
According to the above characteristics of acoustic emission parameters, the distributional characteristics of the quiet, active, and violent periods of acoustic emission during the coal sample failure process under different axial strain rates were obtained, as shown in Fig. 11. In the picture, \(\varepsilon_{c}\) is the strain corresponding to the peak stress; \(\varepsilon_{i}\) is an arbitrary strain in the process of deformation, (\(0 \le \varepsilon_{i} \le \varepsilon_{c}\));\(\eta\) is the strain level, (\(\eta = \frac{{\varepsilon_{i} }}{{\varepsilon_{c} }}\)); \(\eta_{Q}\) is the corresponding strain level at the end of the quiet period and the threshold value of the strain level at the start of the active period; \(\eta_{A}\) is the corresponding strain level at the end of the active period and the threshold value of the strain level at the start of the violent period. The strain level ranges from 0 to \(\eta_{Q}\) in the quiet period, \(\eta_{Q}\) to \(\eta_{A}\) in the active period, and \(\eta_{A}\) to 1 in the violent period. As shown in Fig. 11, as the axial strain rate increases, \(\eta_{Q}\) and \(\eta_{A}\) decrease gradually, and the proportion of active and violent periods increases, while the proportion of quiet periods decreases gradually.
Fig. 11 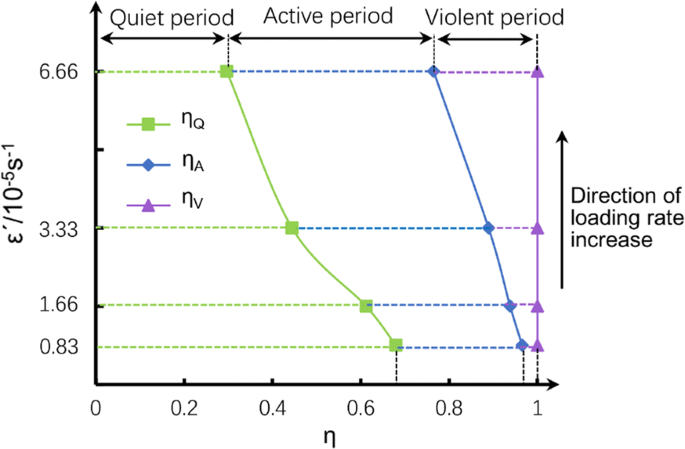
Distribution characteristics of quiet, active, and violent periods under different axial strain rates

The results above demonstrate that the acoustic emission phenomenon of coal is the result of its internal damage and fracture. By analysing acoustic emission parameters, the damage evolution law can be observed. The failure process of coal can be divided into three stages: the quiet, active, and violent periods. Among them, only a small number of low-amplitude frictional signals are produced in the quiet period and many high-amplitude rupture signals are produced in the violent period. In addition, different axial strain rates show different characteristics of the three stages of AE; that is, when the axial strain rate is 0.83 × 10⁻⁵ s−1, the corresponding strain ranges of the three stages are 0–0.680\(\varepsilon_{c}\), 0.680\(\varepsilon_{c}\)–0.966\(\varepsilon_{c}\), and 0.966\(\varepsilon_{c}\)–\(\varepsilon_{c}\), respectively, and when the axial strain rate is 6.66 × 10⁻⁵ s−1, the corresponding strain ranges of the three stages are respectively 0–0.300\(\varepsilon_{c}\), 0.300\(\varepsilon_{c}\)–0.765\(\varepsilon_{c}\), and 0.765\(\varepsilon_{c}\)–\(\varepsilon_{c}\). Further analysis shows that, compared with the lower axial strain rates, the higher axial strain rates can make the active and violent periods move forward and produce more acoustic emission signals, and the amplitude of acoustic emission signals is larger. The area where acoustic emission signals are concentrated is also larger in the figure, as shown in the red circle in Fig. 10. The results show that, compared with the lower axial strain rate, the higher axial strain rate makes coal samples produce more high-amplitude AE signals at relatively lower strain levels. This conclusion can provide a reference for monitoring coal pillar stability and predicting disasters under different axial strain rates.
4 Conclusions
In this study, uniaxial compression tests at different axial strain rates were performed on coal samples, which were collected from the Shamushu Coal Mine in Sichuan Province. Based on the experimental data of stress, strain, and acoustic emission parameters during the failure process of coal, the dependence of axial strain rate on the failure process is studied. Several important conclusions are drawn as follows:
-
1.
When the axial strain rate is small (e.g., 0.83 × 10⁻⁵ s−1), the volume of coal samples is gradually compressed. When the peak stress level is reached, the volume begins to expand. When the axial strain rate is large (e.g., 6.66 × 10⁻⁵ s−1), the volume strain of coal undergoes two stages of compression and expansion successively, and the degree of sample breakage is high. Some specimens have spattering debris, which indicates that the axial strain rate has a significant impact on the damage of coal.
-
2.
The peak stress of coal samples increases as the axial strain rate increases. The dependence coefficient (n) between the peak stress and axial strain rate was calculated to be 4.66. Compared with other rock materials, the value of n is smaller, which indicates that the peak stress of coal in the Shamushu Coal Mine exhibits obvious dependence on the axial strain rate.
-
3.
During uniaxial compression, the axial strain-stiffness curves of all samples clearly exhibit three-stage change characteristics. Axial strain rate has a significant influence on the stress level distribution of the three stages. The main manifestation is that with the increase in axial strain rate, the initial stress level corresponding to the elastic deformation stage (stable stage) decreases, and the distribution range of the stress level exhibits a forward trend. At this stage, the corresponding axial strain stiffness (i.e., elastic modulus of coal sample) increases with an increase in axial strain rate, which has an obvious dependence on the axial strain rate.
-
4.
The axial strain rate will not affect the energy conversion trend in the failure process of coal, but with the increase in axial strain rate, the total energy absorbed by the coal sample increases gradually. The elastic strain energy ratio (\(\frac{{U_{p}^{e} }}{{U_{p} }}\)) decreases gradually when the peak stress level is reached, while the dissipated energy ratio (\(\frac{{U_{p}^{d} }}{{U_{p} }}\)) increases gradually, which indicates that an increase in axial strain rate can promote the transformation of total energy to dissipated energy.
-
5.
According to the characteristics of acoustic emission parameters, the failure process can be divided into quiet, active, and violent periods. As the axial strain rate increases, the acoustic emission signal activity increases in the process of coal sample failure as well. The corresponding threshold of the strain level decreases as the axial strain rate increases during the active and violent periods, and the high-amplitude acoustic emission signal clearly increases as the axial strain rate increases during the violent period. Thus, an increase in axial strain rate can promote coal damage and destruction and make energy release rapidly in the form of elastic waves while producing many AE signals.
The above conclusions demonstrate that the deformation, strength, energy evolution, and acoustic emission characteristics of the coal sample failure process under uniaxial compression exhibit obvious dependence on the axial axial strain rate. Therefore, the loading of overlying strata on coal pillars should be monitored in real time during coal mining, and effective prevention measures should be taken. The research results of this article can serve as a reference for monitoring and preventing geological hazards such as pillar instability and damage caused by secondary stress fields in the underground process of coal mining and can provide a means for developing safety procedures in underground mining engineering.
References
Bailly, P., Delvare, F., Vial, J., Hanus, J. L., Biessy, M., & Picart, D. (2011). Dynamic behavior of an aggregate material at simultaneous high pressure and strain rate: Shpb triaxial tests. International Journal of Impact Engineering, 38(2–3), 73–84.
Bieniawski, Z. T. (1970). Time-dependent behaviour of fractured rock. Rock Mechanics and Rock Engineering, 2(3), 123–137.
Chao, J. K., Yu, M. G., Chu, T. X., Han, X. F., Teng, F., & Li, P. (2019). Evolution of broken coal permeability under the condition of stress, temperature, moisture content, and pore pressure. Rock Mechanics and Rock Engineering, 52(8), 2803–2814.
Chen, Y. L., Withanage, K. R., Uchimura, T., Mao, W. W., & Nie, W. (2020). Shear deformation and failure of unsaturated sandy soils in surface layers of slopes during rainwater infiltration. Measurement, 149, 1–12.
Chen, Y. L., Zhang, Y. N., & Li, X. L. (2019). Experimental study on influence of bedding angle on gas permeability in coal. Journal of Petroleum Science and Engineering, 179, 173–179.
Chen, Z. Q., He, C., Wu, D., Gan, L. W., & Yang, W. B. (2018). Mechanical properties and energy damage evolution mechanism of deep-buried carbonaceous phyllite. Rock and Soil Mechanics, 39(2), 445–456.
Eberhardt, E., Stead, D., Stimpson, B., & Read, R. S. (1998). Identifying crack initiation and propagation thresholds in brittle rock. Canadian Geotechnical Journal, 35(2), 222–233.
Fuenkajorn, K., & Kenkhunthod, N. (2010). Influence of loading rate on deformability and compressive strength of three thai sandstones. Geotechnical and Geological Engineering, 28(5), 707–715.
Fukui, K., Okubo, S., & Ogawa, A. (2004). Some aspects of loading-rate dependency of sanjome andesite strengths. International Journal of Rock Mechanics and Mining Sciences, 41(7), 1215–1219.
Gao, M. B., Li, T. B., Meng, L. B., Chen, G. Q., Chen, C., Liao, A. J., et al. (2016). The method to identify characteristic stresses of rock in different stages during failure process. Chinese Journal of Rock Mechanics and Engineering, S2, 138–149.
Gao, M. B., Li, T. B., Meng, L. B., Ma, C. C., & Xing, H. L. (2018). Identifying crack initiation stress threshold in brittle rocks using axial strain stiffness characteristics. Journal of Mountain Science, 15(6), 1371–1382.
Hashiba, K., Okubo, S., & Fukui, K. (2006). A new testing method for investigating the loading rate dependency of peak and residual rock strength. International Journal of Rock Mechanics and Mining Sciences, 43(6), 894–904.
Hawkins, A. B., & McConnell, B. J. (1992). Sensitivity of sandstone strength and deformabilitu to changes in moisture content. Quarterly Journal of Engineering Geology and Hydrogeology, 25(2), 115–130.
Heerden, W. L. V. (1985). In situ determination of the dynamic moduli of elasticity of coal. International Journal of Rock Mechanics and Mining Sciences and Geomechanics Abstracts, 22(5), 339–343.
Huang, B. X., & Liu, J. W. (2013). The effect of loading rate on the behavior of samples composed of coal and rock. International Journal of Rock Mechanics and Mining Sciences, 61, 23–30.
Komurlu, E. (2018). Loading rate conditions and specimen size effect on strength and deformability of rock materials under uniaxial compression. International Journal of Geo-Engineering, 9, 1.
Li, J. G., & Liu, H. (2011). Application conditions on acoustic emission (AE) technique monitoring coal and rock dynamic disasters in mines. Advanced Materials Research, 413, 235–240.
Li, X. F., Wang, S. B., Malekian, R., Hao, S. Q., & Li, Z. X. (2016). Numerical simulation of rock breakage modes under confining pressures in deep mining: An experimental investigation. IEEE Access, 4, 5710–5720.
Liu, J. J., Gao, J. L., Zhang, X. B., Jia, G. N., & Wang, D. (2019). Experimental study of the seepage characteristics of loaded coal under true triaxial conditions. Rock Mechanics and Rock Engineering, 52(8), 2815–2833.
Meng, Q. B., Zhang, M. W., Han, L. J., Pu, H., & Nie, T. Y. (2016). Effects of acoustic emission and energy evolution of rock specimens under the uniaxial cyclic loading and unloading compression. Rock Mechanics and Rock Engineering, 49(10), 3873–3886.
Okubo, S., Fukui, K., & Qingxin, Q. (2006). Uniaxial compression and tension tests of anthracite and loading rate dependence of peak strength. International Journal of Coal Geology, 68(3–4), 196–204.
Qiu, S. L., Feng, X. T., Zhang, C. Q., & Xiang, T. B. (2014). Estimation of rockburst wall-rock velocity invoked by slab flexure sources in deep tunnels. Canadian Geotechnical Journal, 51(5), 520–539.
Solecki, R., & Conant, R. J. (2003). Advanced mechanics of materials. London: Oxford University Press.
Su, C. D., Guo, B. H., & Tang, X. (2013). Research on acoustic emission characteristics of zhangcun coal samples in two sizes subject to uniaxial compression. Journal of the China Coal Society, 38, 12–18.
Wang, C. L., Wu, A. X., Liu, X. H., & Li, R. (2009). Study on fractal characteristics of b value with microseismic activity in deep mining. Procedia Earth and Planetary Science, 1(1), 597.
Wang, L., Cheng, L. B., Cheng, Y. P., Yin, G. Z., Xu, C., Jin, K., et al. (2014). Characteristics and evolutions of gas dynamic disaster under igneous intrusions and its control technologies. Journal of Natural Gas Science and Engineering, 18, 164–174.
Wang, L., Cheng, Y. P., Xu, C., An, F. H., Jin, K., & Zhang, X. L. (2013a). The controlling effect of thick-hard igneous rock on pressure relief gas drainage and dynamic disasters in outburst coal seams. Natural Hazards, 66(2), 1221–1241.
Wang, S. G., Elsworth, D., & Liu, J. (2013b). Mechanical behavior of methane infiltrated coal: The roles of gas desorption, stress level and loading rate. Rock Mechanics and Rock Engineering, 46(5), 945–958.
Wen, G. C., Li, J. G., Ju, Y. H., & Lv, G. C. (2011). Preliminary study on the application conditions of acoustic emission monitoring dynamic disasters in coal and rock. Journal of China Coal Society, 36(2), 278–2825.
Xia, D., Yang, T. H., Wang, P. T., Zhang, P. H., & Zhao, Y. C. (2014). Experimental study of acoustic emission characteristics of dry and saturated rocks during cyclic loading and unloading process. Journal of the China Coal Society, 39(7), 1243–1247.
Yin, D. W., Chen, S. J., Xing, W. B., Huang, D. M., & Liu, X. Q. (2018). Experimental study on mechanical behavior of roof–coal pillar structure body under different loading rates. Journal of China Coal Society, 43(5), 1249–1257.
Yuan, C. F., Yuan, Z. J., Wang, Y. T., & Li, C. M. (2019). Analysis of the diffusion process of mining overburden separation strata based on the digital speckle correlation coefficient field. International Journal of Rock Mechanics and Mining Sciences, 119, 13–21.
Zhang, Z. Z., & Gao, F. (2015). Experimental investigation on the energy evolution of dry and water-saturated red sandstones. International Journal of Mining Science and Technology, 25(3), 383–388.
Zhang, Z. X., Kou, S. Q., Jiang, L. G., & Lindqvist, P. A. (2000). Effects of loading rate on rock fracture: Fracture characteristics and energy partitioning. Rock Mechanics and Mining Sciences, 37(5), 745–762.
Zhao, B., Wang, Z. Y., & Cui, Y. L. (2013). Effects of loading rate on strength and failure of coal rock from hancheng. Key Engineering Materials, 577–578, 589–592.
Zhao, Y. X., Liu, S. M., Zhao, G. F., Elsworth, D., Jiang, Y. D., & Han, J. L. (2014). Failure mechanisms in coal: Dependence on strain rate and microstructure. Journal of Geophysical Research Solid Earth, 119(9), 6924–6935.
Acknowledgements
This study is supported by the National Science and Technology Major Project of China (no. 2016ZX05045-004).
Author information
Authors and Affiliations
Corresponding author
Additional information
Publisher's Note
Springer Nature remains neutral with regard to jurisdictional claims in published maps and institutional affiliations.
Rights and permissions
About this article

Cite this article
Xiao, W., Zhang, D., Cai, Y. et al. Study on Loading Rate Dependence of the Coal Failure Process Based on Uniaxial Compression Test. Pure Appl. Geophys. 177, 4925–4941 (2020). https://doi.org/10.1007/s00024-020-02513-0
Received:
Revised:
Accepted:
Published:
Issue Date:
DOI: https://doi.org/10.1007/s00024-020-02513-0