
Abstract
Multicellular microtissues of primary human hepatocytes (PHHs) co-cultured with other supporting cell types are a promising model for drug screening and toxicological studies. However, these liver microtissues (LMs) rapidly lose their functions during ex vivo culture. Here, in order to mimic the cellular and structural hepatic microenvironment, we co-cultured PHHs with human mesenchymal stromal cells (MSCs) and human umbilical vein endothelial cells (HUVECs) in the presence of cell-sized microparticles (MPs) derived from liver extracellular matrix (LEMPs). The microwell culture platform enabled biofabrication of size-controlled multicellular microtissues (PHH:HUVEC:MSC = 3:2:1) with efficient LEMP incorporation (about 70% at a 2:1 ratio of cells:MP). The biofabricated liver microtissues (BLMs) were cultured ex vivo for 14 days and compared to the cell-only LM in terms of gene and protein expression, functional activity, cytochrome P450 (CYP450) enzyme inducibility, and drug sensitivity. The results supported superior hepatic-related gene expression, functional activity, and polarity for PHH in BLM compared to LM. CYP450 enzyme inducibility and dose-responsive sensitivity to toxic drugs were significantly higher in the BLM group. In conclusion, microtissue engineering by incorporation of tissue-specific microparticles within a multicellular microtissue can offer some advantages for drug discovery studies and cell transplantation applications. In the near future, this approach could generate a scalable platform of several functional biofabricated microtissues representing different organs.
Graphic abstract

Introduction
In vitro models that employ primary human hepatocytes (PHHs) are proven to provide more reliable results in predicting drug toxicity and disease modeling compared to hepatic cell lines and pluripotent stem cell-derived hepatocyte-like cells [1]. Although PHHs are considered the gold standard tool for drug screening and toxicity assays in a variety of culture platforms, the fact that they inevitably lose hepatocyte-specific features within a few hours after an ex vivo culture notably affects their applicability and efficacy [2]. Furthermore, the translation of in vitro results into predictable in vivo outcomes is problematic for the drug development industry. Updated methods that aim to maintain the primary characteristics in isolated PHHs commonly focus on hepatic microenvironment recapitulation by mimicking cell–cell and cell–matrix interactions [3, 4]. An ideal model would consider PHH interactions with the supporting stromal cells, extracellular matrix (ECM), and soluble factors [5, 6]. The cell–cell junctions and cell–matrix connections regulate PHH polarization, which is crucial for maintenance of functionality [7, 8]. Accordingly, several culture methods have been developed that maintain hepatic functions by mimicking the in vivo microenvironment via co-culture of PHHs with non-parenchymal cells under sandwich, spheroid, or microfluidic conditions [7, 9,10,11,12,13,14,15,16]. Bone marrow-derived mesenchymal stromal cells (BM-MSCs) and human umbilical vein endothelial cells (HUVECs) are two reliable and accessible cell sources for such applications. Paracrine factors secreted by MSCs and endothelial cells are critical for hepatocyte maintenance and maturation [17]. Cell–cell interactions with MSCs have an essential role in self-organization and condensation of three-dimensional (3D) multicellular cultures [17]. Salerno and colleagues reported a liver organotypic co-culture system that used PHH and HUVEC to preserve hepatic function for an extended period of time [15]. Such heterotypic cell contacts could improve albumin (ALB) secretion, urea synthesis, and drug biotransformation. In another study, immortalized PHHs were co-cultured with MSCs and liver sinusoidal endothelial cells using Upcyte® technology to generate functional liver organoid-like structures that preserved hepatic function for up to 10 days [16].
The co-culture of PHH in multicellular 3D aggregates benefits from both cell–cell interactions and scalability for mass production. However, long-term function of PHH is hampered by the lack of liver-specific ECM, which is an essential component to mimic critical cell–ECM interactions. Organ-specific ECM provides the proper biophysical and biochemical cues for physiologic function in different tissues [18]. Accordingly, ECM derived by tissue decellularization has been implemented as a tissue-specific substrate and is superior to collagen or Matrigel™ as a support for primary cell cultures [19].
In particular, PHHs maintained their normal morphology when cultured on intact or solubilized liver matrix in comparison with non-liver-derived ECM [20,21,22]. Hence, we hypothesized that PHH function could be maintained by enrichment of the microtissue environment with liver-derived ECM (LEM). Moving away from our established technique in generating hybrid hydrogels of alginate/LEM [23, 24], we encapsulated hepatocytes, MSCs, and HUVECs in size-controlled microcapsules in a scalable manner. Although the co-culture strategy and LEM were both effective in terms of preserving hepatocyte functions, cell migration was impaired by the dense network. Similarly, another challenge with the encapsulation strategy may be the limited diffusion and transport of endogenous and exogenous factors produced by a compact hydrogel network [25]. In order to overcome such limitations, we formulated the LEM as cell-sized microparticles (MPs), which could be incorporated within the liver microtissue (LM) during cell aggregation. By using microwell plates, homogenous 3D cell microtissues were fabricated with or without the liver ECM-derived MPs (LEMPs). Our results showed that the incorporation of LEMPs considerably improved functional properties and maintained hepatic functions for at least 14 days.
Materials and methods
Fabrication of liver ECM-derived MPs (LEMPs)
Decellularization of sheep liver tissue and LEM digestion were performed according to our previous report [23] with some modifications. Briefly, the frozen sheep liver was cut into 2-mm-thick pieces and washed five times in deionized water (dH2O). Next, the liver pieces were stirred in 1% sodium dodecyl sulfate (SDS, Sigma-Aldrich, 436,143) at 4 °C for 72 h. The SDS solution was subsequently refreshed every 24 h. Then, the samples were washed two times with dH2O and stirred in 1% Triton X-100 (Merck, Burlington, MA, USA, 108,643) for 30 min. The process was followed by a 48-h dH2O rinse to eliminate any remaining detergents and cellular fragments and achieve pure LEM. The resultant LEM was lyophilized and milled using a Christ lyophilizer (Alpha 1–2 LDplus, Osterode am Harz, Germany) and subsequently frozen until further use. Next, to prepare the gel precursor solution, the LEM powder was digested using 2% pepsin (Merck, P6887) in 0.5 M acetic acid (Sigma) and stirred with a magnetic stirrer at 4 °C for 48 h to produce a pre-gel solution at a concentration of 20 mg/mL [23]. Then, the w/o emulsion method was used to fabricate LEMPs (Fig. 1a). For this purpose, a homogeneous mixture of the LEM (20 mg/mL) and gelatin (50 mg/mL) solutions was obtained by stirring at 40 °C for 10 min. The homogeneous mixture (1 mL) was added into 80 mL of oil for homogenization at 7000 r/min for 5 min. Next, the emulsion was cooled for 1 h at 4 °C and cross-linked using a glutaraldehyde solution (0.2% w/w) at 700 r/min for 12 h in an ice bath. The cross-linked MPs were collected at 4000 r/min and washed twice with dH2O. The MP suspension was then passed through a 40-µm mesh to remove the larger MPs. The LEMPs were sterilized by treatment with 70% alcohol for 20 min.

Production and characterization of LEMPs. a Schematic illustration of MP production from LEM. b Phase contrast image. Scale bar: 100 μm. c SEM image of LEMP. Scale bar: 20 μm. d Size distribution of MPs. e Young’s modulus (E) of MPs measured by AFM. f Collagen content in microparticles, LEM gel, and intact liver. g Cell viability assay of MPs by 48-h culture with fibroblasts at different cell: MP ratios. ECM extracellular matrix, LEM liver extracellular matrix, LEMP liver ECM-derived MPs, SEM scanning electron microscopy, MP microparticle, LM liver microtissue, BLM biofabricated liver microtissue, AFM atomic force microscopy
Characterization of liver ECM-derived MPs (LEMPs)
Scanning electron microscopy (SEM) was used to evaluate the LEMP morphology. The sample was dehydrated and gold-coated using a sputter coater (MSP-1S, Shinku Device, Ibaraki, Japan) and subsequently visualized by SEM (VE-8800, Keyence, Tokyo, Japan). Size distribution was measured using ImageJ software, and the data were analyzed with Prism software. The morphology of the LEMPs was additionally viewed, and their Young’s modulus was measured by atomic force microscopy (AFM). The LEMPs were fixed on a Petri dish coated with poly-L-lysine. The AFM experiments were conducted with a Bruker Bioscope Resolve microscope (Bruker, USA) combined with an Axio Observer inverted optical microscope (Carl Zeiss, Germany) in phosphate-buffered saline (PBS) at room temperature, using triangular ScanAsyst-FLUID cantilevers with a nominal spring constant of 0.7 N/m, nominal frequency of 150 kHz, and nominal tip radius of 20 nm (Bruker, USA). The AFM imaging was performed in the PeakForce Tapping mode at a scan rate of 1 Hz and an image resolution of 512 × 512 pixels. The Young’s moduli E values were extracted from force curves obtained manually and monitored through the optical microscope over 10 different LEMPs. The force curves were acquired with a 2.5-µm vertical ramp distance and a 50-µm/s vertical piezo-speed. In order to calculate Young’s modulus, the extended part of a force curve was processed using the Hertz model and the initial 10% of the curve after the contact point was used for the fit in order to avoid the influence of the hard substrate. All of the image and force curve processing were performed using NanoScope Analysis software (Bruker, USA).
The collagen content of the decellularized liver, LEMPs, and intact liver was quantified using a colorimetric Sircol Biocolor Assay kit (Biocolor Ltd., Northern Ireland, UK). This assay is a dye-binding method designed to measure acid and pepsin-soluble collagens. The absorbance was measured at 550 nm using a microplate reader.
Human foreskin fibroblasts (HFFs) were cultured with the LEMPs at three cell:MP ratios (1:1, 1:3, and 1:10) for 48 h to examine the cytocompatibility of the LEMPs. Cell viability was assessed using the Orangu Viability kit (Cell Guidance Systems, OR01-500).
Toluidine blue (TB) and Masson trichrome (MT) staining
Toluidine blue (TB) and Masson trichrome (MT) staining were performed 14 days post-aggregation with routine protocols to, respectively, investigate glycosaminoglycans (GAGs) and collagen as the main components of the MPs.
Cell preparation and liver microtissue (LM) generation
HUVECs were isolated according to a previous report [26]. Briefly, the HUVECs were isolated from the umbilical cord of healthy newborns after receipt of informed consent from their parents. The umbilical vein was incubated with 1% collagenase (Gibco, 17,104–019), and the isolated cells were cultured and propagated in endothelial growth medium (Royan Endothelial Cell Medium) supplemented with 1% L-glutamine (Gibco, 25,030–024), 1% penicillin/streptomycin (Pen/Strep, Gibco, 15,070–063), 1% minimum essential medium (MEM) non-essential amino acids (Gibco, 11,140–035), and 10% fetal bovine serum (FBS, Gibco, 16,140–071) up to passage 4. MSCs were obtained from the Royan Stem Cell Bank (Iran). The cells were cultured up to passage 3 in Dulbecco’s modified Eagle medium/nutrient mixture F-12 (DMEM/F12) (Gibco) supplemented with 1% L-glutamine, 1% Pen/Strep, 1% MEM non-essential amino acids, and 15% FBS. Cryopreserved PHHs from three donors (Supplementary, Table S1) were thawed and suspended in 40 mL of William’s Medium E (Sigma-Aldrich, W-4125) and centrifuged at 50 g for 3 min at 4 °C. Next, the cells were resuspended in 25 mL of William’s Medium E. Then, 25 mL of 90% Percoll (Sigma-Aldrich, P-1644) solution in PBS was added to the tube and gently mixed. Subsequently, the suspended cells were gently added to the tube that contained Percoll and centrifuged at 90 g for 10 min at 4 °C. The dead cells were aspirated from the top of the gradient. In order to wash out the Percoll, the cell pellet was suspended in 30 mL of warm William’s Medium E; this step was repeated once. Finally, cell counts were conducted with a hemocytometer, and we assessed cell viability by Trypan blue staining. The PHHs were cultured in hepatocyte basal medium (HBM, Lonza, 17,104–019) supplemented with 1% L-glutamine, 1% Pen/Strep, 0.1% insulin (Lonza, CC-4321), 0.1% transferrin (Lonza, CC-4313BB), 2% bovine serum albumin-fatty acid free (BSA-FAF, Lonza, CC-4362BB), 0.1% hepatocyte growth factor (HGF), 0.1% ascorbic acid (Lonza, CC-4316BB), 0.1% gentamicin sulfate (GA, Lonza, CC-4381BB), 0.1% hydrocortisone (Lonza, CC-4335BB), 0.1% epithelial growth factor (rhEGF, Lonza, CC-4317BB), 100 nM dexamethasone (Dex, Sigma-Aldrich, D-2915), and 1% FBS.
In order to generate LM, a total of 900 000 viable cells that consisted of PHHs:HUVECs:MSCs at a 3:2:1 ratio were seeded per well of a 24-well plate (AggreWell ™ plate, 800 µm, Stem Cell Technology, 34,811) in a co-culture medium (Fig. 2a). The medium consisted of hepatocyte culture medium (HCM, Lonza, CC-4182), Royan endothelial medium, and DMEM/F12 in a 3:2:1 ratio, supplemented with 1% L-glutamine (Gibco, 25,030–024), 1% Pen/Strep (Gibco, 15,070–063), 10 ng/mL HGF, 100 nM Dex, and 1% FBS. Cell aggregation was observed with a phase-contrast microscope (Olympus, IX71, Tokyo, Japan). After 24 to 48 h, condensed microtissues had formed and were harvested through a 70-µm filter mesh. The microtissues were maintained in co-culture medium with 1% FBS for 14 additional days (up to day 14), with medium renewal every 48 h in the low-attachment dishes. The microtissue was measured using ImageJ software, and data were analyzed by Prism software.

Biofabrication of LM. a Schematic illustration of LM formation and MP incorporation. b Visual evaluation of microtissue formation after one-day culture of the cells in the presence of LEMPs at different ratios of cells to MPs (1:2, 1:1, and 2:1) in microwell plates. Scale bar: 200 μm. c Bright field and fluorescence images of biofabricated microtissues generated by FITC-labeled LEMPs at a cell:MP ratio of 2:1. Scale bar: 200 μm. d Phase contrast and fluorescence images of 14-day cultured microtissues after live/dead staining. Green: live cells; red: dead cells. Scale bar: 100 μm. e Size distribution of microtissues during the 14-day culture. MP microparticles, FITC fluorescein isothiocyanate, LM liver microtissue, LEMP liver ECM-derived MPs, PHH primary human hepatocytes, HUVEC human umbilical vein endothelial cells, MSC mesenchymal stromal cells
Incorporation of liver ECM-derived MPs (LEMPs) within liver microtissues (LMs)
In order to generate the MP-incorporated microtissues, the cell ratio and other conditions were identical to those for the cell-only microtissues, with the exception of the initial cell suspension that was mixed with a suspension of 1500 MPs prior to cell seeding onto the microwell plate. The MPs were labeled with fluorescein isothiocyanate (FITC) before the co-culture process to evaluate a successful incorporation. After co-culture, the supernatant was collected, and the FITC-labeled MPs were counted using a hemocytometer chamber. We measured the incorporation efficiency by comparing the number of MPs that failed to incorporate with the initial number of MPs in the co-culture.
We assessed cell viability of the microtissues after 14 days with the Live/Dead® Viability/Cytotoxicity Kit (Invitrogen, L3224). We added 0.2 µM calcein AM and 0.1 µM ethidium homodimer-1 to the microtissues in Hank’s balanced salt solution (HBSS) and incubated the microtissues for 30 min at room temperature. The microtissues were subsequently washed and visualized with a fluorescence microscope (Olympus, IX71).
Quantitative reverse transcriptase–polymerase chain reaction (qRT-PCR)
RNA extraction from snap-frozen samples was conducted using the RNeasy Mini Kit (Qiagen, 74,106, Venlo, The Netherlands). Equal amounts of RNA from each sample were used to synthesize cDNA using a PrimeScript™ Reverse Transcriptase Kit (Takara Bio, Inc., Kusatsu-Shi, Japan) according to the instructions from the manufacturer. Quantitative reverse transcriptase–polymerase chain reaction (qRT-PCR) was performed for hepatocyte-specific [27] and epithelial–mesenchymal transition (EMT) genes. Real-time PCR was performed using a real-time PCR system (Applied Biosystems StepOne instrument) with fast SYBR green® (Takara, RR820) and two technical replicates for each sample. The expression of markers in the biofabricated liver microtissues (BLM) was compared to the LM on days 7 and 14 relative to day 0 of the co-culture. The expression levels of these genes were normalized against glyceraldehyde-3-phosphate dehydrogenase (GAPDH). The analysis was performed by the comparative CT method (\(2^{{-{\Delta\Delta}c_{\rm T}}}\)). The primers used in this study are listed in Table S2 (supplementary information).
Immunostaining for hepatic, mesenchymal, and endothelial markers
On days 7 and 14, we performed immunostaining to determine the expression of hepatic-specific, mesenchymal, and endothelial markers in the microtissues. For this purpose, the microtissues were fixed in 4% paraformaldehyde, integrated in agar gel (2%), blocked in paraffin after processing, and subsequently sectioned into 6-µm slices [28]. The sections were incubated overnight with primary antibodies against human ALB (Bethyl A80-229A, 1:200), CYP3A4 (Santa Cruz, Dallas, TX, USA, sc53850, 1:50), HNF4α (Abcam, Ab41898), E-cadherin (E-cad; Santa Cruz, SC8426), ZO-1 (Abcam, Ab59720), CD31 (Abcam, Ab28364), and vimentin (Vim, Abcam, Ab128507) at 4 °C. This was followed by incubation with secondary antibodies for 1 h at 37 °C. The nuclei were counterstained with Hoechst 33,342 (Sigma-Aldrich). Finally, the slides were visualized with a fluorescent microscope (Olympus, IX71).
Immunofluorescent pictures were used to quantify CYP3A4 and ALB expression in the hepatocytes (i.e., after counting the nuclei, the number of positive cells for these proteins was divided by the total number of nuclei). For each protein, 10 distinct histological sections from three biological replicates were considered.
Albumin (ALB) and fibrinogen secretion and urea production
The conditioned media of the microtissues were collected on days 1, 7, and 14. The samples were assessed for ALB and fibrinogen secretion using an ALB-ELISA kit (Bethyl Laboratories, Montgomery, TX, USA, E88-129) and a Fibrinogen ELISA kit (GenWay Biotech, San Diego, CA, USA, 40–28,822,856) according to the manufacturers’ instructions. The urea level in the culture media was measured using a Colorimetric Assay kit (Pars Azmun, Tehran, Iran, 130,400) according to the manufacturer’s instructions.
Cytochrome P450 (CYP450) inducibility
On day 14, microtissues were pretreated with inducers for 72 h for enzyme induction assessment [29]. The inducers included phenobarbital (500 µM) for both CYP3A4 and CYP2B6, and rifampicin (25 µM) for CYP2C9. CYP450 activity was assessed with luminogenic P450Glo CYP450 Assay (Promega) kits (CYP3A4, V9002; CYP2B6, V8321; CYP2C9, V8791) according to the vendor’s instructions for nonlytic assays using cultured cells. Microtissues were incubated with luciferin-PFBE (CYP3A4, 1:40 dilution), luciferin-2B6 (CYP2B6, 1:1000 dilution), or luciferin-H (CYP2C9, 1:50 dilution) for 3 h. Medium samples were collected from each microtissue strainer, and luciferin metabolites were measured using a Synergy HTX MultiMode Microplate Reader (Biotek). The data that pertain to CYP enzyme induction are presented as fold changes relative to the basal activity of 1% dimethyl sulfoxide (DMSO), which was the vehicle control group.
Drug sensitivity assay
In the hepatotoxicity experiments, we exposed the microtissues from both groups to different medications for 48 h at different concentrations: diclofenac (Sigma-Aldrich, D6899); 5-fluorouracil (5-FU; Sigma-Aldrich, F6627); acetaminophen (APAP, Sigma-Aldrich, A7085); or tamoxifen (TAM, Sigma-Aldrich, T5648). All samples contained a final level of 0.8% v/v DMSO. After 48 h, the conditioned medium was removed and cell viability was assessed by Orangu™ kit (at 1:10 ratio, reagent:medium) added and incubated for 20 min at 37 °C and 5% CO2. After the incubation period, we assessed cell viability by measuring the absorbance at 450 nm using a microplate reader.
Periodic acid-Schiff (PAS) staining for glycogen storage
Glycogen storage in the microtissues was evaluated by periodic acid-Schiff (PAS) staining. The microtissue sections were oxidized in 1% periodic acid for 5 min and rinsed in distilled water. Next, the sections were covered with Schiff’s reagent for 10 min. The sections were immersed in running tap water for 5–10 min and visualized with a light microscope.
Indocyanine green (ICG) uptake and release
On day 14, the generated microtissues were incubated with 1 mg/mL indocyanine green (ICG) solution (CardioGreen; Sigma-Aldrich, 12,633) for 1 h in an incubator under standard conditions to assess ICG uptake. After taking micrographs to assess ICG release, we incubated the microtissues in fresh medium for 4 h and then took another set of micrographs.
Statistical analysis
Data are presented as mean ± SD. The data were analyzed by one-way and two-way ANOVA and Tukey’s post hoc test for differences between groups. The mean difference was considered statistically significant at p < 0.05.
Results
-
(a)
Production and characterization of liver ECM-derived MPs (LEMPs)
We forged decellularized liver tissue into MPs by chemical cross-linking of the droplet dispersion of gelatin/LEM (70/30 by weight) solution in a w/o emulsion (Fig. 1a). Phase contrast and SEM observation showed that the resultant MPs (Figs. 1b and 1c) were characterized by spherical shape and most (about 70%) had diameters of 8–12 μm (Fig. 1d). AFM revealed the presence of grains that had diameters of approximately 200–300 nm on the surface of the MPs (Fig. S1), which generated a root-mean-square (RMS) roughness of about 50 nm. Young’s moduli (E) of the MPs, measured by AFM, varied between individual particles in the range of 15–80 kPa (average: 33 ± 18 kPa) (Fig. 1e). In order to assess composition and collagen content in the MPs, we compared the collagen content in three groups (MP, LEM gel, and intact liver) with a colorimetric Sircol Biocolor Assay kit. Assessment of collagen content showed that MPs, like the LEM hydrogel, contained high amounts of collagen compared to the normal liver (Fig. 1f). In order to confirm bio-compatibility, we evaluated HFF viability at different cell:MP ratios (1:1, 1:3, and 1:10). There was no significant cytotoxicity observed (Fig. 1g).
After 14 days, both MT and TB staining indicated collagen and GAG precipitation in the BLM group, but not the LM group (Fig. S2). Therefore, the MPs could induce collagen and GAG secretion by co-cultured cells.
Taken together, these data confirmed that MPs lacked toxicity and could be highly incorporated with a homogenous distribution in the culture system.
-
(b)
Biofabrication of liver microtissues (LMs)
We investigated the possibility of microtissue formation in AggreWell plates. A mixture of single cells composed of PHH, HUVEC, and MSC at a 3:2:1 ratio was embodied with or without MP to generate BLM or LM, respectively (Fig. 2a). The MPs were added to the cell mixture prior to seeding onto the plates at different cell/MP ratios (2:1, 1:1, and 1:2) in order to determine the optimal ratio for cell condensation into 3D aggregates. The results showed that microtissue formation was effective only at a cell:MP ratio of 2:1 because cell condensation was hindered by the MPs at higher loadings (Fig. 2b), which was likely due to impaired cell–cell interactions in the presence of large amounts of MPs. We subsequently investigated the efficiency of MP incorporation within the formed microtissues. Quantification of unloaded MPs implied efficient incorporation of MPs into the microtissues (up to 75% ± 5%). FITC-labeled MPs were homogenously distributed throughout the microtissues (Figs. 2c and S3). Cell viability of the microtissues was not affected by MP incorporation. There was no significant cell death detected by the live/dead assay in either the LM or BLM groups (Fig. 2d). Notably, the viability of the microtissue was supported mainly by the supportive cells because there was massive cell death in the PHH-only hepatospheres (Fig. S4).
The microtissues were monitored for 14 days in a suspension culture to evaluate homogeneity and integrity over time. A large majority of microtissues (> 90%) were spherical and uniform in size (range 100–200 μm) (Fig. 2e). The morphological features did not significantly change during the 14-day period, which was probably the result of cell–cell and cell-ECM interactions (Fig. 2e).
-
(c)
Liver-specific and epithelial–mesenchymal transition (EMT) gene expression profile of liver microtissues (LMs)
We measured expression of hepato-specific genes to evaluate the impact of the MPs on the maintenance of microtissues during 14 days of culture. Measurement of alpha-fetoprotein (AFP) (a de-differentiation marker) indicated significant upregulation in the LM group and no significant change in AFP expression was detected in the BLM group. At the end of the 14 days, there was significantly greater AFP expression in the LM group compared to the BLM group (p ≤ 0.01). In addition, we observed that expression of the mature hepatocyte marker ALB was significantly higher in the BLM group compared to the LM group at days 7 and 14 (p ≤ 0.05) (Fig. 3). Analysis of additional liver-specific genes proved the expression of phase I/II enzymes and phase III transporters in both groups, with significantly higher expression in the BLM group compared to the LM group after 14 days of culture. This finding suggested that MP incorporation could support maintenance of liver-specific mature genes.
Next, we explored whether EMT occurred in the LM group via analysis of the genes involved in the EMT process. qRT-PCR data indicated significantly higher expressions of Ep-cam (p ≤ 0.001) and E-cad (p ≤ 0.01) epithelial markers in the BLM compared to the LM group at day 14. These data indicated that hepatocytes, the only epithelial cells in our construct, had better maintenance of their epithelioid phenotype in the presence of LEMPs. In line with this result, TGF-β, which induces EMT, downregulated in the BLM group compared to the LM group on day 14 (p ≤ 0.01) (Fig. 3). This analysis supported EMT prevention in the BLM group compared to the LM group. We also assessed other mesenchymal genes involved in EMT (N-cad, ZEB1, Twist, Vim, and MMP14). These genes expressed in both the BLM and LM groups, but with no significant differences (Fig. 3). These data could be attributed to the contribution of MSCs that typically express these mesenchymal genes. This result was predictable because MSCs contributed to our microtissues and they regularly expressed these genes. Therefore, the data suggested that MPs could support long-term maintenance of PHHs in microtissues through inhibition of EMT progression.
-
(d)
Immunostaining for hepatocytic proteins of liver microtissues (LMs)
Immunostaining revealed a homogenous pattern for expression of hepatocytic proteins ALB and CYP3A4 throughout both microtissue groups (Fig. 4a). Approximately 40% of the cells were ALB-positive in both the BLM and LM groups on day 7. The proportion of ALB-positive cells remained unchanged in the BLM group after 14 days but decreased up to about 10% in the LM group on day 14 (p ≤ 0.01). The quantified data showed significantly greater CYP3A4 expression in the BLM group on days 7 and 14 (p ≤ 0.05) (Fig. 4a). The expression and membranous localization of E-cad were further confirmed by immunostaining in the BLM and LM groups (Fig. S5). Co-expression of HNF4α, a nuclear marker for hepatocytes, in double-staining with ALB was detected in the BLM and LM groups on day 14. The data showed that this marker was better preserved in the BLM group compared to the LM group (Fig. 4b).
We observed that ZO-1 expression, as a polarity marker, robustly upregulated in the BLM group compared to the other group on days 7 and 14 (Fig. 4c). In order to determine spatial distribution of the endothelial cells, we assessed CD31 expression on day 14. Interestingly, we found that the endothelial cells had a tubular morphology in sections stained for CD31 in the BLM (Fig. 4d). Double-staining of CD31 and ALB showed that this marker was robustly expressed in the BLM group compared to the LM group. In order to understand the localization of MSCs in microtissues, we investigated the expression of the vimentin marker. We noted that vimentin was expressed during the culture period, particularly in the peripheral zone of microtissues in both groups (Fig. 4d).
-
(e)
Functional assessment of liver microtissues (LM)
In order to assess the performance of microtissues in long-term experiments, we characterized the hepatic function over 14 days in culture. ALB and fibrinogen secretion and urea production showed significantly higher functional levels after 14 days of culture in the BLM compared to the LM group (Fig. 5a; p ≤ 0.05, p ≤ 0.01, and p ≤ 0.05, respectively). These data indicated that the basic functions of PHH were maintained for at least 14 days during the ex vivo culture in LEMP-incorporated microtissues. CYP450 inducibility was measured by the pentoxyresorufin-o-deethylase (PROD) test on 14-day cultured microtissues in order to evaluate enzyme activity (Fig. 5b). CYP3A4 and CYP2B6 were induced by phenobarbital, and CYP2C9 was induced by rifampicin. There was no significant difference observed in inducibility of CYP3A4 in the LM and BLM groups. However, the inducibility of CYP2B6 and CYP2C9 was significantly higher in the BLM compared to the LM group (p ≤ 0.05). We also evaluated drug sensitivity of the 14-day cultured microtissues. In vitro drug toxicity was assessed after 48 h of exposure to different doses of APAP, TAM, 5-FU, and diclofenac (Fig. 5c). The BLM group showed a higher dose–response sensitivity to the four toxic drugs compared to the LM group. PAS staining of the 14-day cultured microtissues revealed higher glycogen storage in the BLM compared to the LM group (Fig. 5d). In both groups, the integrity of microtissue structure was confirmed by H&E staining (Fig. 5d). Furthermore, the BLM group had higher uptake of organic anion ICG, followed by its complete release over time (Fig. 5e). Together, the data showed that PHHs had better maintenance of their functionality when the LMs were supplemented with LEMPs.
Fig. 3 
Gene expression profile of LM. qRT-PCR analysis for expression of hepatocyte-specific and EMT genes. All gene expression fold changes were determined relative to the expression of three cell types on day 0 of culture with normalization against GAPDH expression by the \(2^{{-{\Delta\Delta}c_{\rm T}}}\) method. Data were analyzed using ANOVA followed by Tukey’s post hoc test. (n = 3, *P < 0.05, **P < 0.01, and ***P < 0.001). LM liver microtissue, EMT epithelial–mesenchymal transition, AFP alpha-fetoprotein, ALB albumin, CYP3A4 cytochrome P450 3A4, CYP2C9 cytochrome P450 2C9, CYP2B6 cytochrome P450 2B6, TDO2 tryptophan 2,3-dioxygenase, UGT2B15 UDP glucuronosyltransferase family 2 member B15, UGT2B7 UDP glucuronosyltransferase family 2 member B7, CPS1 carbamoyl-phosphate synthase 1, MDR1 multi-drug resistance-1, MRP2 multi-drug resistance-2, AQP7 aquaporin 7, Ep-cam epithelial cell adhesion molecule, E-cad epithelial cadherin, TGF-β transforming growth factor beta-1, N-cad neural cadherin, Vim vimentin, ZEB1 zinc finger E-box binding homeobox 1, MMP14 matrix metalloproteinase-14
Fig. 4 
Immunofluorescence staining of LMs and BLMs for ALB and CYP3A4 (quantification shown on the right) (a), HNF4α (b), ZO-1 (c), and CD31 and Vim (d) markers. The nuclei were counterstained with Hoechst (blue). Scale bar: 50 μm. LM liver microtissue, BLM biofabricated liver microtissue, ALB albumin, CYP3A4 cytochrome P450 3A4, Vim vimentin
Fig. 5 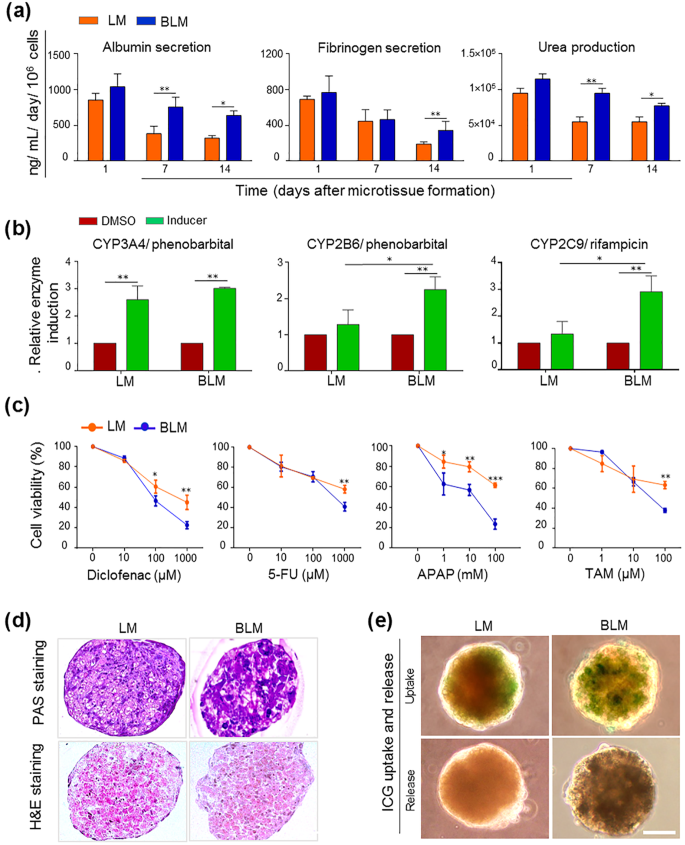
Functional activities of LM. a ALB and fibrinogen secretion and urea production of LMs and BLMs on days 1, 7, and 14. b CYP450 inducibility of the 14-day cultured microtissues. c Enzyme sensitivity of the 14-day cultured microtissues after incubation with four drugs: APAP, TAM, 5-FU, and diclofenac. d Glycogen accumulation in the 14-day cultured microtissues visualized using PAS staining (upper panel) and H&E staining (lower panel). Scale bar: 50 μm. e Uptake and release of ICG in the 14-day cultured microtissues. Scale bar: 50 μm. Data are presented as mean ± SD (n = 3). Data were analyzed using ANOVA followed by Tukey’s post hoc test (n = 3, *P < 0.05, **P < 0.01, and ***P < 0.001). LM liver microtissue, ALB albumin, BLM biofabricated liver microtissue, APAP acetaminophen, TAM tamoxifen, 5-FU: 5-fluorouracil, PAS periodic acid-Schiff


Discussion
Cell-based in vitro liver tissue models could be promising tools to predict liver toxicity, which is usually observed after chronic exposure of hepatocytes to different components. These models require optimization of in vitro culture conditions for long-term culture of PHHs [30]. The conventional two-dimensional (2D) monolayer culture of PHH is considered the gold standard model for predicting drug toxicity in vitro; however, PHHs de-differentiate and rapidly lose hepatocyte-specific functions within a few days under these oversimplified conditions [31]. In the native tissue, hepatocytes have connections with ECM at the basolateral sides and are connected with each other and with non-parenchymal cells through the apical side [8]. These cell–cell and cell–ECM interactions can be partially achieved by 2D cultures.
Numerous studies have shown that the metabolic activity of hepatocytes is better maintained by 3D contact with ECM [32]. The most frequently used 3D culture models for hepatocytes are a sandwich culture between two ECM layers and cell encapsulation into hydrogels. Of these two models, the hydrogel-based encapsulation approach enables upscaling to mass production [33]. However, using ECM or collagen as encapsulating hydrogels for PHH culture may generate problems. For instance, cell migration could be restricted by the surrounding hydrogel network. In addition, the nutrient supply and transport of soluble factors could be limited by the hydrogel mesh size, especially under static culture conditions [34,35,36,37]. To avoid these limitations and provide efficient cell–ECM interactions in 3D cell aggregates, Yamada and colleagues fabricated cell-sized collagen MPs by using a microfluidic emulsification device and incorporated them within rat hepatospheres. They showed that the expression of hepatocyte-specific genes such as ALB and ornithine transcarbamylase significantly increased in hepatocytes when cultured with MPs at a 1:1 ratio compared to hepatocytes that were cultured alone or at higher ratios of MPs. They showed that incorporation of MPs at higher cell:MP ratios had detrimental effects due to the limited cell–cell contacts in the presence of particle spacers [38]. In another study, different sizes of collagen-based MPs were evaluated to assess the success of their incorporation in PHH aggregates. Only the cell-sized MPs facilitated aggregation of PHHs and were incorporated into the hepatospheres. These MP-incorporated cell aggregates showed improved liver-specific functions such as ALB secretion and ammonia clearance [39, 40].
Although incorporation of MPs to enrich the microenvironment of 3D hepatospheres with ECM proteins such as collagen-supported hepatocyte functions well, some modifications to the cellular and protein composition could be beneficial to further recapitulate the native hepatocytic niche. Collagen MPs provide essential ligands for efficient adherence of hepatocytes, but do not completely represent the complex composition of the liver ECM. The original liver ECM contains type I collagen as the main component as well as fibronectin and collagen types III, IV, V, and VI, all of which are essential for hepatic function and preservation of the original liver cell phenotype [41, 42]. On the other hand, hepatocyte interaction with non-parenchymal liver cells is crucial to support their functionality during in vitro culture [43]. In the present study, we have demonstrated the application of LEMPs to support PHH functionality in a 3D co-culture with human MSCs and HUVECs. The strategy of producing LM by a co-culture of hepatocytes with MSCs and HUVECs originated from a pioneering study by Takebe et al. in 2013 [44]. These two cell types provide soluble factors and cell–cell interactions that are important for cell condensation to form 3D microtissues and promote hepatic differentiation and maturation [17].
In order to provide 3D cell–ECM interactions, we previously co-cultured the three cell types as single cells within LEM gel and showed the supportive effects of the LEM-derived hydrogel [23]. This strategy effectively provided 3D cell–ECM interactions; however, 3D cell–cell contact was not completely achieved, as only a few cells could form heterogeneous 3D aggregates due to limited cell migration within the hydrogel. The use of LEM gel in the form of cell-sized MPs inside cell aggregates could be superior to the alternative strategy of aggregate encapsulation inside LEM gel. First, MP incorporation during cell aggregation allows for scalable generation of size-controlled cell aggregates.
The MP incorporation approach provides more homogenous cell–ECM interactions throughout the 3D microtissue because the MPs can be uniformly distributed within the microtissue compared to the encapsulation strategy, where only the peripheral cells interact with the LEM gel. The cell dilution effect of the incorporated MPs could lead to more efficient and homogeneous diffusion of exogenous and endogenous factors throughout the 3D cell aggregate [45]. The use of LEM as MPs enables free cell movement and organization within the microtissue and growth of the microtissues, as they are not confined within a surrounding matrix. In addition, the MP incorporation approach allows for control of cell–cell and cell–ECM interactions to generate a balance of these interactions by adjusting the cell:MP ratio. Finally, MPs could be used as an engineering tool to regulate the microenvironment of the cell aggregate via their own biophysical and biochemical properties or delivery of soluble factors [46].
We developed a simple w/o emulsion method to produce cell-sized MPs from digested decellularized liver tissue. Liver LEMPs were produced with a homogenous size distribution (10 ± 6 µm) in the optimal range for incorporation in cell aggregates [38] and a suitable elastic modulus (33 ± 18 kPa). The stiffness of the microenvironment has a significant impact on cellular behaviors like polarity and function [47]. Normal liver has an elastic modulus (E) below 6000 Pa [48,49,50]. Many studies have shown that the natural behavior of cells is influenced by stiffer scaffolds. For example, it has been reported that ALB synthesis was elicited when the elastic modulus of polyethylene glycol-heparin was 10 kPa [47].
When single cells were mixed during aggregation, the MPs allowed for microtissue formation up to a cell:MP ratio of 2:1 and they were effectively incorporated within the microtissues (about 80%). The microwell plates, when used as a culture platform, enabled scalable and size-controlled production of a large number of 3D microtissues (7200 microtissues/plate), which were identical in size (150 ± 50 µm). Their size homogeneity was maintained during the subsequent 14-day culture in suspension. When proliferating cells used in 3D culture, the cells located in the external layers show more proliferation, whereas the internal cells in the core area might be quiescent or even necrotic because of limitations in diffusion of O2 and nutrients [51].
Generally, cell-permeable probes such as calcein-AM are used to stain cells for live/dead assay. Membrane-impermeable vital DNA dyes are used to stain dead cells and can eventually diffuse into the core of the microtissue; however, this may take a few hours [52]. The optimal incubation period should ensure a homogenous diffusion pattern through the microtissue. Weak emitted fluorescence signals in the core of the microtissue might be due to the less viable cells or decreased metabolism of cells in the core [51]. However, the live/dead assay showed viable cells in the internal parts of the microtissues.
During the 14-day in vitro culture, there was significant upregulation of the liver-specific genes and proteins at the mRNA and protein levels upon MP incorporation. The expressions of epithelial markers E-cad and ZO-1, as key proteins for cell polarity, were significantly higher in the BLM compared to the LM group, which suggested that the cells preserved a more polarized phenotype in the presence of MPs during the 14-day culture. This observation was further supported by downregulation of TGF-β, which is the inducer of EMT [53]. Hepatocyte dedifferentiation through EMT phenomenon is a reversible phenomenon that usually happens in the absence of a specific signaling network triggered by the ECM. It has been shown that hepatocytes cultured on a monolayer of collagen dedifferentiated and lost specific liver functions, while the application of a collagen sandwich maintained the cuboidal shape of hepatocytes for long periods of time. This study showed that matrix-induced EMT was reversible after changing the microenvironment of the cells [54]. Therefore, it seems that EMT progression is inhibited by providing more pronounced cell–ECM interactions in the presence of LEMPs.
This model improved the ex vivo maintenance of hepatocytes and activity of specific CYP450 for a more extended period (at least 14 days) compared to cultures on Matrigel or collagen gels (7 days) [55, 56]. After 14 days of co-culture, secretions of ALB, fibrinogen, and urea production were significantly higher in the MP-incorporated microtissues compared to the cell-only microtissues. Only the MP-incorporated microtissues showed CYP2B6 and CYP2C9 activity after induction with phenobarbital and rifampicin.
3D liver models have shown sensitivity and specificity in detecting hepatotoxicity [57,58,59].
We found that the MP-incorporated microtissues were more susceptible to toxic secondary metabolites and hepatotoxins compared to the cell-only microtissues. Overall, the results showed that MP incorporation improved the functionality of hepatocytes in BLM and maintained the key functional properties at acceptable levels for at least 14 days.
Conclusions
In this study, we aimed to develop a scalable method for in vitro maintenance of functional PHHs by recapitulating 3D cell–cell and cell–ECM interactions from native liver tissue. To this end, we produced size-controlled multicellular aggregates by co-culturing PHH with MSC and HUVEC (3:2:1 cell ratio) in microwell plates. LEM was formulated with cell-sized MPs that were incorporated within the LM (2:1 cell:MP ratio) during cell aggregation. This bioengineered LM had acceptable levels of essential hepatic features and functions during the 14-day culture. Nevertheless, future investigations are needed to provide more details about hepatocyte functionality and bile canaliculi development and functions. This in vitro model should be optimized to improve the maintenance of hepatocyte function for extended periods of time, which is essential for repeated drug exposure tests and chronic toxicity studies.
References
Fraczek J, Bolleyn J, Vanhaecke T et al (2013) Primary hepatocyte cultures for pharmaco-toxicological studies: at the busy crossroad of various anti-dedifferentiation strategies. Arch Toxicol 87:577–610. https://doi.org/10.1007/s00204-012-0983-3
Vinken M, Vanhaecke T, Rogiers V (2012) Primary hepatocyte cultures as in vitro tools for toxicity testing: quo vadis? Toxicol In Vitro 26:541–544. https://doi.org/10.1016/j.tiv.2012.01.002
Heydari Z, Najimi M, Mirzaei H et al (2020) Tissue engineering in liver regenerative medicine: insights into novel translational technologies. Cells 9:304. https://doi.org/10.3390/cells9020304
Zahmatkesh E, Khoshdel-Rad N, Mirzaei H et al (2021) Evolution of organoid technology: lessons learnt in Co-Culture systems from developmental biology. Dev Biol. https://doi.org/10.1016/j.ydbio.2021.03.001
Heydari Z, Vosough M (2017) New platforms for drug screening and toxicology: necessity or need? Mod Med Lab J 1:107–109. https://doi.org/10.30699/mmlj17.1.3.107
Friedman SL, Roll FJ, Boyles J et al (1985) Hepatic lipocytes: the principal collagen-producing cells of normal rat liver. PNAS 82:8681–8685. https://doi.org/10.1073/pnas.82.24.8681
Godoy P, Hewitt NJ, Albrecht U et al (2013) Recent advances in 2D and 3D in vitro systems using primary hepatocytes, alternative hepatocyte sources and non-parenchymal liver cells and their use in investigating mechanisms of hepatotoxicity, cell signaling and ADME. Arch Toxicol 87:1315–1530. https://doi.org/10.1007/s00204-013-1078-5
Vinken M, Papeleu P, Snykers S et al (2006) Involvement of cell junctions in hepatocyte culture functionality. Crit Rev Toxicol 36:299–318. https://doi.org/10.1080/10408440600599273
Bell CC, Hendriks DF, Moro SM et al (2016) Characterization of primary human hepatocyte spheroids as a model system for drug-induced liver injury, liver function and disease. Sci Rep 6:25187. https://doi.org/10.1038/srep25187
Khetani SR, Bhatia SN (2008) Microscale culture of human liver cells for drug development. Nat Biotechnol 26:120. https://doi.org/10.1038/nbt1361
Swift B, Pfeifer ND, Brouwer KL (2010) Sandwich-cultured hepatocytes: an in vitro model to evaluate hepatobiliary transporter-based drug interactions and hepatotoxicity. Drug Metab Rev 42:446–471. https://doi.org/10.3109/03602530903491881
Vernetti LA, Senutovitch N, Boltz R et al (2016) A human liver microphysiology platform for investigating physiology, drug safety, and disease models. Exp Biol Med 241:101–114. https://doi.org/10.1177/1535370215592121
Vildhede A, Mateus A, Kha EK et al (2016) Mechanistic modeling of pitavastatin disposition in sandwich-cultured human hepatocytes: a proteomics-informed bottom-up approach. Drug Metab Dispos 44:505–516. https://doi.org/10.1124/dmd.115.066746
Baze A, Parmentier C, Hendriks DF et al (2018) Three-dimensional spheroid primary human hepatocytes in monoculture and coculture with nonparenchymal cells. Tissue Eng C Methods 24:534–545. https://doi.org/10.1089/ten.tec.2018.0134
Salerno S, Campana C, Morelli S et al (2011) Human hepatocytes and endothelial cells in organotypic membrane systems. Biomaterials 32:8848–8859. https://doi.org/10.1016/j.biomaterials.2011.08.004
Ramachandran SD, Schirmer K, Münst B et al (2015) In vitro generation of functional liver organoid-like structures using adult human cells. PLoS ONE 10:e0139345. https://doi.org/10.1371/journal.pone.0139345
Asai A, Aihara E, Watson C et al (2017) Paracrine signals regulate human liver organoid maturation from induced pluripotent stem cells. Development 144:1056–1064. https://doi.org/10.1242/dev.142794
Muncie JM, Weaver VM (2018) The physical and biochemical properties of the extracellular matrix regulate cell fate. Curr Top Dev Biol 130:1–37. https://doi.org/10.1016/bs.ctdb.2018.02.002
Hansen KC, Kiemele L, Maller O et al (2009) An in-solution ultrasonication-assisted digestion method for improved extracellular matrix proteome coverage. Mol Cell Proteom 8:1648–1657. https://doi.org/10.1074/mcp.m900039-mcp200
Baptista PM, Siddiqui MM, Lozier G et al (2011) The use of whole organ decellularization for the generation of a vascularized liver organoid. Hepatology 53:604–617. https://doi.org/10.1002/hep.24067
Skardal A, Smith L, Bharadwaj S et al (2012) Tissue specific synthetic ECM hydrogels for 3-D in vitro maintenance of hepatocyte function. Biomaterials 33:4565–4575. https://doi.org/10.1016/j.biomaterials.2012.03.034
Nakamura S, Ijima H (2013) Solubilized matrix derived from decellularized liver as a growth factor-immobilizable scaffold for hepatocyte culture. J Biosci Bioeng 116:746–753. https://doi.org/10.1016/j.jbiosc.2013.05.031
Saheli M, Sepantafar M, Pournasr B et al (2018) Three-dimensional liver-derived extracellular matrix hydrogel promotes liver organoids function. J Cell Biochem 119:4320–4333. https://doi.org/10.1002/jcb.26622
Darakhshan S, Pour AB, Kowsari-Esfahan R et al (2020) Generation of scalable hepatic micro-tissues as a platform for toxicological studies. Tissue Eng Regen Med 17:459–475. https://doi.org/10.1007/s13770-020-00272-6
Ruoß M, Vosough M, Königsrainer A et al (2020) Towards improved hepatocyte cultures: progress and limitations. Food Chem Toxicol 138:111188. https://doi.org/10.1016/j.fct.2020.111188
Jaffe EA, Nachman RL, Becker CG et al (1973) Culture of human endothelial cells derived from umbilical veins. Identification by morphologic and immunologic criteria. J Clin Investig 52:2745–2756. https://doi.org/10.1172/jci107470
Zabulica M, Srinivasan RC, Vosough M et al (2019) Guide to the assessment of mature liver gene expression in stem cell-derived hepatocytes. Stem Cells Dev 28:907–919. https://doi.org/10.1089/scd.2019.0064
Vosough M, Omidinia E, Kadivar M et al (2013) Generation of functional hepatocyte-like cells from human pluripotent stem cells in a scalable suspension culture. Stem Cells Dev 22:2693–2705. https://doi.org/10.1089/scd.2013.0088
Gramignoli R, Tahan V, Dorko K et al (2014) Rapid and sensitive assessment of human hepatocyte functions. Cell Transplant 23:1545–1556. https://doi.org/10.3727/096368914x680064
Collins SD, Yuen G, Tu T et al (2019) In vitro models of the liver: disease modeling, drug discovery and clinical applications. Exon Publ 3:47–67
Schutte M, Fox B, Baradez MO et al (2011) Rat primary hepatocytes show enhanced performance and sensitivity to acetaminophen during three-dimensional culture on a polystyrene scaffold designed for routine use. ASSAY Drug Dev Technol 9:475–486. https://doi.org/10.1089/adt.2011.0371
Schyschka L, Sánchez JM, Wang Z et al (2013) Hepatic 3D cultures but not 2D cultures preserve specific transporter activity for acetaminophen-induced hepatotoxicity. Arch Toxicol 87:1581–1593. https://doi.org/10.1007/s00204-013-1080-y
Bachmann A, Moll M, Gottwald E et al (2015) 3D cultivation techniques for primary human hepatocytes. Microarrays 4:64–83. https://doi.org/10.3390/microarrays4010064
Ruoß M, Häussling V, Schügner F et al (2018) A standardized collagen-based scaffold improves human hepatocyte shipment and allows metabolic studies over 10 days. Bioengineering 5:86. https://doi.org/10.3390/bioengineering5040086
Ranucci CS, Kumar A, Batra SP et al (2000) Control of hepatocyte function on collagen foams: sizing matrix pores toward selective induction of 2-D and 3-D cellular morphogenesis. Biomaterials 21:783–793. https://doi.org/10.1016/s0142-9612(99)00238-0
Jain E, Damania A, Shakya AK et al (2015) Fabrication of macroporous cryogels as potential hepatocyte carriers for bioartificial liver support. Colloids Surf B Biointerfaces 136:761–771. https://doi.org/10.1016/j.colsurfb.2015.10.012
Kumari J, Kumar A (2017) Development of polymer based cryogel matrix for transportation and storage of mammalian cells. Sci Rep 7:41551. https://doi.org/10.1038/srep41551
Yamada M, Hori A, Sugaya S et al (2015) Cell-sized condensed collagen microparticles for preparing microengineered composite spheroids of primary hepatocytes. Lab Chip 15:3941–3951. https://doi.org/10.1039/c5lc00785b
Ajoudanian M, Enomoto K, Tokunaga Y et al (2019) Self-organization of hepatocyte morphogenesis depending on the size of collagen microbeads relative to hepatocytes. Biofabrication 11:035007. https://doi.org/10.1088/1758-5090/ab145d
Heidariyan Z, Ghanian MH, Ashjari M et al (2018) Efficient and cost-effective generation of hepatocyte-like cells through microparticle-mediated delivery of growth factors in a 3D culture of human pluripotent stem cells. Biomaterials 159:174–188. https://doi.org/10.1016/j.biomaterials.2018.01.005
O’Brien MP, Carnes ME, Page RL et al (2016) Designing biopolymer microthreads for tissue engineering and regenerative medicine. Curr Stem Cell Rep 2:147–157. https://doi.org/10.1007/s40778-016-0041-9
Martinez-Hernandez A, Amenta PS (1993) The hepatic extracellular matrix. Virchows Arch A 423:77–84. https://doi.org/10.1007/BF01606580
Bhatia S, Balis U, Yarmush M et al (1999) Effect of cell–cell interactions in preservation of cellular phenotype: cocultivation of hepatocytes and nonparenchymal cells. FASEB J 13:1883–1900. https://doi.org/10.1096/fasebj.13.14.1883
Takebe T, Sekine K, Enomura M et al (2013) Vascularized and functional human liver from an iPSC-derived organ bud transplant. Nature 499:481–484. https://doi.org/10.1038/nature12271
Ravindran S, Roam JL, Nguyen PK et al (2011) Changes of chondrocyte expression profiles in human MSC aggregates in the presence of PEG microspheres and TGF-β3. Biomaterials 32:8436–8445. https://doi.org/10.1016/j.biomaterials.2011.07.056
Sj K, Kim EM, Yamamoto M et al (2020) Engineering multi-cellular spheroids for tissue engineering and regenerative medicine. Adv Healthc Mater 9:2000608. https://doi.org/10.1002/adhm.202000608
You J, Park SA, Shin DS et al (2013) Characterizing the effects of heparin gel stiffness on function of primary hepatocytes. Tissue Eng A 19:2655–2663. https://doi.org/10.1089/ten.tea.2012.0681
Mederacke I, Wursthorn K, Kirschner J et al (2009) Food intake increases liver stiffness in patients with chronic or resolved hepatitis C virus infection. Liver Int 29:1500–1506. https://doi.org/10.1111/j.1478-3231.2009.02100.x
Desai SS, Tung JC, Zhou VX et al (2016) Physiological ranges of matrix rigidity modulate primary mouse hepatocyte function in part through hepatocyte nuclear factor 4 alpha. Hepatology 64:261–275. https://doi.org/10.1002/hep.28450
Chen AA, Khetani SR, Lee S et al (2009) Modulation of hepatocyte phenotype in vitro via chemomechanical tuning of polyelectrolyte multilayers. Biomaterials 30:1113–1120. https://doi.org/10.1016/j.biomaterials.2008.10.055
Riss T, Trask OJ (2021) Factors to consider when interrogating 3D culture models with plate readers or automated microscopes. Vitro Cell Dev Biol Anim 57:238–256. https://doi.org/10.1007/s11626-020-00537-3
Sirenko O, Mitlo T, Hesley J et al (2015) High-content assays for characterizing the viability and morphology of 3D cancer spheroid cultures. ASSAY Drug Dev Technol 13:402–414. https://doi.org/10.1089/adt.2015.655
Xu J, Lamouille S, Derynck R (2009) TGF-β-induced epithelial to mesenchymal transition. Cell Res 19:156–172. https://doi.org/10.1038/cr.2009.5
Godoy P, Hengstler JG, Ilkavets I et al (2009) Extracellular matrix modulates sensitivity of hepatocytes to fibroblastoid dedifferentiation and transforming growth factor β–induced apoptosis. Hepatology 49:2031–2043. https://doi.org/10.1002/hep.22880
LeCluyse EL (2001) Human hepatocyte culture systems for the in vitro evaluation of cytochrome P450 expression and regulation. Eur J Pharm Sci 13:343–368. https://doi.org/10.1016/s0928-0987(01)00135-x
Hewitt NJ, Gómez Lechón MJ, Houston JB et al (2007) Primary hepatocytes: current understanding of the regulation of metabolic enzymes and transporter proteins, and pharmaceutical practice for the use of hepatocytes in metabolism, enzyme induction, transporter, clearance, and hepatotoxicity studies. Drug Metab Rev 39:159–234. https://doi.org/10.1080/03602530601093489
Messner S, Agarkova I, Moritz W et al (2013) Multi-cell type human liver microtissues for hepatotoxicity testing. Arch Toxicol 87:209–213. https://doi.org/10.1007/s00204-012-0968-2
Kostadinova R, Boess F, Applegate D et al (2013) A long-term three dimensional liver co-culture system for improved prediction of clinically relevant drug-induced hepatotoxicity. Toxicol Appl Pharmacol 268:1–16. https://doi.org/10.1016/j.taap.2013.01.012
Jiang J, Messner S, Kelm J et al (2019) Human 3D multicellular microtissues: an upgraded model for the in vitro mechanistic investigation of inflammation-associated drug toxicity. Toxicol Lett 312:34–44. https://doi.org/10.1016/j.toxlet.2019.05.004
Acknowledgements
This project was financially supported by Grants from Royan Institute (No. 96000165) to MV and HB; Bahar Tashkhis Teb Co. (Nos. BTT, 9702, and 9802), Iran National Science Foundation (No. 97014445) to MV; the Ministry of Health and Medical Education (No. 56700/147) to HB. We would like to express our sincere gratitude to colleagues in Royan Institute, Regenerative Medicine Department.
Author information
Authors and Affiliations
Contributions
ZH performed the experiments, collected the data, conducted the data analysis and interpretation, and wrote the manuscript. IZ, MG, MA, SK, EZ, ZF, AP, IA, AS, RG, and PT helped in some experiments and analysis for the results, data management and statistical analysis and made final approval of the manuscript. HB and MV generated the concept, designed the study, supported the study and involved in writing and critical editing and proofreading the manuscript.
Corresponding author
Ethics declarations
Conflict of interest
The authors declare that there is no conflict of interest.
Ethical approval
This project was approved by Ethics Committee, Royan Institute. The approval code number is IR.ACECR.ROYAN.REC.1397.044. All institutional and national guidelines for the care and use of laboratory animals were followed.
Supplementary Information
Below is the link to the electronic supplementary material.
Rights and permissions
About this article

Cite this article
Heydari, Z., Zarkesh, I., Ghanian, MH. et al. Biofabrication of size-controlled liver microtissues incorporated with ECM-derived microparticles to prolong hepatocyte function. Bio-des. Manuf. 4, 790–805 (2021). https://doi.org/10.1007/s42242-021-00137-4
Received:
Accepted:
Published:
Issue Date:
DOI: https://doi.org/10.1007/s42242-021-00137-4