
Abstract
The main problem in the Content based image retrieval is “semantic gap”. A human match two images related to its semantics, while a retrieval system do the same process based on comparison of feature vectors corresponding to visual image features. The problem in retieval of images is identifying its unique features. This article proposes three different methods to retrieve images based on the unique features of an image and also evaluates the retrieval system performance. The first approach called Surrounding information retrieval (SIR) extracts the features related to the similarities of the neighborhood intensity values. The second approach Minimum edge retrieval (MER) identifies the minimum intensity value of each block. The third approach integrated feature retrieval (IFR) combines the properties of feature extraction from SIR and MER. The extracted unique features are stored in a feature dataset and the similar images are retrieved by comparing the dataset using distance measure. The performance of retrieval system is calculated in terms of its recall and precision. The precision and recall values are superior than the existing methods. The method IFR with multi feature extraction shows good in retrieval accuracy compared with other methods.
1 Introduction
With the progression in the image attainment technology and data storage. A huge number of images are created and stored continuously. It is very challenging task to retrieve the relevant image from such a pile of images. The archaic method of 1970s which employed file name and keyword for image retrieval is identified as text based image retrieval (TBIR). It is labor exhaustive and time consuming too. The human interface also led to errors caused by semantics and misinterpretation. Content based information retrieval is a successful system for design based exploration and a process of retrieving images from a collection of digital images according to the illustration content of images. The method involves computing a feature vector that characterizes the character of the images. The images are stored in a feature database. In CBIR system the user provides a query image and the system will do preprocessing of the image and the features extracted are stored in a database. The distance measure method and the shortest distance metric are the two ways used to compute the similarity for the images. The computed values from the query image should be proficiently adequate to exemplify the structure and spatial properties of the images contained in image database. Works has been carried out by various researchers proposed different techniques for retrieval like Ashraf et al. suggested a procedure for depiction of image and attribute taking out using bandlet transform, this method extracts the core items there in the image. The system concert and accomplishment was assesses using well known datasets. The precision and recall values are sued for the retrieval effectiveness assessment.
Seetharaman and Selvaraj [1] suggested a system for image retrieval by means of numerical tests, such as Welch’s t-tests and Fratio. Textured and structured key in query images were examined. In case one the image is assumed to be textured and in case two the image are assumed as structured were contour is alienated into a variety of regions based on its character. For performance evaluation he used mean average precision score. Dueck [2] presented an algorithm called deluge algorithm as a local search for enhancing the concert of a meta heuristic. Ritam Guha et al. [3] tried by inserting the deluge algorithm with genetic algorithm to acquiesce a superior result as an alternative of using the genetic algorithm only. Prasad Rao et al. [4] has reported various histogram techniques applied for the improvement over CBIR system. Histograms are represented in the form of fixed intervals of bins. Each bin represents the corresponding intensity values to the fixed range related to the pixel values the bins will be plotted. The range of intensity values defines the width of a bin, usually all bins are of equal width.
Neha Malviya [5] has been proposed in top down and bottom up approach for image segmentation. Shikha Bhardwaj [6] has proposed an approach named as conditional random field(CRF) using top-down and bottom-up based probabilistics techniques for image sgmentation. An improved method for visual similarity search in content based image retrieval proposed by Nehal M. Varma et al. [7]. In his work, the features such as color, texture and shape are used as feature descriptors for both query and database image as well. A novel feature extraction algorithm called LTCoP (local ternary co-occurence patterns) for biomedical image retrieval system has been proposed by Alan Gowri Phivin et al. [8].This LTCoP calculates the gray values of center pixel and its surrounding neighbors by encoding the co-occurrence of similar ternary edges. While the LDP (local derivative pattern encodes the co-occurrence between the first –order derivatives ina specific direction. The effectiveness of the algorithm is confirmed by combining it with the gabor transform [10, 14]. Panchanathan et al. [26] refined intensity analysis of CBIR technology, by elaborating the ethics the following techniques for color, texture, shape and spatial indexing and retrieval. Also confer the issues concerned in retrieval techniques for compacted images and the expansion of strong and compacted image content features, more exact representation of creature perceptions of image likeness.
2 Preliminary process
Before the image is fed into the process of fetaure extraction, basic processing has been done to reduce the features present in the image. The moto of this work is to reduce the features present in the image to minimum which will be unique to extract the content from the images supplied. This preliminary process includes three tasks. The first task involves grouping of data points, and the second task involves image enhancement and the third task involves the DWT technique [21, 23, 25].
Process involved in grouping is as follows:
-
1.
Initialize the number of groups. (Say G1, G2, G3…Gk).
-
2.
Based on the initialization of groups pick the RGB pixel values which are in random position.
-
3.
Compute the distance between all the data points and the group initiated by Euclidean distance formula. (If E = (E1, E2, E3, …En) and D = (D1, D2,D3…Dn) are two points, then the distance from E to D, or from D to E is given by: √∑n(Ei − Di)2.
-
4.
The procedure mentioned in step 3 is repeated for all the pixel values in the image.
-
5.
The visual analysis is not that much good for the single iteration so new groups are to be identified.
-
6.
To attain the new cluster, calculate the mean of the pixel values with respect to every cluster new.
-
7.
After obtaining the mean value for R, G, B channels individually, calculate the disparity between the old group values and the new group values.
-
8.
For the completion of single iteration. The process will be repeated until there is no further change in the group values.
-
9.
If the disparity is greater than the threshold value then allocate the new values to the existing values and go on with step 3.
Steps involved for image enhancement,
-
1.
Depict the resultant group image in the form of matrix.
-
2.
Find the frequency of each overlapping pixel values in 3 × 3 matrix.
-
3.
Compute the probability density function of each frequency.
-
4.
Compute the cumulative distribution function of each pixel.
-
5.
Identify the middle element in the 3 × 3 matrix and replace it with the cumulative distribution function value.
-
6.
The above steps are repeated for the entire matrix and generate the corresponding output image.
-
7.
The resultant image will be fed into DWT first level.
3 Proposed methodology
The system initially classifies images into groups that match to the pixel intensity values in it. Followed by enhancing the image done using probability distribution and cumulative distribution function the intensity values are changed which is fed into DWT first level of approximation.
All the pixels in the neighborhood have the same property with respect to the central pixel are shown in step 6.The vertical and horizontal contrast features measures the vertical stripes and horizontal strips equal. The possible number of patterns are shown in step 5.
The following steps involved in the surrounding information retrieval algorithm (SIR).
-
1.
Consider the resultant image genertaed after preprocessing.
-
2.
Consider the Lower resolution approximation image.
-
3.
Form 3 × 3 window mathematically by using the formula,
$$\mathrm{C}=\left\{\begin{array}{l}0 \,if \,{cp}_{11 > {N}_{ij }}\\ 1 \,if\, {cp}_{11={N}_{ij}}\\ 2\, if\, {cp}_{11<{N}_{ij}}\end{array}\right. {F}_{ij} , 0\le i,j\le 2,\forall ij\ne 1$$Given a neighborhood of 3 × 3 pixels, which will be represented by a group having nine elements:\({N}_{ij},\)
$${N}_{ij}=\left(\begin{array}{ccc}{N}_{00}& {N}_{01}& {N}_{02}\\ {N}_{10}& {cp}_{11}& {N}_{12}\\ {N}_{20}& {N}_{21}& {N}_{22}\end{array}\right)$$where cp11 denotes the intensity value of the central pixel \({N}_{ij}\) and is the intensity value of the neighboring pixels.
-
4.
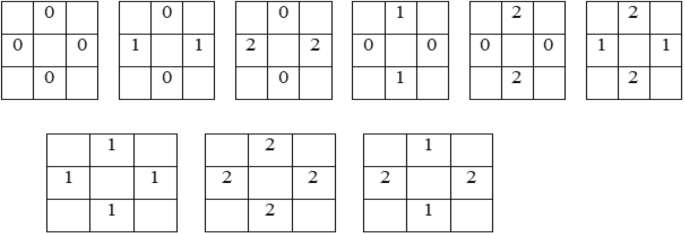
To identify the similar property of all surfaces which provides the visual patterns assign a value of 0 if the pixel intensity value is less than, equal means make it 1, and is greater than that of the central pixel make it as 2.
-
5.
To measure the frequency of occurrences of pattern on the 3 × 3 window identify vertical and horizontal equal values and Mirror L shape and L shape equal values for each 3 × 3 window and obtain the central pixel values.
-
6.
Calculate the vertical and horizontal equal values based on the group of patterns having a identical neighborhood around the central pixel as shown.
-
7.
Calculate L shape and inverse L shape equal values based on the frequency of occurrence of patterns as shown. If the patterns encountered then the central pixel values are extracted and stored in a feature dataset.

-
8.
Likewise, the feature vectors are cidentified for all the left over sections.
-
9.
The same way, the feature vectors for all other images in the database are identified and placed in a dataset.
-
10.
Compute similarity measures for the stored value of query and database images.
-
11.
Retrieved images will be displayed.


3.1 Proposed MER system
The proposed system method identifies the discontinuities in an image having isolated points so that these points would not occur frequently in most images. This method aims to identify and locate the sharp discontinuities in an image. This approach aims to extract the minimum feature which gives the optimal solution for retrieval. The proposed method MER works based on extracting the LL image from the DWT technique which is obtained after completing the pre-processing phase which is further fed into single value decomposition technique for size reduction to carry out further process of image intensity extraction. The working principle of the proposed method is as follows.
The working principle of the anticipated method MER is mentioned below.
-
Step: 1 Consider the LL image for further extraction which has been attained after preprocessing.
-
Step: 2 Reduce the image size by using single value decomposition (SVD) for the LL image obtained. The process involved in finding SVD is as follows.
-
1.
The image matrix I can be factorized as I = U S VT where U and V are orthogonal matrices with eigenvectors chosen from AAT and ATA respectively.
-
2.
S is a diagonal matrix with r elements equal to the root of the positive eigenvalues of AAT or ATA. The diagonal elements are composed of singular values.
i.e. mxn matrix can be factorized as Amxn = UmxmSmxnVnxnT.
-
3.
Once SVD has been computed proceed to step 3 for Identifying the minimum edge intensity values
-
1.
-
Step: 3 Check whether the size of the row and column are equal.If yes, consider the elements as it is. If not, then make it same size by adding zeros in either row or column to equal the size of the image matrix.
-
Step: 4 Row Subtraction: Find the difference between the smallest pixel intensity value of every row with the pixel values of that row. Note: If zero is the small value in that row then proceed to another row leaving the row unchanged.
-
Step: 5 Column Subtraction: Identify the smallest pixel intensity value of every column and find the difference between rest of the values in that column. Note: If zero is the small value in that column then proceed to next column leaving the column unchanged.
-
Step: 6 Plot least horizontal and vertical lines where zeros are present.To plot the least number of lines certain constraints to be followed as mentioned:
-
1.
Choose a row which has single zero not plotted by lines corresponding to its column draw a vertical line do the same process untill no such row is left.
-
2.
Choose a column which has single zero not plotted by lines corresponding to its row drwa a horizontal line do the same process until no such column is left.
-
1.
-
Step: 7 Check whether the number of plotted horizontal and vertical lines are equal to the size of the matrix, then store the pixel intensity value of the matirx in a database where the two lines intersect. If the vertical and horizontal plotted lines are not equal to the size of the matrix, then find the difference between the rest of the values with the smaller value identified is performed with plotted lines.The difference value is added to the rest of the plotted values.
-
Step: 8 The above mentioned Steps 4 and 5 are repeated untill the least number of lines plotted covers all zeros which equal to the size of the matrix.
-
Step: 9 Choose a row which contains accurately single unmarked zero and bound it by, and depict a vertical line all the way through the column contains this zero. Replicate this process till no such row is left; then choose a column contains accurately one unmarked zero and bound it by, and depict a horizontal line through the row contains this zero and do again this process till no such column is left. Note: If there is more than one unmarked zero in any row or column, it indicates that an substitute result exists. In this case, choose anyone randomly and pass two lines horizontally and vertically.
-
Step: 10 Store the intensity value of the identified minimum edge which shall be stored in feature dataset.
-
Step: 11 Similarly the feature vectors for database images are computed and stored.
-
Step: 12 Compute similarity measures for the stored value of query and Database images using an image distance measure, corresponding matching images will be displayed (Figs. 1, 2).

Proposed model for CBIR based image retrieval

Proposed method SIR architecture
The proposed method is depicted in Fig. 3 which shows the entire process taking place when a query image is provided for finding relevant images. In the initial stage, the user will provide the test image for the extraction of its pixel content using preprocessing followed by MER.

Proposed method MER architecture
Once the features are extracted, the feature vectors are stored in a feature database. The above process is done for the images present in database. The feature database is compared by using Euclidean and Manhattan similarity measures between the test image and the database image. The image feature which gets matched is retrieved and displayed as ascending order based on the image distance measure value.
The following steps involved in the Integrated Feature retrieval algorithm (IFR).
-
Combine the features extracted from the proposed algorithms SIR and MER.
-
Compute similarity measures for the extracted features.
-
Store in Feature dataset.
-
Retrieve the images based on sorting which display first 30 images.
The method Tamilkodi et al. [9] carried out the multiple feature extraction for the improvement of retrieval quality of the query image. The steps involved in the extraction are the first stage of extraction involves the cluster index by the separation of pixel values into three different groups and the choice will be given for the user to pick which cluster is required for further extraction. The second stage involves the generation of histogram equalization where the pixel values are replaced by the local mean by means of cumulative distribution function [10].
The third stage is involved by applying the approximation of first level of discrete wavelet transform. The above mentioned methods are applicable to images present in the database also where we have to search for the related images. The stored values are measured with the database image also with the test image by similarity matching algorithm where comparison is made with each values if the stored values are equal then the corresponding images related to the values are restored and displayed as resultant image for the query image search. The aim of this work is to show some methods will perform good for some extension even if we are extracting the features from multiple methods for the query retrieval certain features extracted from the images show good retrieval results. This work takes an analysis of the methods in some cases how it will be working good and the reason for its failure in few images for multiple feature extraction.
The projected method uses various kinds of feature extraction method by specifying the most significant points in a distinct way and depicts more complex feature representation. A multiple feature query associate additional features extracted from three different methods and all features have equal importance during the search. In these approaches, there are two major tasks; the first task is feature extraction, where a set of pixels values present in the image are extracted based on the method applied and the second is the similarity measures to retrieve the exact matching of the images. The final resultant will be based on the comparison of the values stored in the image database with similar values equals to zero in distance measure are retrieved.
4 Similarity measurement
An Each image will store in its feature-vectors to achieve the computation, and feature-vectors are coordinated with the query-image feature-vectors which help in similarity measurement. The matching step above stated features to get the visually similar outcome by using similarity measure method referred as “Distance method.” The other distances method like Euclidean distance, Correlation Distance [11, 12], Manhattan and Hamming Distance are used for measurement. When the feature vector databases are created one can find the preferred query to retrieve the similar images from the database. To make possible this, retrieval system has to achieve the significant chore of applying the similarity measure so that distance between the query image and database image will be calculated and images at less distance will be retrieved in the final set. The extracted features shown as sample in Table 1 are compared with distance measure to retrieve the similar images based on the distance measure value (Fig. 4).

Proposed method IFR architecture
5 Experimental results
WANG database is used for system evaluation. This image database consists of the randomly picked images from Corel database. For simplifying the process the images are further separated into 10 classes in which every class holds 100 images as shown in Fig. 5.

Sample images from WANG database
It is broadly used for testing CBIR systems. Classification of the images in the database into 10 classes makes the assessment of the classification simple. The earlier methods which have developed used mat lab for implementation. From the 1000 image we arbitrarily selected 300 images from the database. From each class it has been arbitrarily selected 30 images. The preferred images go through the implemented system to remove the features and cache them. This step will work offline as the database created is geared up for testing and measuring the CBIR based on the previous work discussed in Tamikodi et al. [13]. From the Figs. 6, 7, 8, 9 the distance measure with Manhattan attains good retrieval results when compared with the other distance measures. Figure 5 shows the sample image fromm corel database. This database consists of one lakh images. From that randomly selected some images and are considered for experimentation. The images are classified into several categories based on the nature of the images. For each category 100 images are considered for performing experimentation.

Shows the results obtained after giving the query image using euclidean distance

Shows the results obtained after giving the query image using manhattan distance

Shows the results obtained after giving the query image using hamming distance

Shows the results obtained after giving the query image using Correlation Distance
Figures 6, 7, 8 shows the retrieval results for the query image mountain by using various similarity distance measures in which the distance measure manhattan shows good retrieval results when compared with other distance measures.
6 Performance assessment
One can evaluate the system by knowing its performance in which we may face difficulties. The foremost crisis in CBIR system is the measurement of the performance either in standard database or distinctive measure. Various image databases are existing which are used to measure the results of CBIR system. In CBIR, the mainly usually used recital actions are Precision and Recall. Precision is defined as the ratio of the number of retrieved relevant images to the total number of retrieved images Recall is defined as the ratio of the number of retrieved relevant images to the total number of relevant images in the database as per Liu et al. [14].
The precision of the retrieval is defined as the fraction of the retrieved images that are indeed relevant for the query:
The recall is the fraction of relevant images that are returned by the query
The Table 1 shows the precision and recall values of the proposed methods and the performance evaluation has been carried out based on the images category wise. Based on the observation on the values obtained from the precision and recall of the methods, it gives clarity about individual methods in some cases outperforms. In Table 1 some of the precision values are made as bold shows the method MER with single feature extraction performs good in mountains, Dinosaurs and pyramid.ie among 10 categories of images seven category of images are retrieved good in IFR. It shows the method used for multi feature extraction performs good when compared with single feature extraction method. While comparing the average precision and recall values of the proposed methods the IFR shows good results 20% variation with MER and 40% deviation with SIR. On the whole that the multiple feature extraction will give outstanding performance.
6.1 Comparative analysis of proposed methods
To evaluate the suitability of CBIR methods we performed a number of experiments. The majority of the images were taken from a 10 megapixel camera. This has been tested with the image of different sizes at 512, 1024 as well as long distance and short distance of an image how it will work on the feature extraction. To show the difference and the various methods applied for feature extraction to find the best retrieval. Error examination is some sort of concert criteria which enables you to try dissimilar things and verify it out by manually without difficulty that which choice is better. The most part widespread method for comparing two images in CBIR is using an image distance determine. An image distance assess compares the likeness of two images in a variety of proportions such as color, texture, shape and others. For instance a distance of 0 signifies an accurate go with the query with respect to the proportions that were measured.
The performance of these CBIR methods has been assessed and compared. This learning shows that the CBIR system using various image features computed from the precisely segmented yields considerably superior concert than the schemes using a sole measurement. In [13, 15, 16] shows various methods and compared the precision and recall with the existing methods. The methods compared are used color, texture and shape with the image database called WANG to evaluate their proposed systems. To compute the concert of the system the images are taken from the database and the sample image also taken from the same set and it is fed into the process of feature extraction. This system will achieve extensively better than other systems for all the classes except for very few. In summing up, this estimation learning compared the concert of three types of CBIR schemes using a widespread testing database and investigated several approaches that intend to get better system performance. CBIR schemes using various image features considerably improved performance. The experimental results show Manhattan has achieved higher retrieval performance than Euclidean distance.
From Table 2, the precision values obtained from the proposed method IFR is superior than the other methods such as SIR the difference is 0.448 and with MER 0.0166 and with other methods [2, 4, 8, 12, 17] the differences are 0.077,0.0766,0.0413,0.0471,0.035.
From Table 2, the precision values obtained from the proposed method IFR is superior than the other methods such as SIR the difference is 0.0301 and with MER 0.0179 and with other methods [2, 4, 8, 12, 17] the differences are 0.0346, 0.0261, 0.0291, 0.0252, 0.016.
Tables 2 and 3 shows the comparative analysis done with existing methods as well as the proposed methods.From the recall and precision values it is clear that the proposed method IFR outperforms well when compared with MER and SIR except for three categories of images.The multi feature extraction methods shows good results form seven category of images and less deviation in rest of the 3 categories.
7 Conclusion and future scope
In this paper pixel values are used as an image attribute to find out minimal set of pixel values. The reduced set acts as an input to the dataset for similarity matching. It is experiential that CBIR based on color, texture and shape combined features provides enhanced results. From the experimental results the multi feature extraction shows good retrieval performance. This retrieval algorithm presented in this paper mainly reduces the computational time. This work can be further enhanced for the development of application to web-based CBIR system.
References
Hiremath PS, Pujari J (2007) Content Based Image Retrieval using color, texture and shape features, 15th international conference on advanceed computing and communications (ADCOM 2007). Doi: https://doi.org/10.1109/ADCOM2007.21
Foutsitzi GA, Gogos CG, Hadjigeorgiou EP, Stavroulakis GE (2015) Actuator location and voltages optimization for shape control of smart beams using genetic algorithms. Actuators. https://doi.org/10.3390/act2040
Guha R, Ghosh M, Kapri S, Shew S et al (2019) Deluge based genetic algorithm for feature selection. Spirnger, Berlinheiderberg. https://doi.org/10.1007/s12065-019-00218-5
Chatzichristofis SA, Iakovidou C, Boutalis YS, Angelopoulou E (2014) Mean normalized retrieval order (MNRO): a new content-based image retrieval performance measure. Multimed Tools Appl 70(3):1767–1798. https://doi.org/10.1007/s11042-012-1192-z
Varma NM, Riyaz A (2008) Content retrieval using hybrid feature extraction from query image.978-1-5386-5510-8/18/$31.00 © IEEE
Prasada Rao K, Chandra Sekhara Rao MVP, Ravi Kishore CH (2018) Content based image retrieval using color histogram. glcm and fourier descriptors. Int J Pure Appl Math 118:4613–4617
Bhardwaj S, Pandove G, Dahiya PK (2019) An intelligent multi-resolution and co-occuring local pattern generator for image retrieval. Endorsed Trans Scalable Inf Syst. https://doi.org/10.4108/eai.10-6-2019.159344
Seetharaman K, Selvaraj S (2016) statistical tests of hypothesis based color image retrieval. J Data Anal Inf Process 04:90–99. https://doi.org/10.4236/jdaip.2016.42008
Madenda S, Mustikasari M (2014) Performance analysis of color based image retrieval. Int J Comput Technol. https://doi.org/10.24297/ijct.v12i4.7058
Liu Y, Zhang D, Lu G, Ma WY (2007) A survey of content based image retrieval with high-level semantics. Pattern Recogn 40(1):262–282. https://doi.org/10.1016/j.patcog.2006.04.045
Apurva N, Ganar CSC, Sachin MJ (2014) Enhancement of image retreival using colour, texture and sahep features,2014 international conference on eletronic systems. Sig Process Comput Technol IEEE. https://doi.org/10.1109/ICESC.2014.48
Ashraf R, Bashir K, Irtaza A, Mahmood MT (2015) Content based image retrieval using embedded neural networks with bandletized regions. Entropy 17(6):3552–3580. https://doi.org/10.3390/e17063552
Tamilkodi R, Rosline Nesa Kumari G, Maruthu Perumal S (2018) A novel method for query based image retrieval using prototype based clustering. Int J Image Min. https://doi.org/10.1504/IJIM.2018.093020
Kokare M, Chatterji BN, Biswas PK (2015) A survey on current content based image retrieval methods. J IETE J Res. https://doi.org/10.1080/03772063.2002
Heikkil M, PietikInen M, Schmid C (2006) Description of interest regions with local binary patterns. Pattern Recogn 42(3):425–436 ((Springer))
Patil A, Talbar S (2010) Content based image retrieval using various distance metrics, international conference on data engineering and management, ICDEM 2010: data engineering and management. pp.154–161. Doi: https://doi.org/10.1007/978-3-642-27872-3_23
Guha R, Ghosh M, Kapri S, Shaw S, Mutsuddi S, Bhateja V, Sarkar R (2019) Deluge based genetic algorithm for feature selection. Evolut Intell Algorithm Featur Sel. https://doi.org/10.1007/s12065-019-00218-5
Dueck G (1993) New optimization heuristics. J Comput Phys 104(1):86–92. https://doi.org/10.1006/jcph.1999.6413
AB Benitez, M Beigi, S-F Chang (1998) Using relevance feedback in content based image meta search proc. ieee, int’l conf. Internet Comput. Doi: https://doi.org/10.1109/4236.707692
Idris F, Panchanathan S (2002) Review of image and video indexing techniques. J Vis Commun Image Represent 8(146–166):1997. https://doi.org/10.1006/jvci.0355
Tamilkodi R, Rosline Nesa Kumari G, Maruthu Perumal S (2016) A new approach anticipated for CBIR by means of local and global mean. J Adv Res Dyn Control Syst 9(1):1943–2023
Tamilkodi R, Roseline Nesa Kumari G, Maruthu Perumal S (2018) An innovative method of retrieving images through clusters, means and wavelet transformation. Int J Inf Tecnol. https://doi.org/10.1007/s41870-018-
Jacob IJ, Srinivasagan KG, Jayapriya K (2014) Local oppugnant color texture pattern for image retrieval system. Pattern Recogn Lett 42:72–78. https://doi.org/10.1016/j.patrec.2014.01.017
Sharma M, Batra A (2014) Analysis of distance measures in content based image retrieval. Global J Comput Sci Technol Interdiscip 14(2):1 (Global Journals Inc. USA)
Malik F, Baharudin B (2013) Anlaysis of distance, ethics in content based image retrieval using statistical quantized histogram texture features in the DCT domain. J King Saud Uinv Comput Inf Sci 25(2):207–218. https://doi.org/10.1016/j.jksuci.2012.11.004
Panchanathan S, Chakraborty S, Balasubramanian V (2012) Batch Mode Active Learning for Multimedia Pattern Recognition. 489-490. https://doi.org/10.1109/ISM.2012.101
Author information
Authors and Affiliations
Corresponding author
Rights and permissions
About this article

Cite this article
R, T., Nesakumari, G.R. Image retrieval system based on multi feature extraction and its performance assessment. Int. j. inf. tecnol. 14, 1161–1173 (2022). https://doi.org/10.1007/s41870-020-00556-z
Received:
Accepted:
Published:
Issue Date:
DOI: https://doi.org/10.1007/s41870-020-00556-z