
Abstract
With ample cultivation and economic potential, coffee is one of the main commodities in the world. Despite its vast cultivation, there remain problems related to its productivity as a consequence of pests and diseases, questions regarding its physiology, and difficulty with its propagation. Due to such challenges, the application of biotechnological tools, such as tissue culture and molecular markers, has become essential in the search for improvements to coffee cultivation. Among tissue culture techniques, somatic embryogenesis is considered the best form of micropropagation in vitro since it is possible to produce plants that are identical to the parent plant. It is therefore essential to identify the genes involved in the process of somatic embryogenesis, as well as to understand their functions. Different studies have shown the expression of ethylene response factor (ERF) genes in different tissues and under different conditions, mainly in response to biotic and abiotic stresses. However, little is known about their role during somatic embryogenesis. Thus, this study is aimed to identify and analyze the expression patterns of ERF subfamily genes during Coffea arabica L. somatic embryogenesis. The EST-contig6, 9, and 27 were confirmed to be the ethylene response factor 8, 13, and 12 genes from Coffea arabica L., respectively, and their relative expression analysis suggests that they may be involved in coffee somatic embryogenesis. The expression patterns of ethylene response factor 8 and 13 in embryogenic calluses and embryogenic cell suspensions showed that these genes can potentially act as somatic embryogenic markers.
Introduction
Coffee has become one of the main commodities in the world due to its economic potential and broad cultivation (MAPA: Ministério da Agricultura, Pecuária e Abastecimento, 2017). Despite extensive cultivation and research on the species, due to its economic relevance, there are still problems related to its productivity as a consequence of pests and diseases (Carvalho et al. 2012; Carvalho et al. 2017), questions regarding its physiology and genetics (Barreto et al. 2012; Ságio et al. 2014), and difficulty with its propagation (da Rosa et al. 2011; Huang et al. 2014). In order to solve or minimize the problems related to coffee cultivation, breeding programs have sought the development of plants with superior characteristics; however, the time for the emergence of new and improved cultivars can be long, making it an obstacle to the process (Carvalho et al. 1991; Tonietto et al. 2012).
In this way, the application of biotechnological techniques, such as tissue culture and the use of molecular markers, can serve as powerful tools to aid the genetic improvement of coffee. Through in vitro micropropagation, it is possible to obtain thousands of seedlings with the characteristics of interest by means of a single leaf explant, an achievement that is almost impossible with propagation via seed (Carvalho et al. 1991; Campos et al. 2017). The use of molecular markers allows the identification of genetic patterns, which are important in the selection of genetic material with desirable characteristics. Such markers do not represent the target genes themselves, but act as flags that indicate their existence (Collard et al. 2005), and thus the presence of characteristics of interest.
Somatic embryogenesis is a tissue culture technique that is widely used in breeding and genetic studies of several plant species of economic interest (Kumaravel et al. 2017; Itaya et al. 2018; Zhu et al. 2018). Exploiting cellular totipotency, this technique is characterized by a high multiplication rate when compared with other propagation processes, plus it produces of plants identical to the mother plant, which is considered the best option for in vitro micropropagation. The development of diploid somatic cells in structures that match zygotic embryos depends on the balanced expression of a complex network of genes, which are regulated by endogenous and environmental factors (Zimmerman 1993). Therefore, identifying the genes involved in the process of somatic embryogenesis, and to understand their functions, is essential to improving their applicability in the process of plant propagation and breeding.
Different studies have been carried out in order to identify and characterize the genes regulating the onset of coffee somatic embryogenesis (Nic-Can et al. 2013; Silva et al. 2013; Silva et al. 2014; Torres et al. 2015; Freitas et al. 2017). Studies with several species have revealed the importance of such genes in the process of somatic embryogenesis (Wiśniewska et al. 2012; Silva et al. 2014; Tvorogova et al. 2016; Zheng et al. 2016; Boycheva et al. 2017). Likewise, research has shown that hormones and stress conditions influence the induction of this process (Mantiri et al. 2008b; Nolan et al. 2014), and induce the differentiation of cells leading to the onset of an embryogenic response (Ikeda-Iwai et al. 2003; Rose and Nolan 2006).
The genes belonging to the AP2/EREBP (APETALA2/ethylene-responsive element binding protein—protein that binds to the ethylene response element) superfamily are transcription factors that play important roles in plant development, as well as tolerance to biotic and biotic stress (Liu and Zhang 2017). Thus, signaling molecules, such as jasmonic acid (JA), salicylic acid (SA), ethylene (ET), and abscisic acid (ABA), act to regulate several important defense-signaling pathways involving these genes (Bouaziz et al. 2015). A number of studies have attempted to identify and evaluate how these genes act in response to stress (Sharma et al. 2010; Bouaziz et al. 2015; Dossa et al. 2016; Du et al. 2016; Liu and Zhang 2017); however, few studies have aimed at identifying and characterizing these genes in somatic embryogenesis.
The AP2/EREBP superfamily is one of the largest groups of plant-specific transcription factors (Chen et al. 2016). This group shares a highly conserved region (AP2 DNA binding domain) with 50 to 70 amino acid residues (Allen et al. 1998). Based on the number of AP2 domains and similarity of sequences, genes belonging to the AP2/EREBP superfamily are divided into three families: AP2, RAV (related to ABI3/VP1), and ERF (ethylene response factor; Chen et al. 2016). The family AP2 possesses two AP2 domains (Shigyo and Ito, 2004), RAV possesses the AP2 domain and the B3 DNA binding domain (Feng et al. 2014; Li et al. 2015), and ERF contains a single AP2 domain, which is the largest of the AP2/EREBP superfamily and a crucial regulator of several processes in plants.
Different studies have shown the expression of ERF genes in different tissues and under different conditions, with these transcriptional factors being involved in several resposes to biotic and abiotic stresses in plants (Bouaziz et al. 2015; Dossa et al. 2016; Du et al. 2016; Liu and Zhang 2017). However, few studies have analyzed their role during the process of somatic embryogenesis (Mantiri et al. 2008b; Piyatrakul et al. 2012; Zheng et al. 2013; Silva et al. 2015). A gene belonging to the ERF subfamily, designated somatic embro-related factor 1 (SERF1), which is involved in somatic and zygotic embryogenesis and is induced by ethylene and is expressed in embryogenic calli, has been identified in Medicago truncatula (Mantiri et al. 2008b). This gene seems to be essential for somatic embryogenesis and may allow a connection between stress and plant development (Mantiri et al. 2008b; Nolan et al. 2014). The fact that the SERF1 gene belongs to the ERF subfamily and plays an important role in somatic embryogenesis is interesting since genes of this subfamily are commonly related to plant growth and processes of response to biotic and abiotic stressors (Bouaziz et al. 2015). This suggests, therefore, that other genes of this subfamily are likely to have important functions in the embryogenic process as well.
Currently, bioinformatics along with biotechnology allow the development of research aimed at genomic study. The transcriptome (Vieira et al. 2006) and, more recently, the genome sequencing (https://worldcoffeeresearch.org/) of Coffea arabica enabled the development of studies aiming the identification and analysis of genes related to the regulation of different metabolic pathways. In this context, gene expression analysis through real-time qPCR displays an important role for the understanding of the biological function of these genes. Therefore, considering the economic importance of the coffee and its cultivation problems, this study aimed to in silico identify and characterize the genes from the Coffea arabica. ERF subfamily analyzes the expression patterns of some of these genes during coffee somatic embryogenesis.
Materials and Methods
In Silico Identification on the CAFEST Database
The NCBI (National Center for Biotechnology) genebank was searched using SERF1 as the keyword in order to find sequences relating to that gene already deposited in the database. The obtained sequences were annotated and applied in a new search using the BLAST (Basic Local Alignment Search Tool; Altschul et al. 1990) on the coffee EST (expressed sequence tag) database (CAFEST), which has been generated by the Coffee Brazilian Genome project (Vieira et al. 2006). The search and clustering processes of the of the putative members of the coffee ERF subfamily were carried out using the Gene Project interface (http://www.lge.ibi.unicamp.br/cafe/) from the CAFEST database.
In the same way, a second search was performed using the tBLASTn algorithm (Altschul et al. 1997). The query (target) of amino acids was compared with nucleotides translated from the database, and all reads that had significant alignment (e value > 10−5) were selected. Using the term SERF1 as the keyword, a search of the ESTs database was performed, since all reads were previously annotated automatically by comparison with the NCBI genebank. Next, the selected reads were grouped (clustering), forming the EST-conitgs and the singlets. After clustering, the saturation process was performed aiming to find new sequences of the probable gene, as well as the correction of incomplete clusters. This process consisted of the application of the EST-contigs formed in the new search of the database. This procedure was repeated until no significant new reads were found.
Using the ORF FINDER (Open Reading Frame Finder) tool, we identified the open reading frame (ORF) from each gene obtained from the clustering process. The presence of the AP2 domain, which characterized ERF subfamily members, was verified through a conserved domain analysis carried out on the NCBI Conserved Domain database.
Finally, the nucleotide sequences of interest were compared with the public database of protein sequences (NCBI) using the BLASTx algorithm. The BLASTp algorithm (Altschul et al. 1997) was applied to align the protein of interest with the proteins deposited in NCBI, which allowed the evaluation of the degree of similarity between the compared sequences.
In Silico Identification on the Phytozome Database
Using the keyword AP2, a search on the PFAM (https://pfam.xfam.org/) database, aiming to find the PFAM number for the AP2/EREBP superfamily, was carried out. The number obtained (PF00847) was used as a search parameter on the Phytozome database (https://phytozome.jgi.doe.gov/pz/portal.html) for the obtaining the sequences from the ERF superfamily previously deposited on this database. The sequences found were then submitted to clustering using the CAP3 program and its default parameters. Similar to the sequences found on the CAFEST database, the ORF and the conserved ERF domain of the sequences found on the Phytozome database were identified through the ORF FINDER tool and verified on the NCBI Conserved Domain database, respectively.
Phylogenetic Analysis
Using the ClustalW program (Thompson et al. 1994) and its standard parameters (default), a global alignment of the EST-contigs and singlets, obtained from the CAFEST and Phytozome databases, was performed with the amino acid sequences encoded by them, the SERF1 gene proteins of the species Medicago truncatula and Glycine max obtained from the NCBI, and the ERFs genes of Coffea arabica described by Lima et al. (2011). The sequences were visually inspected and manually corrected, with those whose homology could not be ascertained being removed. The final phylogenetic tree was constructed using the MEGA 7.0 program (Kumar et al. 2016), with a neighbor-joining comparison model (Saitou and Nei 1987), distance model p, and pairwise suppression. The probabilistic bootstrap test with 10,000 replicates was used to validate the tree in relation to the phylogenetic distance of the clusters (Sitnikova et al. 1995).
Identification of Common Grouping Motifs
In order to identify conserved motifs from the deduced amino acid sequences of the among the putative ERFs found in the CAFEST and Phytozome databases, the MEME Suite (Version 4.11.3; http://meme-suite.org/tools/meme; Bailey et al. 2009) was employed with the following settings modified from the default: maximum number of motifs 6, minimum motif width 6, maximum motif width 200, and any number of repetitions. Sequences were then aligned using the ClustalW program (Thompson et al. 1994) and subjected to the GeneDoc program (http://www.nrbsc.org/gfx/genedoc/) to shade the identical and similar amino acids in alignment.
Electronic Northern
For in silico analysis of gene expression, the frequency of the reads forming EST-contigs and singlets was calculated according to their expression in the CAFEST libraries, and the data normalized to allow the exact analysis of the degree of expression of the probable genes in each of the treatments and organs of the plant. Normalization consisted of multiplying the number of reads forming each EST-contig or singlet by the ratio of the total number of all libraries and the number of reads in the library in which it appeared expressed. By relating genes and libraries, the data was dropped into an array and rearranged according to where they were expressed. The EST-contigs, singlets, and libraries were grouped by hierarchical clustering (Eisen et al. 1998) using the TreeView program to obtain a figure that allows the degree of expression of the genes belonging to the ERF subfamily to be studied. The figure was generated in grayscale with zero or negative expression being represented by lighter shades, with gradually increasing darkness until reaching black, which represents the maximum degree of positive expression.
Primer Design
From the candidate sequences for the genes involved in somatic embryogenesis belonging to the ERF subfamily of Coffea arabica obtained from the in silico analysis, primers for RT-qPCR (Table 1) were designed using Primer Express v3.0 of Applied Biosystems (Thermo Fisher Scientific, Foster City, CA).
Callus Induction and Establishment of Cellular Suspensions
Embryogenic and non-embryogenic calli induction were generated from mother plants of cv. Catuaí Amarelo IAC 62 cultivated under greenhouse conditions using the protocol described by Teixeira et al. (2004). Initially, leaf explants with approximately 0.5 cm2 were cultivated in primary medium (PM) for 30 d, and then, they were transferred to secondary medium (SM), where they were cultivated for 180 d. The PM medium is composed by 1/2-strength Murashige and Skoog salts (Murashige and Skoog 1962), sucrose (20 g L−1), thiamine (10 mg L−1), pyridoxine (1 mg L−1), glycine (1 mg L−1), nicotinic acid (1 mg L−1), myo-inositol (100 mg L−1), hydrolyzed casein (100 mg L−1), malt extract (400 mg L−1), 2,4-D (20.0 μM), IBA (4.92 μM), 2-iP (9.84 μM), and Phytagel® (2.4 g L−1). The SM medium constitution is basically the same of the PM medium, differing only by the 2,4-D concentration (10.0 μM). The inoculated material was kept in a growth room at 27 ± 2°C and absence of light.
Embryogenic cell suspensions were established with an inoculum density of 10 g L−1 (Zamarripa et al. 1991) by 200 mg of embryogenic calli inoculation to 125-mL Erlenmeyer flasks containing 20 mL of T3 multiplication liquid medium: 1/2-strength Murashige and Skoog salts (Murashige and Skoog 1962), sucrose (30 g L−1), thiamine (5 mg L−1), pyridoxine (0.5 mg L−1), nicotinic acid (0.5 mg L−1), myo-inositol (100 mg L−1), hydrolyzed casein (100 mg L−1), malt extract (200 mg L−1), kinetin (4.44 μM), and 2,4-D (4.52 μM) (vanBoxtel and Berthouly 1996). Flasks were maintained in an orbital agitator at 100 rpm (Tecnal, Piracicaba, Brazil), at 25 ± 2°C and in the absence of light, and the multiplication medium was completely renewed at every 15 d. After 90 d, the embryogenic cell suspensions were used in the experiment.
Experimental Design and Tissue Sampling
The experiment was conducted in a completely randomized design, with three biological repetitions for each tissue type. For non-embryogenic and embryogenic callus cultures, each repetition was composed by 10 calluses generated from different leaf explants. For cell suspensions, each biological repetition was composed by 200 mg of cell clusters obtained after embryogeneic calli multiplication in liquid medium. Collected samples were immediately frozen in liquid nitrogen and subsequently stored at − 80°C until RNA extraction.
Extraction of Total RNA and cDNA Synthesis
The extraction of RNA from the samples was performed using Concert™ Plant RNA Reagent extractor reagent (Invitrogen Corporation, Carlsbad, CA). The samples were then treated with the Turbo DNA-Free Kit (Applied Biosystems–Thermo Fisher Scientific, Vilnius, Lithuania) for total removal of genomic DNA. The quantity and purity of the RNA were measured with a ND-1000 Nanodrop® Spectrophotometer (Thermo Fisher Scientific, Wilmington, DE). The High-Capacity cDNA Reverse Transcription Kit (Invitrogen–Thermo Fisher Scientific, Vilnius, Lithuania) was used for the synthesis of cDNA from 1000 ng of RNA.
RT-qPCR
Analysis of gene expression by RT-qPCR employed ABI PRISM 7500 Real-Time PCR (Applied Biosystems–Thermo Fisher, Singapore), using SYBR Green (Applied Biosystems–Thermo Fisher Scientific). The cDNA was obtained from RNA extracted from the three tissues under study: non-embryogenic callus, embryogenic callus, and embryogenic cell suspension.
The thermal conditions of the reaction were 2 min at 50°C, 10 min at 95°C, followed by 40 cycles of 15 s at 95°C and 1 min at 60°C. Data were collected and stored in the program 7500 Fast Software (Version 2.3; Applied Biosystems–Thermo Fisher). Each reaction used 1 μL of cDNA (10 ng/μL), 0.2 μL of each primer (initial concentration of 10 μM), and 5.0 μL of Master Mix SYBR green UDG with ROX (Applied Biosystems–Thermo Fisher) for a final volume of 10.0 μL per sample. The samples were processed in technical triplicate. The results were normalized using Cq (quantification cycle), also known as the threshold cycle (Ct), obtained by the expression of the reference genes of ribosomal protein L39 (RPL39) and ribosomal protein 24S (24S; Freitas et al. 2017) present in the same reaction. The Cq was determined by the number of cycles in which the fluorescence generated within a reaction crossed the threshold line. The Pfaffl formula was used to calculate the relative expression (Pfaffl 2001).
Normalization was performed using the equation ΔCTtarget = CT (target gene) − CT (endogenous control) and ΔCTreference = CT (target gene) − CT (endogenous control). The calibration was determined by the formula EtargetΔCTtarget and EreferenceΔCTreference, where E is the efficiency value of the primers used. The calibrator was a sample used as the basis for comparative expression results. The relative quantification was obtained by the formula EtargetΔCTtarget / EreferenceΔCTreference (Pfaffl 2001).
Results
Analysis In Silico – CAFEST Database
The search for sequences forming the genes belonging to the ERF subfamily in CAFEST resulted in 179 reads, forming 30 EST-contigs and 37 singlets after the clustering process. Next, 27 EST-contigs and 21 singlets were selected through the conserved AP2 characteristic of the ERF/DREB family (Nakano et al. 2006). However, after analysis of the amino acid residues of the AP2 domain (Fig. 1), 15 EST-contigs and 5 singlets having the specific ammino acids of the ERF subfamily (Sakuma et al. 2002; Liu and Zhang 2017) remained; the sequences that did not show the specific amino acid residues of the ERF subfamily were excluded from the analyses.

Conserved amino acid residues (shaded in black) of the AP2 domain from EST-contigs and singlets that characterize the ERF (a) and DREB (b) subfamilies.
Phytozome Database
The search for sequences forming the genes belonging to the ERF subfamily in Phytozome database resulted in 254 reads, forming 103 Phy-contigs and 39 Phy-singlets after the clustering process. Then, based on the on the presence of the AP2 conserved domain, 108 sequences were selected. However, after analyzing the amino acid residues of the AP2 domain (Fig. 2), only 54 sequences, 35 Phy-contigs and 19 Phy-singlets, were found to display the specific amino acid residues of the ERF subfamily (Sakuma et al. 2002; Liu and Zhang 2017). The sequences that did not show the specific amino acid residues of the ERF subfamily were excluded from the analyses.
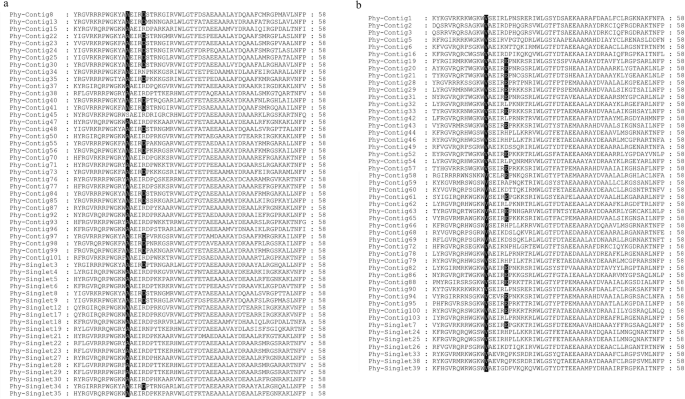
Conserved amino acid residues (shaded in black) of the AP2 domain from Phy-contigs and Phy-singlets that characterize the ERF (a) and DREB (b) subfamilies.
Phylogenetic Analysis
The 15 EST-contigs and 5 singlets obtained from the CAFEST and the 35 Phy-contigs and 19 Phy-singlets obtained from the Phytozome databases were submitted to phylogenetic analysis along with the SERF1 gene from Medicago truncatula and Glycine max and the ERFs gene of Coffea arabica described by Lima et al. (2011), with the aim of analyzing the phylogenetic distances among the studied sequences (Fig. 3).

Phylogenetic tree of all sequences (ETS-contigs and singlet, Phy-contigs, and Phy-singlets) belonging to the ERF subfamily, SERF1 gene of Medicago truncatula Gaertn., and ERFs gene of Coffea arabica L. (circles) EST-contigs and singlets, (diamonds) Phy-contigs e Phy-singlets, (squares) ERFs gene of coffee Coffea arabica, (triangles) genes MtSERF1, GmSERF1, and GmSERF2. The neighbor-joining algorithm was used to construct the tree by the method of p-distance and pair-wise suppression.
Figure 3 shows that the EST-contigs2, 4, 6, 7, 9, 10, 12, 17, 20, 21, 26, and 27 and the singlet36, along with Phy-contig99, Phy-contig92, Phy-singlet4, Phy-contig37, Phy-singlet12, Phy-contig50, Phy-contig77, Phy-contig101, Phy-contig93, Phy-singlet27, Phy-contig98, and Phy-contig47, grouped with the genes CaERF10, CaERF2, CaERF8, CaERF1, CaERF13, CaERF5, CaERF3, CaERF6, CaERF9, CaERF4, CaERF11, CaERF12, and CaERF15, respectively, forming independent clades with bootstrap values above 99. The gene SERF1 from Medicago truncatula and Glycine max formed a well-defined clade, grouping with Phy-contig97. However, none of the EST-contigs and singlets evaluated exhibited a high degree of similarity with these sequences, so they were not grouped with them.
The EST-contigs and singlets and Phy-contigs and Phy-singlets that clustered close to the CaERFs genes were submitted to alignment thorugh the ClustalW program (Thompson et al. 1994). The result obtained showed a high similarity among the sequences, allowing the observation of small differences in sequence length and identity (Online Resource 1). Considering the high similarity between the sequences found in the CAFEST and Phytozome databases, and the possibility of analyzing the in silico expression profile of the CAFEST sequences, through the Electronic Northern, only the EST-contigs and singlets were submitted to the aligment on the NCBI database through the Blastx tool (Table 2) for the comparison of the identity level of these sequences with those present in this database. As one can observe in Table 2, all sequences that grouped close to CaERF genes showed identity levels above 98%. In addition, CAFEST sequences allow the in silico expression analysis to be carried out through the Electronic Northern.
Expression Analysis by Electronic Northern
Gene expression analysis by means of Electronic Northern made it possible to gauge the expression levels of the EST-contigs and singlets in different tissues, thus allowing the prediction of probable sequences for the genes of interest (Fig. 4). The Electronic Northern consists of counting the reads that form each EST-contig and singlet, indicating the degree of expression of each sequence in the tissue of interest.

Electronic Northern representing the degree of expression of EST-contigs and singlets belonging to the ERF subfamily in the different libraries of Coffea arabica L. shown in grayscale where the darker the shade, the higher the degree of expression. The represented libraries are defined by Vieira et al. (2006). Libraries: BP1, cell suspension treated with acibenzolar-S-methyl; CB1, cell suspension treated with acibenzolar-S-methyl and brassinoesteroids; CL2, hypocotyls treated with acibenzolar-S-methyl; CS1, cell suspension treated with NaCl; EA1/IA/IA2, embryogenic calli; EM1/SI3, seeds at the beginning of germination; FB1/FB2/FB4, floral buds at different stages of flowering; FR1/FR2, flower buds and fruits in different stages; FR4, fruits (Coffea racemosa Lour.); CA1/IC1/PC1, non-embryogenic calli; LV4/LV5, young leaves of orthotropic branches; RT8, cells in suspension with aluminum stress; SH2, field plants with stress from water deficit (tissue pool). The figure was generated by the program TreeView.
Figure 4 shows that EST-contig6 was expressed in the tissues of the embryogenic calluses (EA1/IA1/IA2) and cell suspensions treated with acibenzolar-S-methyl and brassinosteroids (CB1); however, its greatest expression was in embryogenic calluses. The EST-contig9, as well as EST-contig6, was expressed in the libraries of embryogenic calluses and cells in suspension treated with acibenzolar-S-methyl and brassinosteroids (CB1), but a greater expression was observed in the library of the hypocotyls treated with acibenzolar-S-methyl (CL2; Fig. 4). The expression profile of EST-contig17 (Fig. 4) was varied, with expression in five tissues: cells in suspension treated with NaCl (CS1), embryogenic calli (EA1/IA1/IA2), flower buds in different stages of flowering (FB1/FB2/FB4), floral buds and fruits of different stages (FR1/FR2), and field plants with stress from water deficit (tissue pool; SH2). The EST-contig20 was expressed in cells in suspension treated with acibenzolar-S-methyl and brassinosteroids (CB1), and young leaves of orthotropic branches (LV4/LV5; Fig. 4). Similar to EST-contig6, 9, and 20, the sequence of EST-contig27 was expressed in the tissue of cells in suspension treated with acibenzolar-S-methyl and brassinosteroids (CB1); however, the expression of this EST-contig was also observed in the germinating seed library (whole seeds and zygotic embryos; EM1, SI3; Fig. 4). The expression of EST-contig28 was observed in both embryogenic callus (EA1/IA1/IA2) and non-embryogenic callus (CA1/IC1/PC1; Fig. 4). The singlets 10, 21, and 36 were expressed in cells in suspension treated with acibenzolar-S-methyl (BP1), cells in suspension treated with NaCl (CS1), and embryogenic calli (EA1/IA1/IA2), respectively (Fig. 4).
RT-qPCR Analysis of Relative Expression
The expression profiles of all the EST-contigs evaluated are shown in Fig. 5, with the relative expression levels of the sequences in the tissues of embryogenic callus, non-embryogenic callus, and embryogenic cells in suspension. The efficiency values for the primers used are shown in Table 1, with the reference genes used being the ribosomal protein L39 (RPL39) and the ribosomal protein 24S (24S) described by Freitas et al. (2017).

Profile of relative quantitative expression by qPCR of EST-contigs identified in Coffea arabica L. Columns represent the expression of gene transcripts in different tissues of coffee plants. (a) Quantitative expression of EST-contig6. (b) Quantitative expression of EST-contig9. (c) Quantitative expression of EST-contig27. All gene transcripts were normalized by the expression of multiple reference genes (RPL39 and 24S).
The expression profile of EST-contig6 was highly expressed in embryogenic tissues (Fig. 5a). The expression level of the embryogenic cell suspension sequence was approximately 5.6 times higher than in embryogenic callus cultures, reaching 423 times when compared with non-embryogenic callus lines. The expression value for embryogneic callus cultures was 75 times higher than that were non-embryogenic.
The expression profile of EST-contig9 (Fig. 5b) was similar to that of EST-contig6, where the highest expression was observed in embryogenic tissues. However, the level of EST-contig9 expression in these tissues was lower than that observed in EST-contig6. The expression of the sequence in embryogenic callus cultures and embryogenic cell suspensions was 93 and 164 times higher, respectively, than non-embryogenic callus tissues.
Expression levels of EST-contig27 were higher in the tissues of embryogenic callus cultures and embryogenic cell suspensions (Fig. 5c), where expression was 34 and 38.5 times higher, respectively, when compared with non-embryogenic callus cultures; however, there was no significant difference between embryogenic calluses and embryogenic cell suspensions.
Discussion
Analysis In Silico
The ERF/DREB family is characterized by having a unique AP2 domain (Nakano et al. 2006), whose size is between 50 and 70 amino acid residues (Allen et al. 1998). The search for motifs of clustering for the sequences obtained in the CAFEST and Phytozome databases returned a motif whose size was 58 amino acid residues and was highly conserved among sequences (Figs. 6 and 7). The obtained motif was submitted to conserved domain analysis, confirming that it is the conserved region of the AP2 domain.

Grouping motifs of putative Coffea arabica L. genes belonging to the ERF subfamily found in the CAFEST database. The identity levels among the amino acid residues is represented by grayscale, where the black color indicates greater identity and the white color no identity levels.

Grouping motifs of putative Coffea arabica L. genes belonging to the ERF subfamily found in the Phytozome database. The identity levels among the amino acid residues is represented by grayscale, where the black color indicates greater identity and the white color no identity levels.
According to the amino acid sequence, the ERF family can be divided into two subfamilies corresponding to ERF (Nakano et al. 2006), with the classification based on the presence of two amino acids conserved in the AP2 domain. In Arabidopsis thaliana and cotton, the ERF subfamily was observed to have alanine (A14) and aspartic acid (D19) in the 14th and 19th positions, respectively, whereas the DREB subfamily was observed to have valine (V14) and glutamic acid (E19) in these same positions (Sakuma et al. 2002; Liu and Zhang 2017). Thus, the analysis of conserved amino acid residues of EST-contigs and singlets belonging to the ERF subfamily resulted in 15 EST-contigs and 5 singlets related to the subfamily ERF (Fig. 1a), in addition to 8 EST-contigs and 8 singlets relative to the DREB subfamily (Fig. 1b), corroborating the results obtained for the other previously mentioned species. For the Phy-contigs and Phy-singlets, the analysis allowed the selection of 54 (35 Phy-contigs and 19 Phy-singlets) and 50 (43 Phy-contigs and 7 Phy-singlets) sequences belonging to the ERF and DREB subfamilies, respectively (Fig. 2a, b). These results are important since they corroborate previous findings in the literature, contributing to an assertive division between the two subfamilies.
Phylogenetic Analysis
Studies by Lima et al. (2011) on the genes related to the ethylene signaling pathway in coffee allowed the in silico identification of 13 ERF genes. Figure ure 3 shows that 12 EST-contigs and 1 singlet identified in the CAFEST database and the 9 Phy-contigs and 4 Phy-singlets identified in the Phytozome database are the same genes as those described by Lima et al. (2011), since they grouped together and were shown to be 100% identical (Table 2), being named according to the nomenclature proposed by Lima et al. (2011). This result was expected since the search performed in the Phytozome database used the PFAM number from the AP2 superfamily, allowing the identification of all sequences from this superfamily in this database. Similarly, in the CAFEST database, the same sequences identified by Lima et al. (2011) were also identified in this study, and this finding was expected, since the search on this database was performed using the sequence from the SERF1 gene, a member of the ERF subfamily (Mantiri et al. 2008b) that shares highly conserved domains characteristic of the ERF subfamily (Allen et al. 1998).
The unexpected result was the non-identification of the SERF1 gene in Coffea arabica in none of the databases analyzed because, as already mentioned, such a gene was the basis of the search in the CAFEST database. On the other hand, in the Phytozome database, Phy-contig97 grouped with SERF1 from Medicago trucatula and Glycine max, indicating that this contig could represent the SERF1 from Coffea arabica. However, the global aligment through the ClustalW program (Thompson et al. 1994) of these sequences (Online Resource 1) and the comparison of the identity levels of Phy-contig97 with sequences from the NCBI database did not allow the assertive identification of this gene as the SERF1 from Coffea arabica. However, the possibility of the non-existence of this gene in coffee should be considered since the SERF1 gene has been identified only in the species Medicago truncatula (Mantiri et al. 2008b) and soybean (Zheng et al. 2013).
Thus, despite the non-identification of the SERF1 gene, the discovery of 13 other genes in the CAFEST database belonging to the ERF subfamily was fundamental, since it allowed the analysis of possible involvement of these sequences in somatic embryogenesis in coffee. In addition, the identification of 108 sequences of the ERF subfamily in the Phytozome database suggests that other genes (not analyzed in our study) from this subfamily may possibly be involved in coffee somatic embryogenesis.
Expression Analysis by Electronic Northern
The in silico expression profiles of ERF genes obtained in CAFEST corroborate those described by Lima et al. (2011); however, this author’s work aimed at identifying genes that are members of the ethylene signaling pathway, and did not evaluate which of these genes may be related to the process of somatic embryogenesis. Thus, the EST-contigs and singlets that were expressed in the greatest number of embryogenic tissues, and in which they had their highest levels (EST-contig6, 9 and 27), were selected and evaluated in more detail.
Several studies have reported the expression of ERF genes in different tissues and treatments, and that they are responsible for several responses to biotic and abiotic stresses (Bouaziz et al. 2015; Dossa et al. 2016; Du et al. 2016; Liu and Zhang 2017); however, there have been few studies that have evaluated the involvement of these genes in somatic embryogenesis, with the studies by Mantiri et al. (2008a, 2008b), Zheng et al. (2013), and Silva et al. (2015) being the few available in the literature. Thus, the comparison of the selected EST-contigs and singlets with the genes described in these works can allow an evaluation of the importance of these sequences in the embryogenic process.
The expression of EST-contig6 in the libraries of the embryogenic calli (EA1/IA1/IA2) and cell suspension treated with acibenzolar-S-methyl and brassinosteroids (CB1) is interesting because Silva et al. (2015), when evaluating genes involved in somatic embryogenesis, identified a gene referred to as CaERF-like, which had a similar in silico expression profile. Likewise, the SERF1 gene, which belongs to the same subfamily, was identified in the study of Mantiri et al. (2008b), in which the genotypes Jemalong 2HA and wild-type Jemalong of Medicago truncatula were molecularly analyzed, the first being a mutant 500 times more embryogenic than the second (Rose et al. 1999). In addition, the genes of the ERF subfamily are important in response to biotic and abiotic stresses. Thus, exposure to jasmonic acid, salicylic acid, ethylene, and abscisic acid implies the regulation of various plant defense-signaling pathways (Bouaziz et al. 2015), and may induce the process of somatic embryogenesis. The expression of EST-contig6 in the library of the cell suspension treated with acibenzolar-S-methyl and brassinosteroids (CB1) corroborates data from the literature, since acibenzolar-S-methyl is a pesticide that causes plant stress and brassinosteroid is a plant hormone, forming the combination of stress and an important hormone for early embryogenesis (Rose and Nolan 2006).
Like EST-contig6, EST-contig9 was expressed in the previously mentioned tissues. However, its expression in hypocotyls treated with acibenzolar-S-methyl (CL2) is relevant because the hypocotyl is a part of the stem of the embryo or seedling and the SERF1 gene plays an important role in the induction of embryo formation (Mantiri et al. 2008a; Mantiri et al. 2008b), besides the ERF subfamily plays an important role in plant growth and development. In addition, hypocotyls were treated with acibenzolar-S-methyl, which is an exogenous substance and causes a defense response in the plant, such as the production of hormones. Kępczyńska et al. (2009) found that the addition of exogenous substances, such as abscisic acid, methyl jasmonate, and ethylene to culture media, improved the quality of Medicago sativa embryos. In the same work, these substances were related to the synthesis of ethylene, which is a hormone related to the expression of genes of the ERF subfamily.
In addition to the germinating seed library (whole seeds and zygotic embryos; EM1, SI3), EST-contig27 was expressed in cell suspension treated with acibenzolar-S-methyl and brassinosteroids (CB1). This result corroborates Mantiri et al. (2008b), who analyzed the expression of the SERF1 gene in somatic and zygotic embryos and observed that their expression in zygotic embryos was similar to the pattern observed in somatic embryos.
Electronic Northern analysis allowed the identification of three sequences, belonging to the ERF subfamily, EST-contig6, EST-contig9, and EST-contig27, which may be related to the embryogenic process in Coffea arabica (Fig. 4). The sequences obtained were submitted to gene expression analysis by RT-qPCR (Fig. 5) in the tissues of embryogenic calli, non-embryogenic calli, and cell suspension. This analysis aimed to verify the relative expression levels of the three sequences in the mentioned tissues in order to gauge and suggest their influence on somatic embryogenesis.
RT-qPCR Analysis of Relative Expression
The relative expression profiles obtained for the genes CaERF8, CaERF13, and CaEFR12 were compared with that of the genes MtSERF1 (Mantiri et al. 2008b), GmSERF1, GmSERF2 (Zheng et al. 2013), and CaERF-like (Silva et al. 2015) due to the fact that these genes are important in somatic embryogenesis and belong to the same subfamily. This comparison aimed to indicate the relationship of the identified genes with the embryogenic process, and to suggest possible molecular markers of this process in coffee.
The expression profiles of CaERF8 and CaERF13 are important because they attest to the results obtained in the Electronic Northern analysis, where the expression of these sequences in embryogenic tissues was observed. In addition, Mantiri et al. (2008b) evaluated the influence of ethylene on somatic embryogenesis and analyzed a genotype with high embryogenic capacity (Jemalong 2HA) and the wild-type (Jemalong) of Medicago truncatula. These authors identified the gene MtSERF1, the expression of which is induced by the presence of ethylene and is essential for the development of somatic embryogenesis. In the same study, the expression of the MtSERF1 gene was verified in the two previously mentioned genotypes and a high expression was observed in the highly embryogenic genotype, an observation not noticed in the other genotype, thus confirming its importance in the induction of embryo formation.
The expression levels of CaEFR12 were found to be higher in embryogenic tissues. This result is interesting because, as already mentioned, the SERF1 gene is essential for the development of somatic embryogenesis (Mantiri et al. 2008b), and so a high expression of the sequence in this tissue was expected, which was indeed observed. In soybean (Glycine max), Zheng et al. (2013) identified orthologs of the SERF1 gene that act together with the gene AGAMOUS-like15 in the induction of somatic embryogensis. Analyzing the gene expression of the orthologs identified in soybean, this author obtained the greatest expression of this sequence in the tissue of explants of immature cotyledons cultivated in culture medium inducing somatic embryogenesis, thus confirming the importance of this gene in this process, besides corroborating the result obtained for the CaEFR12 gene.
The only studies of the SERF1 gene available in the literature (Mantiri et al. 2008a; Mantiri et al. 2008b; Zheng et al. 2013) report it as a gene that acts directly on the process of somatic embryogenesis, being highly expressed in embryogenic tissues and with low expression in non-embryogenic tissues. In addition, Mantiri et al. (2008a) suggests that MtSERF1 shows biding sites to the promoter region of the WUSCHEL (WUS) gene, possibly acting in conjuction with this gene to regulate genes involved in somatic embryogenesis onset. The SERF1 gene from Coffea arabica was not identified in this study. Therefore, the comparison of its expression with the one observed for Coffea arabica WOX (WUSHEL-related HOMEOBOX) genes (Daude et al. 2020), which would show whether these genes act in a pattern similar to one observed by Mantiri et al. (2008a), could not be performed.
The expression profile obtained for the genes CaERF8, CaERF13, and CaEFR12 attest to the results described in the cited studies, indicating that these genes may be intrinsically linked to the mechanism of somatic embryogenesis in coffee. In addition, the expression of the genes CaERF8 and CaERF13 exclusively in embryogenic tissues is important, as it suggests the potential use of these sequences as molecular markers of somatic embryogenesis. Studies on genomic analysis during somatic embryogenesis in coffee have suggested the identification and characterization of two molecular markers of the embryogenic process: the genes somatic embryogenesis receptor-like kinases (SERK1) and baby boom-like (BBM; Silva et al. 2014, 2015).
The function of the gene SERK1 is correlated with the activation of the embryogenic process in somatic or zygotic cells through the identification of signaling molecules, in addition to its expression from the earliest stages of embryonic development of the globular stage of the embryo (Schmidt et al. 1997; Ikeda et al. 2006). Based on their function, homologs have been described in several species (Hecht et al. 2001; Nolan et al. 2003; Yang et al. 2011; Ma et al. 2012). In transcriptional analyses of SERK1 in Arabidopsis and coffee, Hecht et al. (2001) and Silva et al. (2014) obtained high gene expression in embryogenic tissues, if not observed for non-embryogneic tissues, thus proposing its use as a marker of the embryogenic process. However, even though it is a gene with its highest expression in embryogenic tissues, the fact that it has been expressed in non-embryogenic tissues could be a hindrance to its application as a molecular marker, since this may generate false positives.
Comparing the expression profile obtained for the genes CaERF8 and CaERF13 with the gene SERK1, identified and characterized in coffee as a molecular marker of somatic embryogenesis, a great difference in expression profiles can be observed. Expression of the gene CaSERK1 described by Silva et al. (2014) in the suspension of embryogenic cell tissue is approximately 10-fold lower when compared with the gene CaERF8, and 6-fold lower for the gene CaERF13. A significant difference in the expression level of these genes in embryogenic calli tissue is also observed, with the genes CaERF8 and CaERF13 being 7 and 14 times more expressed than the CaSERK1 gene, respectively. This comparison is important because it suggests that CaERF8 and CaERF13 are superior molecular markers than CaSERK1, since their expressions in embryogenic tissues were superior. This result is fundamental, as it can direct the study of these genes in other species in order to evaluate the embryogenic capacity of the species or material used.
In the work of Silva et al. (2015), the same evaluation of the expression of the gene CaBBM in tissues similar to that used in the present study obtained high expression in the embryogenic tissues, and no expression in non-embryogenic tissue. This expression profile resembles that obtained for the genes CaERF8 and CaERF13, demonstrating the possibility of using these as molecular markers since they belong to the same superfamily (AP2/EREBP). However, an important factor in the selection of a marker gene is the function the gene performs during the process, with BBM being related to cellular proliferation and embryogenic processes (Passarinho et al. 2008; El Ouakfaoui et al. 2010), while genes belonging to the ERF subfamily are related to plant growth and development, as well as responses to biotic and biotic stresses (Bouaziz et al. 2015). Thus, the analysis of these factors is important because, depending on the stage of tissue development, they can directly influence the use of these genes as molecular markers. The results obtained in the analysis of the relative expressions of the genes CaERF8 and CaERF13 will enable future studies aimed at validating these genes as molecular markers, as well as evaluating their relationship to the regulation of somatic embryogenesis Coffea arabica.
Conclusion
The EST-contig6, 9, and 27 were found to correpond to CaERF8, CaERF12, and CaERF13 genes from Coffea arabica. The RT-qPCR analyses of relative expression of the identified genes indicated that CaERF8, CaERF12, and CaERF13 could be directly linked to somatic embryogenesis. In addition, the expression levels of CaERF8 and CaERF13 in tissues of embryogenic callus cultures and embryogenic cell suspensions indicate that they may be markers of somatic embryogenesis in Arabic coffee.
References
Allen MD, Yamasaki K, Ohme-Takagi M, Tateno M, Suzuki M (1998) A novel mode of DNA recognition by a β-sheet revealed by the solution structure of the GCC-box binding domain in complex with DNA. EMBO J 17:5484–5496. https://doi.org/10.1093/emboj/17.18.5484
Altschul SF, Gish W, Miller W, Myers EW, Lipman DJ (1990) Basic local alignment search tool. J Mol Biol 215:403–410. https://doi.org/10.1016/S0022-2836(05)80360-2
Altschul SF, Madden TL, Schäffer AA, Zhang J, Zhang Z, Miller W, Lipman DJ (1997) Gapped BLAST and PSI BLAST: a new generation of protein database search programs. Nucleic Acids Res 25:3389–3402. https://doi.org/10.1093/nar/25.17.3389
Bailey TL, Boden M, Buske FA, Frith M, Grant CE, Clementi L, Ren J, Li WW, Noble WS (2009) MEME SUITE: tools for motif discovery and searching. Nucleic Acid Res 37:202–208. https://doi.org/10.1093/nar/gkp335
Barreto HG, Lazzari F, Ságio SA, Chalfun-Junior A, Paiva LV, Benedito VA (2012) In silico and quantitative analyses of the putative FLC-like homologue in coffee (Coffea arabica L.). Plant Mol Biol Rep 30:29–35. https://doi.org/10.1007/s11105-011-0310-9
Bouaziz D, Charfeddine M, Jbir R, Saidi MN, Pirrello J, Charfeddine S, Bouzayen M, Gargouri-Bouzid R (2015) Identification and functional characterization of ten AP2/ERF genes in potato. Plant Cell Tiss Org Cult 123:155–172. https://doi.org/10.1007/s11240-015-0823-2
Boycheva I, Vassileva V, Revalska M, Zehirov G, Iantcheva A (2017) Different functions of the histone acetyltransferase HAC1 gene traced in the model species Medicago truncatula, Lotus japonicus and Arabidopsis thaliana. Protoplasma 254:697–711. https://doi.org/10.1007/s00709-016-0983-x
Campos NA, Panis B, Carpentier SC (2017) Somatic embryogenesis in coffee: the evolution of biotechnology and the integration of omics technologies offer great opportunities. Frontiers Plant Sci 8:1460. https://doi.org/10.3389/fpls.2017.01460
Carvalho A, Medina Filho HP, Fazuoli LC, Guerreiro Filho O, Lima MMA (1991) Aspectos genéticos do cafeeiro. Revista Brasileira de Genética 14:135–183
Carvalho AMD, Cardoso DDA, Carvalho GR, Carvalho VLD, Pereira AA, Ferreira AD, Carneiro LF (2017) Comportamento de cultivares de cafeeiro sob a incidência das doenças da ferrugem e cercosporiose em dois ambientes de cultivo. Coffee Sci 12:100–107
Carvalho VL, Da Cunha RL, Silva NRN (2012) Alternativas de controle de doenças do cafeeiro. Coffee Sci 7:42–49
Chen L, Han J, Deng X, Tan S, Li L, Li L, Zhou J, Peng H, Yang G, He G, Zhang W (2016) Expansion and stress responses of AP2/EREBP superfamily in Brachypodium distachyon. Sci Rep 6:1–14. https://doi.org/10.1038/srep21623
Collard BCY, Jahufer MZZ, Brouwer JB, Pang ECK (2005) An introduction to markers, quantitative trait loci (QTL) mapping and marker-assisted selection for crop improvement: the basic concepts. Euphytica 142:169–196. https://doi.org/10.1007/s10681-005-1681-5
da Rosa SDVF, Carvalho AM, McDonald MB, Von Pinho ERV, Silva AP, Veiga AD (2011) The effect of storage conditions on coffee seed and seedling quality. Seed Sci Technol 39:151–164. https://doi.org/10.15258/sst.2011.39.1.13
Daude MM, Silva TWDS, Freitas NC, Ságio SA, Paiva LV, Barreto HG (2020) Transcriptional analysis of WUSCHEL-related HOMEOBOX (WOX) genes in Coffea arabica L. Biologia 1-13. https://doi.org/10.2478/s11756-020-00460-8
Dossa K, Wei X, Li D, Fonceka D, Zhang Y, Wang L, Yu J, Boshou L, Diouf D, Cissé N, Zhang X (2016) Insight into the AP2/ERF transcription factor superfamily in sesame and expression profiling of DREB subfamily under drought stress. BMC Plant Biol 16:171. https://doi.org/10.1186/s12870-016-0859-4
Du C, Hu K, Xian S, Liu C, Fan J, Tu J, Fu T (2016) Dynamic transcriptome analysis reveals AP2/ERF transcription factors responsible for cold stress in rapeseed (Brassica napus L.). Mol Genetics Genomics 291:1053–1067. https://doi.org/10.1007/s00438-015-1161-0
Eisen MB, Spellman PT, Brown PO, Botstein D (1998) Cluster analysis and display of genome-wide expression patterns. Proc Natl Acad Sci 95:14863–14868
El Ouakfaoui S, Schnell J, Abdeen A, Colville A, Labbé H, Han S (2010) Control of somatic embryogenesis and embryo development by AP2 transcription factors. Plant Mol Biol 74:313–326. https://doi.org/10.1007/s11103-010-9674-8
Feng CZ, Chen Y, Wang C, Kong YH, Wu WH, Chen YF (2014) Arabidopsis RAV1 transcription factor, phosphorylated by SnRK2 kinases, regulates the expression of ABI3, ABI4, and ABI5 during seed germination and early seedling development. Plant J 80:654–668. https://doi.org/10.1111/tpj.12670
Freitas NC, Barreto HG, Fernandes-Brum CN, Moreira RO, Chalfun-Junior A, Paiva LV (2017) Validation of reference genes for qPCR analysis of Coffea arabica L. somatic embryogenesis-related tissues. Plant Cell Tiss Org Cult 128:663–678. https://doi.org/10.1007/s11240-016-1147-6
Hecht V, Vielle-Calzada JP, Hartog MV, Schmidt ED, Boutilier K, Grossniklaus U, de Vries SC (2001) The Arabidopsis SOMATIC EMBRYOGENESIS RECEPTOR KINASE 1 gene is expressed in developing ovules and embryos and enhances embryogenic competence in culture. Plant Physiol 127:803–816. https://doi.org/10.1104/pp.010324
Huang Y, Lan QY, Hua Y, Luo YL, Wang XF (2014) Desiccation and storage studies on three cultivars of Arabic coffee. Seed Sci Technol 42:60–67. https://doi.org/10.15258/sst.2014.42.1.06
Ikeda Y, Banno H, Niu QW, Howell SH, Chua NH (2006) The ENHANCER OF SHOOT REGENERATION 2 gene in Arabidopsis regulates CUP-SHAPED COTYLEDON 1 at the transcriptional level and controls cotyledon development. Plant Cell Physiol 47:1443–1456. https://doi.org/10.1093/pcp/pcl023
Ikeda-Iwai M, Umehara M, Satoh S, Kamada H (2003) Stress-induced somatic embryogenesis in vegetative tissues of Arabidopsis thaliana. Plant J 34:107–114. https://doi.org/10.1046/j.1365-313X.2003.01702.x
Itaya A, Zheng S, Simmonds D (2018) Establishment of neomycin phosphotransferase II (nptII) selection for transformation of soybean somatic embryogenic cultures. In Vitro Cell Dev Biol - Plant 54:1–11. https://doi.org/10.1007/s11627-017-9875-9
Kępczyńska E, Ruduś I, Kępczyński J (2009) Abscisic acid and methyl jasmonate as regulators of ethylene biosynthesis during somatic embryogenesis of Medicago sativa L. Acta Physiol Plant 31:1263–1270. https://doi.org/10.1007/s11738-009-0363-7
Kumar S, Stecher G, Tamura K (2016) MEGA7: Molecular Evolutionary Genetics Analysis version 7.0 for bigger datasets. Mol Biol Evol 33:1870–1874. https://doi.org/10.1093/molbev/msw054
Kumaravel M, Uma S, Backiyarani S, Saraswathi MS, Vaganan MM, Muthusamy M, Sajith KP (2017) Differential proteome analysis during early somatic embryogenesis in Musa spp. AAA cv. Grand Naine. Plant Cell Rep 36:163–178. https://doi.org/10.1007/s00299-016-2067-y
Li XJ, Li M, Zhou Y, Hu S, Hu R, Chen Y, Li XB (2015) Overexpression of cotton RAV1 gene in Arabidopsis confers transgenic plants high salinity and drought sensitivity. PLoS One 10:e0118056. https://doi.org/10.1371/journal.pone.0118056
Lima AA, Ságio SA, Chalfun-Junior A, Paiva LV (2011) In silico characterization of putative members of the coffee (Coffea arabica) ethylene signaling pathway. Genet Mol Res 10:1277–1289. https://doi.org/10.4238/vol10-2gmr1314
Liu C, Zhang T (2017) Expansion and stress responses of the AP2/EREBP superfamily in cotton. BMC Genomics 18:118. https://doi.org/10.1186/s12864-017-3517-9
Ma J, He Y, Wu C, Liu H, Hu Z, Sun G (2012) Cloning and molecular characterization of a SERK gene transcriptionally induced during somatic embryogenesis in Ananas comosus cv. Shenwan. Plant Mol Biol Rep 30:195–203. https://doi.org/10.1007/s11105-011-0330-5
Mantiri FR, Kurdyukov S, Chen S-K, Rose RJ (2008a) The transcription factor MtSERF1 may function as a nexus between stress and development in somatic embryogenesis in Medicagotruncatula. Plant Signal Behav 3(7):498–500. https://doi.org/10.4161/psb.3.7.6049
Mantiri FR, Kurdyukov S, Lohar DP, Sharopova S, Saeed NA, Wang XD, VandenBosch KA, Rose RJ (2008b) The transcription factor MtSERF1 of the ERF subfamily identified by transcriptional profiling is required for somatic embryogenesis induced by auxin plus cytokinin in Medicago truncatula. Plant Physiol 146:1622–1636. https://doi.org/10.1104/pp.107.110379
MAPA: Ministério da Agricultura, Pecuária e Abastecimento2017. Cultura do café. http://www.agricultura.gov.br/.Accessed.
Murashige T, Skoog F (1962) A revised medium for rapid growth and bio assays with tobacco tissue cultures. Physiol Plant 15:473–497. https://doi.org/10.1111/j.1399-3054.1962.tb08052.x
Nakano T, Suzuki K, Fujimura T, Shinshi H (2006) Genome-wide analysis of the ERF gene family in Arabidopsis and rice. Plant Physiol 140:411–432. https://doi.org/10.1104/pp.105.073783
Nic-Can GI, López-Torres A, Barredo-Pool F, Wrobel K, Loyola-Vargas VM, Rojas-Herrera R, De-la-Peña C (2013) New insights into somatic embryogenesis: LEAFY COTYLEDON1, BABY BOOM1 and WUSCHEL-RELATED HOMEOBOX4 are epigenetically regulated in Coffea canephora. PLoS One 8:e72160. https://doi.org/10.1371/journal.pone.0072160
Nolan KE, Irwanto RR, Rose RJ (2003) Auxin up-regulates MtSERK1 expression in both Medicago truncatula root-forming and embryogenic cultures. Plant Physiol 133:218–230. https://doi.org/10.1104/pp.103.020917
Nolan KE, Song Y, Liao S, Saeed NA, Zhang X, Rose RJ (2014) An unusual abscisic acid and gibberellic acid synergism increases somatic embryogenesis, facilitates its genetic analysis and improves transformation in Medicago truncatula. PLoS One 9:e99908. https://doi.org/10.1371/journal.pone.0099908
Passarinho P, Ketelaar T, Jeroen van Arkel XM, Maliepaard C, Hendriks MW, Joosen R, Lammers M, Herdies L, den Boer B, van der Geest L, Boutilier K (2008) BABY BOOM target genes provide diverse entry points into cell proliferation and cell growth pathways. Plant Mol Biol 68:225–237. https://doi.org/10.1007/s11103-008-9364-y
Pfaffl MW (2001) A new mathematical model for relative quantification in real-time RT–PCR. Nucleic Acid Res 29:45–45. https://doi.org/10.1093/nar/29.9.e45
Piyatrakul P, Putranto R-A, Martin F, Rio M, Dessailly F, Leclercq J, Dufayard J-F, Lardet L, Montoro P (2012) Some ethylene biosynthesis and AP2/ERF genes reveal a specific pattern of expression during somatic embryogenesis in Hevea brasiliensis. BMC Plant Biol 12:244. https://doi.org/10.1186/1471-2229-12-244
Rose RJ, Nolan KE (2006) Genetic regulation of somatic embryogenesis with particular reference to Arabidopsis thaliana and Medicago truncatula. In Vitro Cell Dev Biol - Plant 42:473–481. https://doi.org/10.1079/IVP2006806
Rose RJ, Nolan KE, Bicego L (1999) The development of the highly regenerable seed line Jemalong 2HA for transformation of Medicago truncatula—implications for regenerability via somatic embryogenesis. J Plant Physiol 155:788–791. https://doi.org/10.1016/S0176-1617(99)80097-2
Ságio SA, Barreto HG, Lima AA, Moreira RO, Rezende PM, Paiva LV, Chalfun-Junior A (2014) Identification and expression analysis of ethylene biosynthesis and signaling genes provides insights into the early and late coffee cultivars ripening pathway. Planta 239:951–963. https://doi.org/10.1007/s00425-014-2026-1
Saitou N, Nei M (1987) The neighbor-joining method: a new method for reconstructing phylogenetic trees. Mol Biol Evol 4:406–425
Sakuma Y, Liu Q, Dubouzet JG, Abe H, Shinozaki K, Yamaguchi-Shinozaki K (2002) DNA-binding specificity of the ERF/AP2 domain of Arabidopsis DREBs, transcription factors involved in dehydration-and cold-inducible gene expression. Biochem Biophys Res Commun 290:998–1009. https://doi.org/10.1006/bbrc.2001.6299
Schmidt ED, Guzzo F, Toonen MA, De Vries SC (1997) A leucine-rich repeat containing receptor-like kinase marks somatic plant cells competent to form embryos. Development 124:2049–2062
Sharma MK, Kumar R, Solanke AU, Sharma R, Tyagi AK, Sharma AK (2010) Identification, phylogeny, and transcript profiling of ERF family genes during development and abiotic stress treatments in tomato. Mol Genet Genomics 284:455–475. https://doi.org/10.1007/s00438-010-0580-1
Shigyo M, Ito M (2004) Analysis of gymnosperm two-AP2-domain-containing genes. Develop Gene Evol 214:105–114. https://doi.org/10.1007/s00427-004-0385-5
Silva AT, Barduche D, do Livramento KG, Ligterink W, Paiva LV (2014) Characterization of a putative SERK-like ortholog in embryogenic cell suspension cultures of Coffea arabica L. Plant Mol Biol Rep 32:176–184. https://doi.org/10.1007/s11105-013-0632-x
Silva AT, Barduche D, do Livramento KG, Paiva LV (2015) A putative BABY BOOM-like gene (CaBBM) is expressed in embryogenic calli and embryogenic cell suspension culture of Coffea arabica L. In Vitro Cell Dev Biol - Plant 51:93–101. https://doi.org/10.1007/s11627-014-9643-z
Silva AT, Paiva LV, Andrade AC, Barduche D (2013) Identification of expressed sequences in the coffee genome potentially associated with somatic embryogenesis. Genet Mol Res 12:1698–1709. https://doi.org/10.4238/2013.May.21.1
Sitnikova T, Rzhetsky A, Nei M (1995) Interior-branch and bootstrap tests of phylogenetics trees. Mol Biol Evol 12:319–333. https://doi.org/10.1093/oxfordjournals.molbev.a040205
Teixeira JB, Junqueira CS, Pereira AJPDC, Mello RISD, Silva APDD, Mundim DA (2004) Multiplicação clonal de café (Coffea arabica L.) via embriogênese somática. Documentos 121. Brasília, Embrapa.
Thompson JD, Higgins DG, Gibson TJ (1994) CLUSTAL W: improving the sensitivity of progressive multiple sequence alignment through sequence weighting, position-specific gap penalties and weight matrix choice. Nucleic Acid Res 22:4673–4680. https://doi.org/10.1093/nar/22.22.4673
Tonietto Â, Sato JH, Teixeira JB, de Souza EM, Pedrosa FO, Franco OL, Mehta A (2012) Proteomic analysis of developing somatic embryos of Coffea arabica. Plant Mol Biol Rep 30:1393–1399. https://doi.org/10.1007/s11105-012-0425-7
Torres LF, LEC D, do Livramento KG, Freire LL, Paiva LV (2015) Gene expression and morphological characterization of cell suspensions of Coffea arabica L. cv. Catiguá MG2 in different cultivation stages. Acta Physiol Plant 37:175. https://doi.org/10.1007/s11738-015-1924-6
Tvorogova VE, Fedorova YA, Zhang F, Lutova LA (2016) STENOFOLIA gene and regulation of somatic embryogenesis in Medicago truncatula. Russian J Plant Physiol 63:811–821. https://doi.org/10.1134/S1021443716060133
vanBoxtel J, Berthouly M (1996) High frequency somatic embryogenesis from coffee leaves. Factors influencing embryogenesis and subsequent proliferation and regeneration in liquid medium. Plant Cell Tiss Org Cult 44:4–17. https://doi.org/10.1007/BF00045907
Vieira LGE, Andrade AC, Colombo CA, Moraes AHA, Metha Â, Oliveira AC, Labate CA, Marino CL, Monteiro-Vitorello CB, Monte DC, Giglioti É, Kimura ET, Romano E, Kuramae EE, Lemos EGM, ERP A, Jorge ÉC, Albuquerque ÉVS, Silva FR, Vinecky F, Sawazaki HE, Dorry HFA, Carrer H, Abreu IN, Batista JAN, Teixeira JB, Kitajima JP, Xavier KG, Lima LM, LEA C, Pereira LFP, Coutinho LL, Lemos MVF, Romano MR, Machado MA, Costa MMC, MFG S, Goldman MHS, Ferro MIT, Tinoco MLP, Oliveira MC, van Sluys MA, Shimizu MM, Maluf MP, MTS E, Guerreiro Filho O, Arruda P, Mazzafera P, Mariani PDSC, RLBC O, Harakava R, Balbao SF, Tsai SM, SMZ M, Santos SN, Siqueira WJ, Costa GGL, Formighieri EF, Carazzolle MF, Pereira GAG (2006) Brazilian coffee genome project: an EST-based genomic resource. Brazilian J Plant Physiol 18:95–108. https://doi.org/10.1590/S1677-04202006000100008
Wiśniewska A, Grabowska A, Pietraszewska-Bogiel A, Tagashira N, Zuzga S, Wóycicki R, Przybecki Z, Malepszy S, Filipecki M (2012) Identification of genes up-regulated during somatic embryogenesis of cucumber. Plant Physiol Biochem 50:54–64. https://doi.org/10.1016/j.plaphy.2011.09.017
Yang C, Zhao T, Yu D, Gai J (2011) Isolation and functional characterization of a SERK gene from soybean (Glycine max (L.) Merr.). Plant Mol Biol Rep 29:334–344. https://doi.org/10.1007/s11105-010-0235-8
Zamarripa A, Ducos JP, Bollon H, Dufour M, Petiard V (1991) Production d’embryons somatiques de caféier en milieu liquide: effets densité d’inoculation et renouvellement du milieu. Café Cacao Thé 35:233–244
Zheng Q, Zheng Y, Ji H, Burnie W, Perry SE (2016) Gene regulation by the AGL15 transcription factor reveals hormone interactions in somatic embryogenesis. Plant Physiol 172:2374–2387. https://doi.org/10.1104/pp.16.00564
Zheng Q, Zheng Y, Perry SE (2013) AGAMOUS-Like15 promotes somatic embryogenesis in Arabidopsis and soybean in part by the control of ethylene biosynthesis and response. Plant Physiol 161:2113–2127. https://doi.org/10.1104/pp.113.216275
Zhu HG, Cheng WH, Tian WG, Zhu HG, Cheng WH, Tian WG, Li YJ, Liu F, Xue F, Zhu QH, Sun YQ, Sun J (2018) iTRAQ-based comparative proteomic analysis provides insights into somatic embryogenesis in Gossypium hirsutum L. Plant Mol Biol 96:89–102. https://doi.org/10.1007/s11103-017-0681-x
Zimmerman JL (1993) Somatic embryogenesis: a model for early development in higher plants. Plant Cell 5:1411. https://doi.org/10.1105/tpc.5.10.1411
Acknowledgments
This research was supported by the Fundação de Amparo à Pesquisa de Minas Gerais (FAPEMIG), Coordenação de Aperfeiçoamento de Pessoal de Nível Superior (CAPES), and Conselho Nacional de Desenvolvimento Científico e Tecnológico (CNPq).
Author information
Authors and Affiliations
Corresponding author
Additional information
Editor: Todd Jones
Electronic supplementary material
ESM 1
(DOCX 10238 kb)
Rights and permissions
About this article

Cite this article
Daude, M.M., Freitas, N.C., Ságio, S.A. et al. Molecular analysis of ERF subfamily genes during coffee somatic embryogenesis. In Vitro Cell.Dev.Biol.-Plant 57, 128–142 (2021). https://doi.org/10.1007/s11627-020-10120-w
Received:
Accepted:
Published:
Issue Date:
DOI: https://doi.org/10.1007/s11627-020-10120-w