
Abstract
Described is a hybrid metal additive manufacturing (AM) method that integrates in situ laser shock peen (LSP) forming with laser powder bed fusion (PBF) to mitigate vertical distortions during part builds. LSP has recently been proposed to reduce tensile residual stresses during selective laser melting (SLM). The effects of LSP on part distortion, however, have not been rigorously examined. It is proposed here that SLM can be integrated with in situ LSP forming to reduce distortion of the upper surface of parts during or after printing. To study the distortion correction capability, a 2-stage computational framework is created, which includes physics-based models of the SLM process and LSP treatment. Stage 1 includes thermomechanical SLM simulation to predict surface geometry and is applied to model four 50-μm layers of a 316L part having a 4 mm × 4 mm footprint. Stage 2 of the framework includes an elastic-plastic thermomechanical shock-wave simulation to predict LSP surface treatment forming effects. Surface distortion is examined for varying laser spot size, overlap, and part temperatures from 300 to 500 K, using a nanosecond-pulsed infrared laser. For the 316L SLM sample, the upper surface is predicted to have \(\sim \) 9-μm vertical distortion on the 200-μm 4-layer build. With a 2-μm allowable distortion, only 44.13% of the surface initially conforms. After one LSP forming treatment at 300 K, conformance improves to 84.75%. After a third LSP forming, with 50% laser power-density increase, surface conformance increases to 91%, demonstrating potential of the hybrid AM-LSP process in reducing finish-machining.
1 Introduction
Laser powder bed fusion is an additive manufacturing technology wherein a laser scans and subsequently fuses layers of metal powder particles [1] to incrementally build the desired 3D geometry, as shown schematically in Fig. 1 (left). Upon completion of each scanned layer, a recoater blade spreads (or deposits) a new layer of powder atop the fused part and its surrounding powder. The deposition, selective melting, and fusion process are repeated until the maximum part height is obtained. A still image captured on an EOS M 290 printer during SLM of 316L to build two spur gears is seen in Fig. 1 (right). While parts having geometries difficult to attain using conventional manufacturing methods can be produced using SLM, several factors play a crucial role in realizing desirable macroscopic properties of the printed parts. For instance, the transient temperature distribution not only influences dimensions of the melt pool and heat affected zone, which govern microstructure evolution and material properties, but the coupled thermomechanical behavior also establishes residual stress fields that lead to associated geometric distortions [3]. Indeed, a major limitation in SLM is the undesired buildup of tensile residual stress (TRS) resulting from each newly melted surface layer shrinking during the liquid-solid transformation. The surface layer shrinkage is limited by the presence of previously solidified, underlying layers and is therefore attributed to delamination and warping effects. As layers are deposited and TRS accumulates, anisotropy in mechanical properties is also observed, [4, 5]. Since TRS, when located inappropriately, poses detrimental effects to the mechanical performance due to reduced fatigue life and low magnitudes of critical stress required for crack propagation, post-treatment processes including hot isostatic pressing [6,7,8] and furnace post sintering [9] have been applied to mitigate TRS. In addition, laser shock peening surface engineering post-treatments have been observed to modify residual stresses (RS) in SLM samples [4, 5, 10] through imparting near-surface compressive residual stresses (CRS), the benefits of which include mitigating detrimental TRS, reducing rates of crack propagation, decreasing stress intensity factors, and improving fatigue crack closure phenomena [11].

(Left) A side-view schematic of the SLM process. (Right) A photograph capturing an SLM scan in progress on an EOS M 290 printer. Note: scan speeds can achieve 7 m s− 1 [2], making the moving circular laser spot appear as a line or band
From the discussion above, it can be appreciated that SLM may produce undesired distortions in addition to TRS in printed parts. While measures to address both issues require further understanding, current research into LSP focuses primarily on mitigation of TRS. Indeed, very limited research exists regarding prediction of distortion in SLM, let alone mitigating its occurrence. As detailed later in Section 2, a peak vertical (build direction) distortion of \(\sim \) 9 μm is predicted to occur during the deposition of just four 50-μm layers (200-μm build height) for a 316L solid block, thus indicating \(\sim \) 4.5% vertical dimension error. In the absence of a corrective finishing process, such dimensional inaccuracy may obviously lead to part rejection. The vertical distortion type of printing error addressed in this work is known as “super elevation” [13, 14]. Similar distortion behavior has been observed by Li et al. [15] through a multiscale modeling approach. They observed concave deflection of the part during scanning, as a result of heat accumulation. Upon cooling, however, convex deflection was observed, wherein the edges (and particularly the corners) of the part rose (or lifted) toward the heat source, while central regions appeared to deflect away from the heat source. Note that a level top surface is important to ensure uniform thickness of the subsequent layer during recoating, since non-uniform thickness will have undesired influence on the melting and solidification characteristics. Recent studies into roughness generation in metal AM also provide insights into part distortion. For example, in 2017, Shrestha and Chou used white-light interferometry to quantify surface roughness statistics for an electron beam additively manufactured (EBAM) Ti-6Al-4V part [12]. They observed that increased scan speed slightly increased the surface roughness along the scan direction, and that hatch spacing noticeably influenced surface roughness in the transverse direction (i.e., perpendicular to the scan lines). Their beam had a diameter of 650 μm while the hatch spacing was only 200 μm, ensuring overlap between successive scan lines. Figure 2 (left) shows the contour plot of the top surface of a 1.2 mm × 1.2 mm arbitrarily selected region from their study, wherein two lines are indicated that correspond to linear paths where the surface profile was measured using white-light interferometry. Figure 2 (right) illustrates the topography and corresponding roughness metrics of the top surface along these two lines. Note that the indicated roughness metric Rt (range) pertains to distortion in that it represents vertical distance between the highest and lowest points along the respective measurement line. Although the transverse profile (blue line) shows a relatively wavy trend (that appears to vary with hatch spacing), Rt is approximately 17.4-μm along both lines, thus indicating distortion as well as roughness.

(Left) Contour plot of the top surface of a 1.2 mm × 1.2 mm arbitrarily selected region of the EBAM part. (Right) Surface profiles mapped using white-light interferometry along the scan (red) and transverse (blue) directions, adapted with permission from [12]
To date, published studies from very few research groups directly relate the use of LSP to correct or mitigate undesired distortion arising in SLM. Kalentics et al. (2019) briefly discuss using LSP to reduce distortion [16] as part of their efforts to mitigate TRS. Their experimental approach was ex situ to the SLM in that the part was removed from the powder bed (after printing some number of layers) to perform LSP elsewhere at room temperature. The part was then carefully repositioned within the SLM printer, with this cyclic process repeated until part completion. Details on the LSP strategy to reduce surface distortion were not explained. Furthermore, the influence of LSP environment temperature on the outcome was not examined. Given that the intent was to reduce TRS magnitude and convert undesirable surface TRS to CRS, it is plausible that the authors applied an LSP shot pattern that systematically covered the entire upper surface [4]. Another, very recent article in which the same LSP treatment concept is discussed is that of Lu et al. [17]. After several SLM layers were built, LSP was performed without using a sacrificial ablative surface coating. The rationale for not using the ablative coating was that the work focused on both inducing CRS as well as increasing the surface roughness (hence no coating) to explore better interlayer fusion. Lu et al. similarly discuss removal of the part from the SLM environment following the deposition of a few layers to conduct an ex situ LSP before repositioning the part again within the printer for subsequent layer deposition. Thus, the work of Lu et al. describes the same approach and experimental configuration to that of Kalentics et al., except for the use of LSP without the sacrificial ablative coating to promote increased surface roughness. The resulting effects on residual stress, microhardness, dislocation patterns, and grain morphology were also examined. Any mention of distortion measurement and/or subsequent correction using LSP was not included in Lu et al.’s work, however.
Motivation for distortion correction using LSP forming can also be gained from studies involving non-metal-lic materials. In 2019, Shukla et al. investigated shock-wave-induced near-surface compressive stresses in Al2O3 (alumina ceramic) imparted by LSP [18]. They used a spot diameter of 800 μm and pulse energies of 1 J, 1.5 J, and 1.7 J, and found that increasing the power density increased the material removal rate (MRR), which led to rougher surface topography. Interestingly, while roughness was found to increase, the surface height variation (i.e., distortion) was observed to decrease with an increase in the laser energy, as seen in Fig. 3.

3D profile of the top surface of Al2O3 a prior to LSP treatment, b post-LSP treatment with 1 J, c post-LSP treatment with 1.5 J, and d post-LSP treatment with 1.7 J, adapted with permission from [18]
Thus, such results, albeit for a ceramic, serve as further motivation to investigate any potentially beneficial effects that LSP forming can have on correcting undesirable distortion in SLM. While existing research into LSP application to SLM is focused on transforming undesired TRS to beneficial CRS, it is hypothesized in this work that if the surface distortion arising during SLM is known, then an in situ LSP forming strategy can be devised to correct the distortion to some useful extent. The idea is also supported by the discussion on LSP forming by Hackel et al. [19], who experimentally demonstrated the ability to correctively reshape AM components to a high degree of precision using LSP treatment. Since the effects of LSP on RS have already been examined in other studies, such discussion is omitted in the present work, which instead focuses on use of LSP to control the thermomechanically induced surface distortion that arises in SLM.
Accordingly, Section 2 of this paper describes a phy-sics-based thermomechanical model to predict the surface topography and corresponding distortion that evolves during the SLM build process. Section 3 describes the computational model used to predict the effects of LSP forming. Also included in Section 3 are spatial and temporal characterizations of the nanosecond-pulsed infrared laser used in the forming studies. Section 4 proposes a systematic, in situ LSP forming strategy, and gives sample results on the mitigation of SLM-induced surface distortion for a 316L stainless steel build. Results and discussion for a parametric study of the LSP forming technique are provided in Section 5. The study assesses the influence of assuming a simplified laser spatial profile, in addition to evaluating the effects of laser spot size and overlap, forming temperature, and increased laser power density to counteract stain-hardening behavior when conducting multiple LSP forming treatments.
2 Laser powder bed fusion numerical model
A transient thermomechanical finite element (FE) model is used to predict the thermally induced distortion arising in the SLM process. Details of the thermal, mechanical, and laser heat source sub-models comprising the thermomechanical simulation are provided in Sections 2.1 to 2.3, respectively. The model geometry and SLM scan pattern is shown in Fig. 4. It includes a 3D linear hexahedral Lagrangian mesh consisting of coupled temperature-displacement elements with reduced integration (C3D8RT). A uniform 50-μm mesh size that balances computational expense and accuracy is used. The same bi-directional laser scan pattern is applied for each SLM layer. Note that since the distortion (and RS) in the build is strongly correlated to the thermal history, process parameters such as scan speed and time interval between layers are matched to those used in practice so as to avoid unrealistic heat loss or accumulation. Conduction effects between adjacent layers, as well as radiative and convective heat losses from the exposed surfaces, are also necessarily incorporated. Since the model applied in this work is formulated via a Lagrangian domain, fluidic behavior of the melt pool (MP) is not captured. Nonetheless, as stated in Section 2.1 below, similar approaches to predict thermomechanical response in SLM have been found by other investigators to provide representative thermal histories [20,21,22].

Dimensions, displacement boundary conditions, and scan pattern for the finite element SLM model
Material addition (printing) in the SLM model is characterized by a dynamically changing Lagrangian domain, for which both the quiet elements and inactive elements modeling techniques have been previously proposed. Benefits and shortcomings of the respective techniques have been detailed by Michaleris as well as Lundback et al. [23, 24]. The work here incorporates the inactive elements technique, wherein an entire layer of elements is simultaneously activated to represent deposition of fresh powder over the previous selectively melted and solidified layer. A 5-s interval is included between layer activations to mimic powder spreading with a recoater blade. Upon layer activation, nodes shared between the top face of the lower layer and the bottom face of the new layer allow for thermal dissipation between the layers. A volumetric heat source is implemented to mimic laser scanning of newly activated powder layer elements. Table 1 summarizes the SLM process parameters used to simulate a 316L build of 200-μm height using four layers (50-μm layer thickness) [25]. Python scripting with Abaqus v6.14 is used to efficiently implement element layer activation, while a “DLFUX” subroutine is programmed in FORTRAN to control the path and speed of the moving heat source generated by the laser scans such that appropriate thermal history is obtained during rapidly changing scan locations. Solution to the thermomechanical problem is obtained via an implicit FE solver.
2.1 SLM thermal model
The thermal modeling approach presented here involves solution to the same transient heat-energy balance relation (in Eq. 1) that has been applied by other researchers when conducting metal AM simulations. For instance, Heigel et al. applied a similar thermomechanical model to predict deflection and residual stress during directed energy deposition (DED) of Ti-6Al-4V [20]. Yan et al. used a similar approach when developing a multi-objective optimization algorithm for modeling a multi-material laser-engineered net shaping (LENS) process [26]. Zhu et al. employed a similar model to numerically investigate variation in thickness of a SS 316L thin-walled structure along with changes in temperature field distribution during laser direct metal deposition (LDMD) [27]. Chiumenti et al. used FE to solve the same thermal energy equation when predicting the residual stress and distortion during multi-pass welding and shaped metal deposition (SMD) [28]. Manvatkar et al. applied a similar thermal model to the LENS process on 316L to predict hardness and melt pool dimensions [29]. Denlinger et al. incorporated FE solution of the same equation to investigate the thermomechanical characteristics during electron beam deposition (EBD) of Ti-6Al-4V [22]. The corresponding energy balance relation that governs the transient, spatially dependent temperature field is given by Eq. 1.
where T is the temperature at time t, c is specific heat, ρ is the material density, k is thermal conductivity, and q is the volumetric heat input [30]. An initial condition is given by Eq. 2 for the consecutive powder layers L being spread.
where T0 is the ambient (or sink) temperature (297 K) at t0,L, the time of activation of the L th powder layer. Heat loss from the powder and solid continua are associated to thermal conduction, convection, and radiation at free surfaces, per (3).
In Eq. 3, h is the convective heat transfer coefficient, ψ is the Stefan-Boltzmann constant (5.6703 × 10− 8 W m− 2 K− 4), and 𝜖 is the emissivity. Note that the emissivity for 316L is estimated to be 0.4 from the sides of the solid domain to the powder bed, and 0.62 from the top surface, [31,32,33].
Similar to the approach of Madireddy et al. [31], and considering the simplification suggested by Li et al. (2019) [34], conductive effects of the surrounding powder are numerically represented by an artificial convective heat transfer coefficient, ha, included in Eq. 4. As a result, modeling “excess” powder in the bed can be neglected, which significantly reduces computational effort. The same is done to model conductive heat loss through the bottom surface of the build to the substrate. The term “artificial” is used here because the heat that would be transferred farther away from the part, by conduction through powder and substrate continua, is instead transferred at an equivalent rate by convection through free element surfaces Γ on the much smaller simulated domain.
2.2 SLM mechanical model
In conjunction with Eqs. 1 to 4, which are used to describe the thermal behavior during SLM, the structural behavior is governed by the quasi-static equilibrium condition of Eq. 5 [20,21,22, 35], where gravitational and other body/surface loads are absent, and σ is the Cauchy stress tensor.
The temperature-dependent elastic constitutive relation is given by Eq. 6:
In Eq. 6, C is the elasticity tensor, and εT and εP are the total and plastic strain tensors, respectively. The term αmΔT represents thermal strain, with αm as the linear thermal expansion coefficient. I is a 3×3 identity matrix. Note that Eqs. 1 to 6 can be used to represent the thermomechanical behavior of the solid and powder continua, but with temperature dependency in properties, as can be referenced from the work of Li et al. and Foroozmehr et al., [36, 37]. Thermomechanical material properties for 316L used in the present work have been referenced from experimental findings by the Argonne National Laboratory and the Lawrence Livermore National Laboratory, [38, 39]. Temperature-dependent stress-strain response of 316L is modeled based on experimental work conducted at the Idaho National Laboratory, [40].
2.3 Dynamic heat source model
Adequate heat source modeling is required to predict geometric shapes of the melt pool (MP) and heat affected zone (HAZ), both of which are directly related to the distribution of thermally induced distortion and RS. The SLM modeling presented here predicts the distortion distribution according to the transient thermal history, which depends on many factors including the build geometry, scan speed, scan pattern, powder layer thickness, laser power, temperature-dependent material properties, ambient conditions, etc.
A moving heat source model is applied here to the SLM process based on Goldak et al.’s double ellipsoid Gaussian heat source [41, 42], which was originally introduced in 1984 for welding simulations. The double ellipsoid model, which describes thermal power density distribution in terms of a volumetric heat flux, is depicted in Fig. 5 and quantitatively described by Eq. 7:

Illustration of Goldak’s et al. double ellipsoid heat source model (indicating scan motion in “Y ” direction)
In Eq. 7, q is the volumetric heat flux, P is the incident laser power, yi is the instantaneous Y ordinate (assuming the scan proceeds in the Y direction), and ff and fr are fractions of the heat distribution within the front and rear octants, respectively. A term η, representing absorptivity of the powder particles based on mean particle size, is also included, [43, 44]. Numerical values for the parameters in Eq. 7 are listed in Table 2.
The heat source model parameters in Table 2 are identified based on calibration of melt pool geometry using thermographic experiments performed by Heigel et al. [3] at NIST for SLM of an Inconel 625 layer. The investigators retrofitted a short-wave infrared (SWIR) camera onto an EOS M 270 printer, enabling in situ acquisition of thermal data at 1800 frames per second. Radiant temperature was measured and subsequently used to establish the melt pool boundary by observing a discontinuity in the radiant temperature when moving spatially away from the peak temperature location. This boundary (or isotherm) was said to represent the solidus-liquidus transition zone. Although 316L is considered in this work (not Inconel 625), the volumetric heat flux due to the laser incidence assumes the same double ellipsoid parameters; this is justified in that the intent of this work is to assess the viability of correcting typical SLM distortion patterns using in situ LSP, rather than a rigorous predictive modeling of the actual distortion field itself.
Following simulation with the described SLM model using the geometry and scan parameters in Fig. 4, as well as Tables 1 and 2, the predicted topography of the top surface is seen in Fig. 6a (based on 6561 upper surface nodes). It is noted that the topography exhibits a convex deflection similar to that described by Li et al. [15]. From surface roughness metric Rt (range), it is evident that a \(\sim \) 9-μm vertical distortion exists between the highest and lowest points. Figure 6b shows the region of the top surface that falls outside an assigned 2-μm conformance limit (used in this work for demonstration purposes). The color-contoured region, which shows \(\sim \) 7 μm of variation, is to be treated with laser shock peen forming, as described next in Sections 3 and 4, to preferentially form the surface so as to strive for maximum conformance. Surface roughness metrics, such as Ra (arithmetic mean) and Rq (root mean square), are also quantified and discussed to further assess the merits and effectiveness of LSP forming treatments.

a Predicted topography of top surface (relative to highest point) at conclusion of SLM process to build 4 mm × 4 mm 316L stainless steel block having 200-μm part height obtained using four 50-μm layers. b Color-contoured region on top surface that fails to meet the assigned 2-μm conformance limit (non color-contoured region meets 2-μm conformance criterion)
3 Numerical modeling of LSP forming treatment
While the thermomechanical SLM model described in the previous section is applied in this work to simulate the top surface distortion during SLM of four 50-μm layers with 316L, in practice the upper surface topography can be scanned using a co-located 3D white light interferometry sensor head [45] to obtain a point cloud dataset. A summary of cameras used for in situ SLM process monitoring via layer-wise imaging can be found in [46]. This measurement concept, together with an in situ LSP forming laser, is depicted schematically in Fig. 7a. Even with such topology detection equipment, however, accompanying simulations would provide great value in assessing the viability and establishing a strategy for effective LSP forming. For specific build geometries and materials, simulations can help determine the LSP shot pattern, spot size and overlap, and the influence of forming environment temperatures (as are investigated in this paper). Moreover, while not in the scope of this paper, simulations can be used to assess optimum number and configuration of intermediate LSP forming treatments during a part build, as well as to improve transfer function identification, and reduce trial-and-error development efforts toward closed-loop distortion control (and correction) systems.

a Schematic of proposed concept that includes a surface topology optical scanning sensor that is used to generate input for the in situ LSP forming system to reduce SLM-induced surface distortion. b Shock waves induced in the workpiece by the incident laser pulse and expanding plasma at the interface
To ensure compatibility when transferring the SLM predicted displacement and stress fields to serve as the initial state in the LSP forming simulation, boundary conditions for the dynamic explicit FE model of the LSP forming simulation are inherited from the implicit SLM model. Since in situ LSP within the SLM printer environment is proposed, no ablative coating (e.g., no opaque paint or tape) or any transparent pressure confining overlay (such as water) are assumed. Successful LSP treatments under such conditions using suitable laser wavelength, fluence, pulse width, and spot area/pattern have been reported by [47,48,49]. Moreover, the absence of an ablative coating may also benefit interlayer fusion during SLM. For demonstration purposes in this case study, a relatively low peak LSP plasma pressure of 754 MPa is applied for all initial LSP forming shots so as to prevent (or limit) undesired effects of shock wave reflection from the base plate upon which the 200-μm part is built (note that LSP pressures can likely increase with build height). In addition, this work investigates whether a “warm” in situ environment, with corresponding uniformly imposed elevated part temperature, can improve LSP formability. Therefore, the LSP forming effectiveness is evaluated at several, uniform elevated temperatures, all of which are well below that for recrystallization of 316L. Other researchers, although not addressing LSP formability, have studied the merits of “warm” laser shock peening on RS fields [48, 50].
Similar to the approach of Hasser et al., the elastic-plastic LSP-induced shock wave induced by LSP (see Fig. 7b) is modeled using linear coupled temperature-displacement hexahedral elements with reduced integration (C3D8RT) [51]. A dynamic explicit solution with variable damping of the post-plasticity elastic-wave is obtained using the explicit solver of Abaqus v6.14, and where Python scripting is used to implement the LSP forming shot sequence and the laser plasma pressure loads (discussed in Section 3.2). Solution time steps, damping methodology, and spatial and temporal calculation of the plasma pressure from the experimentally characterized laser pulse are the same as those described in detail by Hatamleh et al. [52], who studied residual stress random fields in SLM-fabricated aluminum A357 alloy based on errors reported in the corresponding X-ray diffraction measurements.
3.1 LSP material constitutive model
Given the high strain rates generated by the LSP shock wave, the Johnson-Cook (J-C) material constitutive mo-del given by Eqs. 8 and 9 is incorporated [53]. Amar-chinta et al. previously compared the Johnson-Cook, Zerilli-Armstrong (ZA), and Khan-Huang-Liang (KHL) models, and found that RS predictions for LSP on Inconel 718 showed good agreement with X-ray diffraction data when using the J-C and KHL models [53]. The J-C parameters used in this work are listed in Table 3. Other temperature-dependent material properties such as thermal expansion coefficient, thermal conductivity, density, elastic modulus, Poisson’s ratio, and specific heat remain the same as used for the SLM simulation.
In Eq. 8, σf is the flow stress, A is the initial quasi-static yield stress, B is the strain hardening coefficient, εp is the equivalent plastic strain, n is the strain hardening exponent, C is the strain rate coefficient, \(\dot {\varepsilon }_{p}\) is the plastic strain rate, \(\dot {\varepsilon }_{0}\) is the reference strain rate, T∗ is the nondimensional temperature ratio between reference (or ambient) temperature T0 and melting temperature Tm, and m is the thermal softening exponent.
3.2 Identification of spatial and temporal distributions of plasma pressure for LSP forming
The calculation of spatial and temporal plasma pressure fields for the LSP forming prediction is based on the same experimental laser setup as in Hatamleh et al. [10]. To more accurately determine the transient spatial profile of the plasma pressure, they first experimentally characterized the spatial distribution of their (attenuated) laser pulse (generated by a Spectra-Physics Quanta Ray Pro-350, 3 J, Q-switched, 17-ns pulsed laser operating at 1064-nm wavelength). A fast photodetector (Ophir FPS-1) was used to convert optical signals intercepted by a beam splitter into electrical signals. The electrical signals were further measured using a digital storage oscilloscope (LeCroy Waverunner 204Xi), which provided the temporal profile of the laser pulse. In parallel, the spatial profile of the laser pulse was identified using a high-resolution camera (Ophir SP928). The acquired point cloud data representing the laser pulse spatial intensity, once filtered to remove undulating noise, and scaled in terms of pixels to distance, is shown in Fig. 8.

a Map of the experimentally acquired point cloud data representing laser pulse spatial intensity. b 3D plot of the experimentally acquired point cloud data. Note that the red circle represents the beam periphery, having a radius of 1.6 mm
Hatamleh et al. fit a simplified, axisymmetric, bivariate Gaussian profile to the laser spatial intensity, per (10), by only considering data in Fig. 8 at 0-mm transverse location. The resulting axisymmetric Gaussian profile, in which R is the radial distance from the shot center, has standard deviation σR = 0.39 mm, is shown in Fig. 9b.

a Laser beam spatial distribution. b Hatamleh et al.’s simplified axisymmetric Gaussian profile [10], where the experimental data corresponds to the horizontal crosshair in image (a)
Although the Gaussian simplification adds convenience, it can be seen from Fig. 8 that the experimentally determined laser pulse spatial intensity is clearly not axisymmetric. Moreover, it is arguably not Gaussian, instead resembling a “top hat” or “stepped” profile. Accordingly, the effect on LSP forming of the Gaussian simplification versus using the original data is investigated here and discussed in Section 5. Note that the spatial intensity distribution of the resulting plasma pressure P is calculated to be directly proportional to spatial distribution of the laser energy intensity; hence, both have the same shape.
The temporal distribution of resulting plasma pressure from the \(\sim \) 17-ns full-width half-maximum (FWHM) laser pulse duration, as seen in Fig. 10 for each LSP shot, is estimated using Fabbro et al.’s 1D hydrodynamic model [55]. From their model (11) is derived, which gives the resulting piecewise-continuous temporal profile of the plasma pressure as function of time t during the heating phase (0 < t < tp) and adiabatic cooling phase (t ≥ tp).

Heating and adiabatic cooling phase profiles of the temporal plasma pressure model for each LSP shot. a Peak plasma pressure of 754 MPa, and b Peak plasma pressure of 904.8 MPa achieved with a 50% increase in power density
The initial plasma thickness, S(0), is estimated at 10 μm. Further necessary details to apply (11), such as the time-varying plasma thickness, S(t), and the shock impedance for 316L, can be referenced from [55], and [56], respectively. As mentioned, if there is an insufficient improvement in conforming area between successive LSP forming treatments, laser power density can be increased. For demonstration purposes here, a 50% increase will be applied. Such increase in laser power density changes the temporal profile of the plasma pressure during LSP shots. For instance, Fig. 10a shows the plasma pressure temporal profile for LSP shots having 754-MPa peak pressure (corresponding to 21 MW cm− 2 laser peak power density obtained with an averaged incident laser pulse energy of \(\sim \) 29 mJ), whereas Fig. 10b shows the plasma pressure temporal profile for LSP shots with 904.8-MPa peak pressure based on 50% increase in laser peak power density to 31.5 MW cm− 2 obtained with an averaged incident laser pulse energy of \(\sim \) 42 mJ.
4 In situ LSP forming strategy to mitigate SLM surface distortion
4.1 Prediction and analysis of SLM surface topography, and effects of LSP forming treatment
For convenient reference in analyzing results of LSP forming, Fig. 6a and b are repeated as Fig. 11a, b, to show the vertical displacement (distortion) contour maps, relative to the highest point, on the top surface of the 316L part following SLM of the four 50-μm layers. Again, the non-contoured (white) region in Fig. 11b represents the top surface area conforming to the assigned 2-μm tolerance criterion following SLM. The relative area of conformance is calculated to be 44.13%. The non-conforming region has a vertical distortion range of \(\sim \) 7 μm and will thus be subject to LSP forming treatment (in practice LSP forming would occur prior to any further SLM layer deposition). Based on the topography to be corrected, an LSP forming pattern is devised according to the general strategy outlined in the following section. Considering 1.6-mm laser spot radii with 40% area overlap, the resulting shot pattern is depicted in Fig. 11c. Note, the LSP spatial profile used for the numerical predictions seen in Fig. 11 employs the Gaussian profile observed in Fig. 9b. The modified surface topography after this first round of LSP forming at 300 K is shown in Fig. 11d, e. From Fig. 11e, it is evident that significantly more area, approximately 84.75%, now me- ets the 2-μm conformance criterion. Striving to further improve conformance, a second round of LSP forming is strategically implemented per Fig. 11f (again, 1.6-mm spot radii with 40% area overlap). Topography prediction after this second LSP forming at 300 K is indicated in Fig. 11g, h. However, due to strain hardening, this second LSP forming is largely ineffective, since the new conforming area is 84.97%, indicating very little improvement compared to 84.75% conformance after the first LSP treatment (seen by comparing Fig. 11e with Fig. 11h). Per the LSP forming strategy detailed next, this result suggests possibly increasing the laser power density for a subsequent LSP forming per the pattern of Fig. 11i. A general laser shock peen forming strategy that also addresses this issue is outlined next in Section 4.2, and the results of increasing the laser power are presented with the parametric study in Section 5. Turning attention to the calculated surface roughness metrics, which are shown in Fig. 11, average roughness (Ra) decreases from 1.5789 μm (post-SLM) to 0.9661 μm after the first LSP forming treatment. The Ra remains about the same after the second LSP forming. A similar trend occurs for the root-mean-square roughness (Rq), which is 1.8846 μm after SLM, then reduces to 1.2258 μm after the first LSP forming. Again, an insignificant change in Rq is predicted (1.2449 μm) after the second LSP forming treatment.

a Top surface topography with convex vertical distortion after SLM. b Surface area (shown white) that meets 2-μm conformance criterion after SLM. c First LSP forming treatment pattern (1.6-mm laser spot radii with 40% area overlap). d Surface topography after first LSP forming treatment. e Surface area (white) that meets 2-μm conformance criterion after first LSP forming treatment. f Second LSP forming treatment pattern (1.6-mm laser spot radii with 40% area overlap). g Surface topography after second LSP forming treatment. h Surface area (white) that meets 2-μm conformance criterion after second LSP forming treatment. i Third LSP forming treatment pattern (1.6-mm laser spot radii with 40% area overlap)
4.2 A general laser shock peen forming strategy
This section describes the rationale for design of the LSP shot locations seen in Fig. 11c, f, i, in addition to addressing ineffective LSP treatments through increased laser power density. Considering user-defined parameters of 1.6-mm laser spot radii with 40% overlap in area, the systematic LSP forming strategy to design the shot patterns in Fig. 11c, f, i is devised as follows. Referring again to Fig. 11b, i shot locations are assigned, as seen in Fig. 11c, to the non-conforming (color-contoured) domain, with the first shot center point, P1, located at the highest peak. The domain comprising P1 and its 1.6-mm radius is now removed from consideration for the next shot’s center location (P2) from the remaining (non-conforming) subdomain. The location of P2 and all subsequent shots, however, are also subject to a distance d constraint according to the assigned spot radius r and overlap. Thus, in the shot patterns of Fig. 11c, f, i, a 1.6-mm radius and 40% area overlap are enforced. Once the entire non-conforming surface area is accounted for, LSP forming is executed using the shot pattern and sequence. The surface topography is then identified by numerical simulation and/or an experimental interferometry technique, and from the new point cloud data (ref. Fig. 11d), the updated conforming area (ref. Fig. 11e) is found and compared to that of the previous LSP forming treatment, or the post-SLM topography for the first treatment. The results of this comparison give rise to three possibilities:
-
1.
If the conforming area increases, and the entire top surface meets the conformance criterion, the LSP forming strategy is terminated and the SLM process proceeds.
-
2.
If the conforming area increases, but the entire top surface does not yet meet the conformance criterion, as seen by comparing Fig. 11e and b, the non-conforming domain is identified and a new LSP forming strategy is generated and executed (ref. Fig. 11f), with no change in the laser power density.
Fig. 12 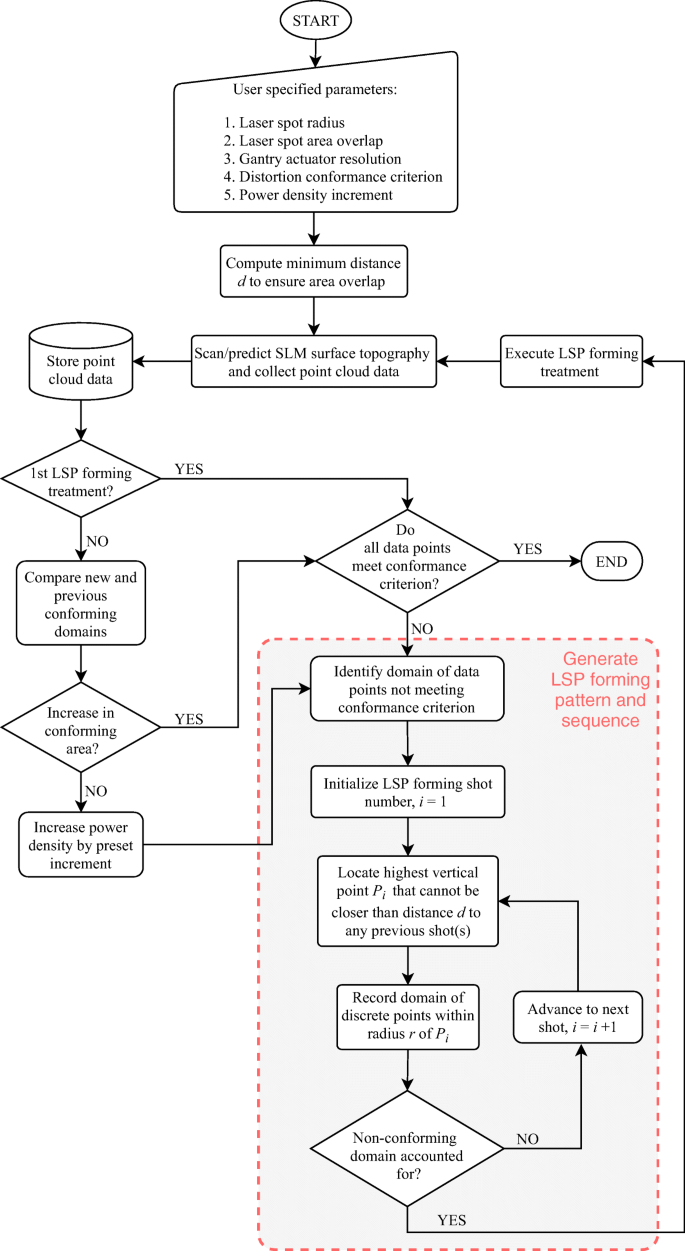
Flowchart for the proposed hybrid AM strategy using in situ LSP forming to mitigate top surface distortion
Table 4 Summary of parametric case studies regarding laser energy (and plasma pressure) spatial profile, spot radius, spot area overlap, and power density of successive shots -
3.
If there is insufficient improvement in the conforming area relative to the prior forming treatment, as seen when comparing Fig. 11h and e, the non-conforming domain is identified and a new LSP forming strategy is generated and executed (ref. Fig. 11i), with an increase in the laser power density (note that 50% increase is applied for demonstration purposes in this work).

In practice, such an approach can be integrated into a closed-loop control system, as outlined in the flowchart of Fig. 12.
5 Parametric LSP forming study results and discussion
5.1 Influence of plasma-pressure spatial profile idealization, laser spot size, and forming temperature
To further investigate the effectiveness of LSP forming in correcting SLM-induced distortion, four case studies with varying LSP parameters are investigated, as summarized in Table 4. Cases 1 to 3 apply the simplified, axisymmetric Gaussian laser energy intensity spatial profile from Fig. 9b, while Case 4 applies the actual 3D experimental spatial intensity data in Fig. 8. Case 1 represents the same LSP forming conditions used earlier in Fig. 11 (i.e., 1.6-mm laser spot radii, 40% area overlap) based on the LSP forming strategy outlined in Fig. 12, leading to 9 LSP shots for the first treatment. Case 2 features a 20% increase in laser spot radius (1.92 mm). Shot locations for Case 2 are identical to those for Case 1, which means that shot overlap can exceed 40%; this also results in one “redundant” shot, P9, for the first LSP treatment since the eight shots (P1 to P8) already encompass the non-conforming domain (see Fig. 13a). Case 3 also applies 1.92-mm shot radii, but unlike Case 2, the shot locations for Case 3 are defined using the LSP forming strategy outlined in Fig. 12, which generates 8 shots, as shown in Fig. 13b. Finally, Case 4 has the same laser spot radius and pattern as Case 1, but applies the experimental laser spatial intensity data from Fig. 8 (instead of the simplified Gaussian profile) in effort to generate a more representative spatial profile of the corresponding plasma pressure.
Recall that the objective of LSP forming treatment is to plastically form as much as possible of the 4 mm × 4 mm (16 mm2) top surface of the 316L SLM part, so as to attain conformance of 2-μm maximum height variation. To carry out the parametric study on the four LSP forming cases in Table 4, the rate-dependent, elastic-plastic shockwave model from Section 3 is executed. In addition, to glean potential benefits of specific in situ forming environment temperatures, the LSP simulations are performed with uniform part temperatures ranging from 300 to 500 K. The resulting conforming surface area predictions are in indicated in Fig. 14a.

LSP forming shot locations during initial treatment for (a) Case 2 and (b) Case 3, as described in Table 4. Note: subtle differences exist between the two cases with regard to the position of shot centers for P3, P6, P7, and P8

a Percent of surface area on top face of 316L SLM build that meets 2-μm conformance criterion after one LSP forming treatment, for each case in Table 4. b Percent difference in surface area conformance relative to Case 4
Cases 1 and 4 offer a comparison of the distortion correction results when applying the axisymmetric Gau-ssian simplification to the laser spatial energy profile (and corresponding plasma pressure profile) as in Case 1, versus applying the plasma pressure profile corresponding to the actual 3D experimental laser spatial intensity from Figs. 8 and 9, as in Case 4. Examination of the distortion correction results in Fig. 14a reveals that, compared to Case 4, Case 1 under-performs in conforming surface area at all temperatures. Such under-performance can be explained by looking again at both the experimentally measured and the Gaussian laser intensity spatial profiles in Fig. 9b. Within a radial distance of \(\sim \) 0.65 mm (almost two standard deviations) from the shot-center, the Gaussian profile neglects several data that would otherwise contribute to a somewhat “top hat” or “stepped” laser energy profile and corresponding plasma pressure profile. Hence, Case 4 captures the greater plasma pressure at these corresponding locations within each laser shot, likely leading to the relatively greater formability and surface conformance.
Comparing Cases 1 to 3 offers insight into the effect of using a more “distributed” pressure profile with the same total laser energy (\(\sim \) 29 mJ). As seen from Fig. 14a, at all testing temperatures simulated, Case 1 leads to higher conforming surface area after one LSP forming treatment than Case 3. The same is also mostly true when comparing Cases 1 and 2, with the only anomalies appearing at 300 and 375 K, where Case 2 generates marginally better conformance (0.18% and 0.12% better, respectively, at 300 and 375 K). This implies that utilizing lower energy density with the same total laser energy does not better flatten the SLM part surface. The observation agrees with that of [16], wherein it was experimentally observed that a smaller spot size is preferential to distortion correction.

a–c The effect on distortion during LSP forming after 1, 5, and 9 shots, respectively, at 300 K. d–f The effect on distortion after 1, 5, and 9 shots, respectively, at 500 K. Note that the images are taken from simulations that apply the LSP parameters of Case 4 in Table 4. (Each plot has a unique vertical axis scale)
Comparing Cases 2 and 3, the relatively higher shot overlap with Case 2 leads to an increased fraction of the surface area meeting the conformance criterion. With the exception of 400 K, the amount of surface area predicted to conform after one LSP treatment is greater for Case 2 than for sase 3 at all simulated temperatures. This finding is also supported by the experimental work in [16], which tested up to 80% overlap.
Since Case 4 incorporates the most realistic plasma pressure profile, it is used in Fig. 14b as the baseline for which to compare the performance of Cases 1 to 3 (each of which apply the simplified Gaussian pressure profile). Given that the maximum relative difference is within 6% at all the temperatures, the far simpler and convenient Gaussian profile does not go discredited. Note also that, in general, all cases show a similar trend and reveal relatively little variation in the fraction of conforming surface area at the various temperatures. Nonetheless, the optimum temperature for LSP forming of the 316L part is clearly 300 K.
To better understand the manner in which the surface is “corrected” when the LSP forming is conducted at different temperatures, Fig. 15 shows the surface topography at intermediate “shot frames” during the LSP forming process at 300 K and 500 K. Figure 15a, b, and c illustrate, respectively, the surface topography after 1, 5, and 9 shots at 300 K. Similarly, Fig. 15d, e, and f show the surface topography after 1, 5, and 9 shots at 500 K. Comparing Fig. 15a and d, 78.56% and 77.49% of the surface area meets the 2-μm conformance criterion after 1 shot at 300 K and 500 K, respectively. Similarly, comparing Fig. 15b and e, 85.19% and 75.13% of the surface area conform after 5 shots at 300 K and 500 K, respectively. Finally, with all 9 shots executed, Fig. 15c and d show, respectively, that 84.75% and 74.25% of the surface area conform at 300 K and 500 K. It is also noteworthy that the surface areas containing the highest peaks (visible as dark red contours) reduce during each respective multi-shot LSP treatment, i.e., from Fig. 15a to c at 300 K, and from Fig. 15d to e at 500 K. While this effect is more significant when the forming environment is 500 K (see Fig. 15d to f), it is also observed that the height of the tallest peak increases by \(\sim \) 2 μm despite the increase in the conforming surface area.

a Conforming surface area of 84.97% (shown white) after second LSP forming treatment at 300 K, which exhibits negligible improvement compared to the result after the first treatment (84.75%) in Fig. 11e. b Third LSP forming treatment to be executed with increased laser power density. c Conforming surface area of 91.06% (shown white) after the third LSP forming at 300 K, revealing considerable improvement when compared to Fig. 16a. (Note: Fig. 16a and b are the same as Fig. 11h. and i)
When comparing roughness metrics at the different stages of LSP forming at 300 K and 500 K, note that both average roughness (Ra) and root-mean-square roughness (Rq) reduce, respectively, from 1.5789 to 1.8846 μm (post-SLM, Fig. 11a) to the values indicated in Fig. 15. These metrics predict slightly greater surface roughness at the higher forming environment temperature. Note that the values of roughness range (Rt) do not provide a consistent metric from which to assess the fraction of conforming surface area. This is because Rt values simply indicate the difference between the highest and lowest data points, disregarding the actual domain that is made to conform as the LSP forming treatment is executed.
5.2 Effect of increased LSP power density on multi-treatment forming capability
As discussed earlier in the LSP forming strategy in Section 4.2, if there occurs negligible improvement in the conforming area, an increase in laser power density is implemented. From Fig. 16a (same as Fig. 11h) 84.97% of the top surface area conforms after two LSP treatments (each with unique shot locations per Fig. 12) at 300 K. The improvement for the second treatment is negligible, however, compared to that predicted for the first LSP forming treatment (84.75%), as seen earlier in Fig. 11e. Therefore, a 50% laser power density increase is used, which results in an improved 91% surface area conformance, as seen in Fig. 16c. Note that there is also a visible reduction of areas containing the tallest peaks (dark red contours) when comparing Fig. 16a and c. These predicted results agree with the distortion trends experimentally reported by Shukla et al. [18], albeit their LSP process was applied to a ceramic. Comparing surface roughness metrics for the topography obtained after the third LSP forming at 300 K and with 50% greater laser power density, the predicted Ra decreases to 0.9201 μm, while Rq decreases to 1.1815 μm. These results represent approximately 41% reduction in Ra, and 37% reduction in Rq, after just three LSP forming treatments.
6 Conclusion
This paper has discussed a novel hybrid AM method that integrates in situ laser shock peen (LSP) forming with SLM type laser powder bed fusion to mitigate vertical distortions during AM part builds. The current literature pertaining to application of LSP to AM has focused primarily on reducing undesirable tensile residual stresses and generating beneficial surface compressive residual stresses in SLM parts. This work has described and rigorously demonstrated the application of an in situ SLM-LSP process to predict and mitigate vertical (build direction) distortion on the upper surface of SLM parts, thereby offering a means to potentially reduce or eliminate the need for finish-machining post-processes. The value in avoiding such finish-machining can be especially important on the internal surfaces of AM parts that are difficult or impossible to access via conventional machining methods. Viability of the proposed LSP forming treatment strategy was investigated based on varying the laser spot size, spot overlap, forming temperature, and laser power when using a nanosecond-pulsed 1064-nm laser. In addition, experimental characterization of the actual laser spatial and temporal energy profiles was incorporated to better model the resulting LSP-induced plasma pressure loads, and to evaluate the efficacy of adopting a simplified Gaussian axisymmetric spatial profile of the laser energy and corresponding plasma pressure. Specific findings of the work reveal:
-
For a 316L stainless steel SLM build having 4 mm × 4-mm footprint and 200-μm build height based on four 50-μm layers, the fraction of the upper surface area that conforms to a 2-μm tolerance is improved from 44.13 to 84.75% after one LSP forming treatment at 300 K using the experimentally characterized laser pulse.
-
Due to strain-hardening effects, a second LSP forming treatment with the same laser power results in negligible improvement whereas a third treatment, with 50% increase in laser power, further improves the SLM surface distortion conformance to approximately 91%.
-
For a given laser total energy, it is found that using a smaller laser spot size with the LSP forming treatment (i.e., increased power density) is more effective in reducing the vertical distortion of the upper surface of the SLM build.
-
Average surface roughness (Ra), as predicted by the LSP forming treatment (not including laser ablative effects) is also reduced by 41%, while root-mean-square roughness (Rq) is reduced by 37%, relative to the as-built SLM surface.
-
Considering uniform LSP forming treatment temperatures ranging from 300 to 500 K (well below recrystallization for 316L), it is found that 300 K is the most effective temperature for reducing the surface distortion of the SLM build.
References
Schoinochoritis B, Chantzis D, Salonitis K (2017) Simulation of metallic powder bed additive manufacturing processes with the finite element method: a critical review. Proc Inst Mech Eng Part B J Eng Manuf 231:96–117
Solutions M (2014) The additive manufacturing system for the production of serial components, spare parts and functional prototypes directly in metal. EOS 1000:290
Heigel JC, Lane BM (2018) Measurement of the melt pool length during single scan tracks in a commercial laser powder bed fusion process. J Manuf Sci Eng 140
Kalentics N, Boillat E, Peyre P, Ćirić-Kostić S, Bogojević N, Logé RE (2017) Tailoring residual stress profile of selective laser melted parts by laser shock peening. Addit Manuf 16:90–97
Kalentics N, Boillat E, Peyre P, Gorny C, Kenel C, Leinenbach C, Jhabvala J, Logé RE (2017) 3D laser shock peening–a new method for the 3D control of residual stresses in selective laser melting. Mater Des 130:350–356
Han Q, Mertens R, Montero-Sistiaga ML, Yang S, Setchi R, Vanmeensel K, Van Hooreweder B, Evans SL, Fan H (2018) Laser powder bed fusion of Hastelloy X: effects of hot isostatic pressing and the hot cracking mechanism. Mater Sci Eng A 732:228–239
Minnecci R, Rawn C, Jones Z, Bunn J, Tramel T (2018) Residual stress mapping of as-built and hot isostatic pressure treated GRCOP-84 as fabricated by selective laser melting
Lavery N, Cherry J, Mehmood S, Davies H, Girling B, Sackett E, Brown S, Sienz J (2017) Effects of hot isostatic pressing on the elastic modulus and tensile properties of 316L parts made by powder bed laser fusion. Mater Sci Eng A 693:186–213
Benedetti M, Torresani E, Leoni M, Fontanari V, Bandini M, Pederzolli C, Potrich C (2017) The effect of post-sintering treatments on the fatigue and biological behavior of Ti-6Al-4V ELI parts made by selective laser melting. J Mechan Behav Biomed Mater 71:295–306
Hatamleh MI, Mahadevan J, Malik A, Qian D, Kovacevic R (2019) Prediction of residual stress random fields for selective laser melted A357aluminum alloy subjected to laser shock peening. J Manuf Sci Eng 141
Santos L, Borrego L, Ferreira J, de Jesus J, Costa J, Capela C (2019) Effect of heat treatment on the fatigue crack growth behavior in additive manufactured AISI 18Ni300 steel. Theor Appl Fract Mech 102:10–15
Shrestha S, Chou K (2017) A build surface study of powder bed electron beam additive manufacturing by 3D thermo-fluid simulation and white-light interferometry. Int J Mach Tools Manuf 121:37–49
Scime L, Beuth J (2018) Anomaly detection and classification in a laser powder bed additive manufacturing process using a trained computer vision algorithm. Addit Manuf 19:114–126
Kanko JA, Sibley AP, Fraser JM (2016) In situ morphology-based defect detection of selective laser melting through inline coherent imaging. J Mater Process Technol 231:488–500
Li C, Fu C, Guo Y, Fang F (2016) A multiscale modeling approach for fast prediction of part distortion in selective laser melting. J Mater Process Technol 229:703–712
Kalentics N, Burn A, Cloots M, Logé RE (2019) 3D laser shock peening as a way to improve geometrical accuracy in selective laser melting. Int J Adv Manuf Technol 101:1247–1254
Lu J, Lu H, Xu X, Yao J, Cai J, Luo K (2020) High-performance integrated additive manufacturing with laser shock peeninginduced microstructural evolution and improvement in mechanical properties of Ti-6Al-4V alloy components. Int J Mach Tools Manuf 148:103475
Shukla P, Crookes R, Wu H (2019) Shockwave induced compressive stress on alumina ceramics by laser peening. Mater Des 167:107626
Hackel L, Rankin JR, Rubenchik A, King WE, Matthews M (2018) Laser peening: a tool for additive manufacturing post-processing. Addit Manuf 24:67–75
Heigel J, Michaleris P, Reutzel EW (2015) Thermo-mechanical model development and validation of directed energy deposition additive manufacturing of Ti-6Al-4V. Addit Manuf 5:9–19
Srivastava S, Garg RK, Sharma VS, Alba-Baena NG, Sachdeva A, Chand R, Singh S (2020) Multi-physics continuum modelling approaches for metal powder additive manufacturing: a review. Rapid Prototyp J
Denlinger ER, Heigel JC, Michaleris P (2015) Residual stress and distortion modeling of electron beam direct manufacturing Ti-6Al-4V. Proc Inst Mech Eng Part B J Eng Manuf 229:1803–1813
Michaleris P (2014) Modeling metal deposition in heat transfer analyses of additive manufacturing processes. Finite Elem Anal Des 86:51–60
Lundbäck A., Lindgren LE (2011) Modelling of metal deposition. Finite Elem Anal Des 47:1169–1177
Liverani E, Toschi S, Ceschini L, Fortunato A (2017) Effect of selective laser melting (SLM) process parameters on microstructure and mechanical properties of 316l austenitic stainless steel. J Mater Process Technol 249:255–263
Yan J, Masoudi N, Battiato I, Fadel G (2015) Optimization of process parameters in laser engineered net shaping (lens) deposition of multi-materials. In: International design engineering technical conferences and computers and information in engineering conference, (American Society of Mechanical Engineers), vol 57045, p V01AT02A034
Zhu G, Zhang A, Li D, Tang Y, Tong Z, Lu Q (2011) Numerical simulation of thermal behavior during laser direct metal deposition. Int J Adv Manuf Technol 55:945–954
Chiumenti M, Cervera M, Salmi A, De Saracibar CA, Dialami N, Matsui K (2010) Finite element modeling of multi-pass welding and shaped metal deposition processes. Comput Methods Appl Mechan Eng 199:2343–2359
Manvatkar V, Gokhale A, Reddy GJ, Venkataramana A, De A (2011) Estimation of melt pool dimensions, thermal cycle, and hardness distribution in the laser-engineered net shaping process of austenitic stainless steel. Metall Mater Trans A 42:4080–4087
Hahn DW, Özisik MN (2012) Heat conduction. Wiley, New York
Madireddy G, Li C, Liu J, Sealy MP (2019) Modeling thermal and mechanical cancellation of residual stress from hybrid additive manufacturing by laser peening. Nanotechnology and Precision Engineering 2:49–60
Ren C-G, Lo Y-L, Tran H-C, Lee MH (2019) Emissivity calibration method for pyrometer measurement of melting pool temperature in selective laser melting of stainless steel 316L. Int J Adv Manuf Technol 105:637–649
He K, Zhao X (2018) 3d thermal finite element analysis of the SLM 316L parts with microstructural correlations. Complexity 2018
Li C, Gouge MF, Denlinger ER, Irwin JE, Michaleris P (2019) Estimation of part-to-powder heat losses as surface convection in laser powder bed fusion. Addit Manuf 26:258–269
Sadd MH (2020) Elasticity: theory, applications and numerics. Academic Press, Cambridge
Li L, Lough C, Replogle A, Bristow D, Landers R, Kinzel E (2017) Thermal modeling of 304l stainless steel selective laser melting. In: Proceedings of the ASME 2017 international mechanical engineering congress and exposition, advanced manufacturing, Tampa, FL,USA, pp 3–9
Foroozmehr A, Badrossamay M, Foroozmehr E, Golabi S (2016) Finite element simulation of selective laser melting process considering optical penetration depth of laser in powder bed. Mater Des 89:255–263
Kim CS (1975) Thermophysical properties of stainless steels, Technical Report, Argonne National Lab., Ill. (USA)
Hodge N, Ferencz R, Solberg J (2014) Implementation of a thermomechanical model for the simulation of selective laser melting. Comput Mechan 54:33–51
Blandford R, Morton D, Snow S, Rahl T (2007) Tensile stress-strain results for 304L and 316L stainless steel plate at temperature. In: ASME 2007 pressure vessels and piping conference, American society of mechanical engineers digital collection, pp 617–628
Goldak J, Chakravarti A, Bibby M (1984) A new finite element model for welding heat sources. Metall Trans B 15:299–305
Nezamdost M, Esfahani MN, Hashemi S, Mirbozorgi S (2016) Investigation of temperature and residual stresses field of submerged arcwelding by finite element method and experiments. Int J Adv Manuf Technol 87:615–624
Yan J, Zhou Y, Gu R, Zhang X, Quach W-M, Yan M (2019) A comprehensive study of steel powders (316l, h13, p20 and 18ni300) for their selective laser melting additive manufacturing. Metals 9:86
Zhang J, Gu D, Yang Y, Zhang H, Chen H, Dai D, Lin K (2019) Influence of particle size on laser absorption and scanning track formation mechanisms of pure tungsten powder during selective laser melting. Engineering 5:736–745
Pavliček P, Mikeska E (2020) White-light interferometer without mechanical scanning. Opt Laser Eng 124:105800
Caltanissetta F, Grasso M, Petro S, Colosimo BM (2018) Characterization of in-situ measurements based on layer wise imaging in laser powder bed fusion. Addit Manuf 24:183–199
Sano T, Eimura T, Kashiwabara R, Matsuda T, Isshiki Y, Hi-rose A, Sano Y (2017) Femtosecond laser peening of 2024 aluminum alloy without a sacrificial overlay under atmospheric conditions. J Laser Appl 29:012005
Prabhakaran S, Kalainathan S (2016) Warm laser shock peening without coating induced phase transformations and pinning effect on fatigue life of low-alloy steel. Mater Des 107:98–107
Yella P, Venkateswarlu P, Buddu RK, Vidyasagar D, Rao KBS, Kiran PP, Rajulapati KV (2018) Laser shock peening studies on SS 316L plate with various sacrificial layers. Appl Surf Sci 435:271–280
Ye C, Liao Y, Cheng GJ (2010) Warm laser shock peening driven nanostructures and their effects on fatigue performance in aluminum alloy6160. Adv Eng Mater 12:291–297
Hasser PJ, Malik AS, Langer K, Spradlin TJ, Hatamleh MI (2016) An efficient reliability-based simulation method for optimum laser peening treatment. J Manuf Sci Eng 138
Hatamleh MI, Shankar Mahadevan J, Malik AS, Qian D (2017) Variable damping profiles for laser shock peening simulation using modal analysis and the SEATD method. In: ASME 2017 12th international manufacturing science and engineering conference collocated with the JSME/ASME 2017 6th international conference on materials and processing, American society of mechanical engineers digital collection
Amarchinta HK, Grandhi RV, Clauer AH, Langer K, Stargel DS (2010) Simulation of residual stress induced by a laser peening process through inverse optimization of material models. J Mater Process Technol 210:1997–2006
Karkalos NE, Markopoulos AP (2018) Determination of Johnson-Cook material model parameters by an optimization approach using the fire-works algorithm. Procedia Manufact 22:107–113
Fabbro R, Fournier J, Ballard P, Devaux D, Virmont J (1990) Physical study of laser-produced plasma in confined geometry. J Appl Phys 68:775–784
Correa C, De Lara LR, Díaz M, Gil-santos A, Porro J, Ocaña J (2015) Effect of advancing direction on fatigue life of 316L stainless steel specimens treated by double-sided laser shock peening. Int J Fatigue 79:1–9
Funding
This work was supported in part by the US National Science Foundation CMMI-1762722.
Author information
Authors and Affiliations
Corresponding author
Ethics declarations
Conflict of interest
The authors declare that they have no conflicts of interest.
Additional information
Author contributions
All authors contributed to the study conception and design. Model development and analysis were performed by Sumair Sunny, Haoliang Yu, and Ritin Mathews. The first draft of the manuscript was written by Sumair Sunny and all authors commented on previous versions of the manuscript. All authors read and approved the final manuscript. Dr. Arif Malik supervised the project and acquired the funding. Dr. Arif Malik also reviewed and edited the presented work.
Ethical approval
This article does not contain any studies with human participants or animals performed by any of the authors.
Disclaimer
Any opinions, findings, or conclusions expressed in this paper are those of the authors and do not necessarily reflect the views of the National Science Foundation.
Publisher’s note
Springer Nature remains neutral with regard to jurisdictional claims in published maps and institutional affiliations.
Rights and permissions
About this article

Cite this article
Sunny, S., Yu, H., Mathews, R. et al. A predictive model for in situ distortion correction in laser powder bed fusion using laser shock peen forming. Int J Adv Manuf Technol 112, 1319–1337 (2021). https://doi.org/10.1007/s00170-020-06399-z
Received:
Accepted:
Published:
Issue Date:
DOI: https://doi.org/10.1007/s00170-020-06399-z