
Abstract
Access control is a set of regulations that governs access to certain areas or information. By access we mean entering a specific area, or logging on a machine. The access regulated by a set of rules that specifies who is allowed to get access and what is the restrictions on such access. Across the years several access control systems have been developed. Due to the rapid advancement in technology over the past years, older systems are now easily by passed, thus the need to have new methods of access control. Biometrics is referred to as an authentication technique that relies on a computer system to electronically validate a measurable biological characteristic that is physically unique and cannot be duplicated. Biometrics has been used for ages as access control security system. In this chapter we will present several biometric techniques their usage, advantages and disadvantages.
Access provided by Autonomous University of Puebla. Download chapter PDF
Keywords
10.1 Introduction
The term “biometrics” is derived from the Greek words “bios” (life) and “metrics” (to measure). Automated biometric systems have only become available over the last few decades, due to significant advances in the field of computer processing. Many of these new automated techniques, however, are based on ideas that were originally conceived hundreds, even thousands of years ago [1].
Human beings since the beginning of civilizations have been using biometrics to identify one another. People recognize each other’s via their faces. Moreover, human beings identify each other with behavioral traits such as voice and gait. Computer biometric systems try to mimic the human mind by identifying individuals via physical or behavioral traits.
It is generally agreed by the relevant research community and industry that for a biometric system to be efficient it should meet as many as possible from the following features [2]:
-
(a)
Changeability: The user must have the possibility to change his access features, take for example a finger print biometric, if the user finger print is compromised (someone stole it) and the system admin detected both the user and the imposter will be banned from the system with no means of allowing the user only to access the system.
-
(b)
Shoulder-surfing resistance: The system should be resistant to shoulder surfing especially with the advances of cameras and recording devices.
-
(c)
Theft protection: The theft protection covers physical theft of the authentication features or an easy guess for the features.
-
(d)
Protection from user non-compliance: Users tend to bend the rules when they are in a tough situation, a user can give his password to a friend to get them something urgent from their office or pc. A biometric system should try to prevent user non-compliance.
-
(e)
Stable over time: Some biometric features change over time for example Voice, ECG and EEG Signals. For example as the user gets older their voice changes slightly same happens with EEG and ECG. The system should handle these changes overtime.
-
(f)
Easy to Deploy: Users always look for fast and secure way for authentication. Magnetic Resonance Imaging (MRI) maybe more accurate than fingerprint, but going through the process of putting the user in an MRI machine every time they require access is not a feasible way for security.
-
(g)
Liveness Detection: the biometric system should try to interpret that the captured data is from a live user not a replica or a dead person.
This chapter is organized as follows; in Sect. 10.2 we discuss the machine learning methodology for intelligent access control. In Sect. 10.3 we present an introduction about the various user authentication techniques. In Sect. 10.4 we demonstrate some of the commonly used physiological biometric features. In Sect. 10.5 some of the commonly used behavioural biometrics are presented. Section 10.6 describes the fusion of multiple biometrics features to a single multimodal system. Section 10.7 shows some of the commonly used application for biometrics. Section 10.8 explores various machine learning techniques used in EEG biometrics systems. Section 10.9 contains the comparison of the various biometrics techniques and conclusion.
10.2 Machine Learning Methodology for Biometrics
Biometrics systems follow four main activities: capturing, enrollment, comparison, and decision (see Fig. 10.1).

Biometric processes
-
Capturing: is the use of sensors to capture the biometric features.
-
Enrollment: Evolves using the captured biometric data and extracting a unique set of features for each user and string them in the system.
-
Comparison: includes recapturing of the biometric features then running the same steps of the enrollment and comparing the generated signature to the stored signatures.
-
Decision: Based on the signature comparison, the system decides whether or not to give the user access.
To put these processes in a computer science (informatics) point of view the steps are:
-
Signal Capturing: signal capturing is using hardware sensors to capture the biometric features.
-
Feature Extraction: is discovering unique information in the capture data. This information will be used as the user signature.
-
Classification: is trying to find similarity between the generated signature at the enrollment phase and the verification phase.
From an initial look at the process it seems an easy task to develop a new biometric system but the truth is that every step has a set of challenges that will be covered in the following sections.
10.2.1 Signal Capturing
Signal capturing usually involves a capturing hardware. When developing a biometric the hardware type used affects the data captured. It is advised to consider the below items while selecting your hardware:
-
Quality of data captured: Low quality data will affect the algorithms developed.
-
Frequency of capturing: How fast can it capture multiple data, what is the data resolution.
-
Setup time: The time required for setup by the user to start the capturing process. For research purposes this time might be large but in practical applications users can have a 30 min setup process for each access request.
-
Ease of Use: How easy to use the hardware, does it requires a technical user to perform the capture or any user can do a self-capture.
-
Cost: While expensive hardware usually provides better quality of data, the challenge is create a secure robust system with cheaper hardware. If a biometric system uses a few thousand dollars capturing device to have high quality data. It will not be practical to install this system on every door at the office building; users would rather have a few hundred dollars capturing device and more sophisticated software to handle the low quality data.
10.2.2 Feature Extraction
After the capturing phase, comes the feature extraction, which has the following challenges:
-
Data Cleaning: The challenge in data cleaning is removing noise or useless information without destroying valuable information in the process.
-
Selection of Features: There are many features that can be used depending on the type of biometrics you are using. Which features to use and why? Some understanding of the data captured should direct you to which features to extract.
-
Features combinations: There are usually many features that can be extracted from the data, which feature combination is the best match for this signal. This will need a bit of try and error. The system need to run with several combinations and see which one would give the best results. Feature reduction techniques may as well be applied.
10.2.3 Classification
Some considerations that need to be taken care of when building a biometric classifier:
-
Type of Problem: If the system will be using a verification or identification technique the type of classifier used might differ.
-
Change over Time: How well does the classifier handle noise or slight changes in the features over time? The classifier should be developed to learn the new changes as the time passes.
-
Training Time: Time required to train the system for a new user.
-
Matching Time: Time required to match a user; while a classifier that has a 100 % accuracy can take 20 min to match the user, in real world it needs be done in seconds at most.
-
Accuracy: The most important factor is accuracy and in the security system accuracy is divided to 2 parts. False acceptance rate where a user is allowed access and they do not have the privilege, this must be really near zero percent. As for the other measure it is the false rejection rate, that’s when a privileged user is denied access. That is a problem as well but it is less serious than the false acceptance rate.
A biometric recognition system can run in two different modes: Identification or verification. In the identification case, the system is trained with the signatures of several persons. For each of the persons, a biometric signature is generated in the enrollment stage. A signature that is going to be identified is matched against every known signature, yielding either a score or a distance describing the similarity between the new signature and the stored ones. In the verification case, a person’s identity is claimed a priori. The signature that is verified only is compared with the person’s individual signature. Similar to identification, it is checked whether the similarity between new signature and stored ones is sufficient to provide access to the secured system or area.
10.3 User Authentication Techniques
The security field uses three different types of authentication [3]:
-
Something you know: A password, PIN, or piece of personal information
-
Something you have: A card key, smart card, or token (like a SecureID card)
-
Something you are: A biometric.
Table 10.1 shows a comparison between various existing user authentication techniques [4].
Biometrics is a measurable physical characteristic or personal behavioral trait used to recognize the identity, or verify the claimed identity of an enrollee. Biometrics is divided to two types; namely Physiological biometrics and behavioural biometrics. Physiological Biometrics are related to the shape of the body. Example, fingerprint, face recognition, DNA, hand and palm geometry, iris recognition. While behavioral biometrics are related to the behavior of a person. Examples, typing rhythm, gait, voice, Electroencephalography (EEG), Electrocardiogram (ECG). Some researchers have coined the term behaviometrics for this class of biometrics. Figure 10.2 illustrates the biometrics taxonomy.

Biometrics taxonomy
10.4 Physiological Biometrics Taxonomy
10.4.1 Finger Print
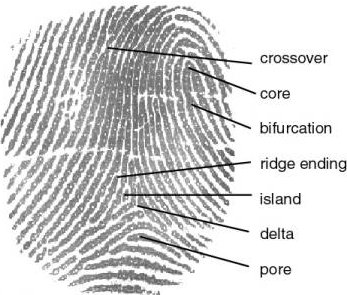
Fingerprint is the oldest biometric method in identity authentication and has been in use since 1896 especially for criminal identification. The main idea is based on fingertips that have corrugated skin with line like ridges flowing from one side of the finger to another. The flow of these ridges is non-continuous and it forms a pattern. The pattern of flow gives rise to a classification pattern such as arches, loops and whorls while the discontinuity in the ridge flow give rise to feature points, called minutiae as in Fig. 10.3 [5].

Finger print definition [22]
Fingerprint recognition can achieve good accuracy sufficient for both verification and identification. Because of low cost and compactness it is popular consumer product. On the other hand the sensor is not able to capture acceptable quality fingerprint images for people with very dry or wet skin [5].
10.4.2 Face
Face recognition is the oldest biometric known to man since the start of history. Human beings identified each other via the faces. With the spread in digital cameras, human face identification usage have grown. There are two main approaches for face identification namely; Feature-based approach and Holistic approach.
Feature-based approach extracts distinctive facial features such as the eyes, mouth, nose, etc., as well as other fiducial marks, and then compute the geometric relationships among those facial points, thus reducing the input facial image to a vector of geometric features. Standard statistical pattern recognition techniques are then employed to match faces using these measurements. While Holistic approaches identify faces using descriptions based on the entire image rather than on local features of the face [6] see Figs. 10.4 and 10.5.

Face detection feature-based approach [23]

Face detection holistic approach [5]
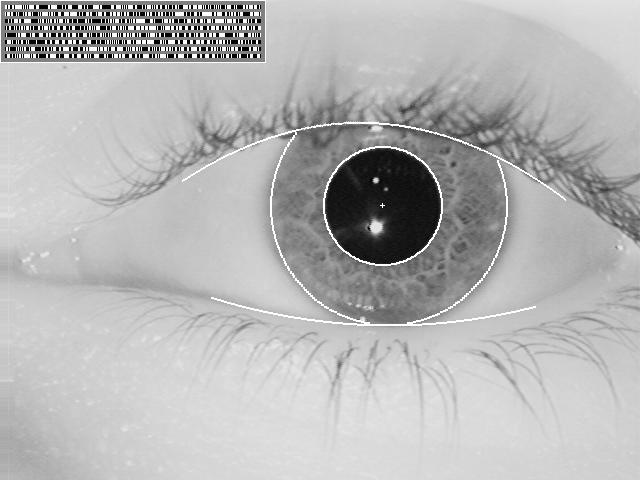
10.4.3 Iris
The iris is a thin, circular structure in the eye. It controls the diameter and size of the pupils and thus the amount of light reaching the retina. Eye colour is the colour of the iris [7]. Upon imaging an iris, a 2D Gabor wavelet filters and maps the segments of the iris into phasors (vectors). These phasors include information on the orientation and spatial frequency. This information is used to map the Iris Codes [7] see Fig. 10.6.

Iris encoding [24]
10.5 Behavioral Biometrics Taxonomy
10.5.1 Keystroke Dynamics
The idea behind Keystroke Dynamics has been around since World War II. It was well documented during the war that telegraph operators on many U.S. ships could recognize the sending operator. Known as the “Fist of the Sender,” the uniqueness in the keying rhythm (even of Morse-code), could distinguish one operator from another [8].
Keystroke dynamics is the process of analyzing the way a user types on a keyboard to identify their typing rhythm. A user’s typing pattern may be unique because similar neuro-physiological factors that make written signatures unique are also exhibited here Keystroke dynamics is a behavioral biometric Natural choice for computer login and network security [9]. The key features used are “flight time” the amount of time that a user spends “reaching” for a certain key and “dwell time” the amount of time a user spends pressing one key (See Fig. 10.7).

Flight and dwell time [25]
There are two modes of operation for keystroke dynamics systems; static verification and continuous verification. In static verification, the keystrokes are analyzed only at specific times e.g., during login. Static approaches provide more robust user verification than simple passwords, but static methods cannot detect substitution of the user after the initial verification. Continuous verification monitors the user’s typing behavior all the time.
10.5.2 Voice
Speaker, or voice, recognition uses a user’s voice for recognition purposes. It is a different from “speech recognition”, which recognizes words as they are articulated, which is not a biometric. The speaker recognition process relies on features influenced by both the physical structure of an individual’s vocal tract and the behavioral characteristics of the individual [10].
There are two forms for speaker recognition, text dependent and text independent. In text dependent mode the user is required to say a specific word or phrase while in text independent the user can say anything. The speaker recognition system analyzes the frequency content of the speech and compares characteristics such as the quality, duration, intensity dynamics, and pitch of the signal.
10.5.3 EEG
EEG signals are brain activities (see Fig. 10.8 Sample EEG Signal) recorded from electrodes positioned on the scalp. The EEG signals can be used in biometrics due to the advances in its hardware devices; there are some EEG signal capturing devices that are equal in size to a mobile phone or computer headset, data can be acquired continuously. After capturing, the data is filtered to remove artefacts. After the EEG signals have been cleaned, they can be analyzed using a variety of signal processing approaches. Lastly, a wide range of machine learning algorithms have been applied to perform the classification process.

Sample EEG signal
10.6 Multimodal Biometrics
Multimodal biometric systems are those which utilize, or have the capability of utilizing, more than one physiological or behavioral characteristic for enrollment, verification, or identification. Multimodal biometric systems combine multiple sources of biometric features. The integration of features is known as fusion. There are various levels of fusion namely raw data fusion, feature level fusion and score level fusion [11] (see Fig. 10.9 Fusion Levels).

Fusion levels
Sensor level fusion refers to the consolidation of raw data obtained using multiple compatible sensors or multiple snapshots of a biometric using a single sensor [12].
In feature level fusion, feature sets are calculated from different biometric feature sources and combined to a new feature set. The combination process can be homogeneous or non- homogeneous [13]. Dimensionality reduction scheme like feature selection/transformation may be applied to obtain a minimal feature set.
In Decision level fusion, different biometric matchers provide scores indicating the degree of similarity between the input and stored signatures for a specific user. The combined result is used as the total score of the fusion. The combination can be done by various means such as weighted decision, and, or,.. etc. From theoretical point of view the performance obtained by combining match scores from any number of matchers is guaranteed (on average) to be no worse than the best of the individual biometric matcher [14]. The key is to identify the appropriate method which combines the matching scores reliably and maximize the matching performance.
System Designers should take into consideration the following points while designing a multi modal system:
-
Cost versus performance
-
Throughput
-
Verification versus Identification mode
-
Choice and number of biometrics
-
Level of fusion
-
Fusion methodology
-
Assigning weights to biometrics
-
Multimodal databases
10.7 Applications
Depending on the application type, specific biometrics features will be best suited to be used. Below are some of the applications of using biometrics [10]:
-
Access Control
-
Criminals Detection
-
Monitor human behavior
-
Victim Detection
-
Marketing (methods of biometrics are used to identify owners of loyal cards)
-
Attendance systems at work, schools, etc.
-
Voting system (during the functionality of voting system identification/authentication of people, that take part in voting is demanded)
-
Biometric identifiers are used for registration if immigrants and foreign workers.
10.8 Machine Learning Techniques for Biometrics
In this section we will explore several of the machine learning techniques used in biometrics and specially using EEG signals as a biometric feature.
10.8.1 Fisher’s Discriminant Analysis
Riera et al. [15] have developed a multimodal authentication algorithm based on EEG and ECG signals. They conducted the test on 40 healthy subjects. Each subject was required to sit in a comfortable armchair, to relax, be quiet and close their eyes. Then 3 min takes are recorded to 32 subjects and four “3 min” takes are recorded to the 8 subjects. The 32 subject set are used as reference subject in the classification stage and the 8 subjects are the ones that are enrolled into the systems. Then several “1 min” takes are recorded afterwards to these enrolled subjects, in order to use them as authentication tests. Two electrodes were used to capture the EEG signals and 2 for the ECG. The data was divided to 4 s epochs.
The data acquisition module is the software that controls the ENOBIO [16] sensor in order to capture the raw data. Four channels are recorded: two EEG channels placed in the forehead, one ECG channel placed in the left wrist and one electrode placed in the right earlobe for referencing the data. At this point the data are separate in EEG data and ECG data and sent to two parallel but different biometric modules for EEG and ECG (Fig. 10.10).

System flowchart [15]
Figure shows Riera et al. system flowchart steps after the raw EEG and ECG data is collected from the sensors. Each biometric feature is processed separately by a set of modules each feature has the following steps:
-
1.
Signals are preprocessed
-
2.
Features Extraction
-
3.
Signature created and stored in DB
-
4.
When the user is authenticated the same steps are repeated but the new signature is compared to the signature in DB.
In Reira algorithm they worked with four different DFs:
-
Linear: Fits a multivariate normal density to each group, with a pooled estimate of the covariance.
-
Diagonal Linear: Same as “linear,” except that the covariance matrices are assumed to be diagonal.
-
Quadratic: Fits a multivariate normal density with covariance estimates stratified by group.
-
Diagonal Quadratic: Same as “quadratic,” except that the covariance matrices are assumed to be diagonal.
Two types of features were extracted from the 4 s epochs, one channel features (Auto regression, Fourier Transform) and Synchronicity features. Three features were selected from the Synchronicity features namely; Mutual information (measures the dependency degree between two random variables given in bits, when logarithms of base 2 are used in its computation), Coherence (quantizes the correlation between two time series at different frequencies), Correlation measures (measure of the similarity of two signals,). The classifier used in the authentication process is the classical Fisher’s Discriminant Analysis, Four different discriminant functions were used (Linear, Diagonal Linear, quadratic, diagonal quadratic). The five best classifiers from the original 28 classifiers generated for each subject are selected during the enrollment and authentication of each subject.
The False Acceptance Rate (FAR) is computed taking into account both the intruder and the impostor cases (21.8 %). The True Acceptance Rate (TAR) only takes into account the legal cases. (71.9 %).
After combining the 2 signals (EEG and ECG) the TAR is 97.9 % and the FAR is 0.82 %.
10.8.2 Linear Discriminant Classifier
Palaniappan [17] proposed a multiple mental thought identification modal. The experiment was conducted on four subjects. The subjects were seated in an Industrial Acoustics Company sound controlled booth with dim lighting and noise-less fan (for ventilation). An Electro-Cap elastic electrode cap was used to record EEG signals from positions C3, C4, P3, P4, O1 and O2 defined by the 10–20 system of electrode placement. Each subject was requested to do up to five mental tasks. Signals were recorded for 10 s during each task and each task was repeated 10 times. Each recording was segmented into 20 segments, each 0.5 s length. The five mental tasks performed by the subjects are:
-
Baseline task. The subjects were asked to relax and think of nothing in particular. This task was used as a control and as a baseline measure of the EEG signals.
-
Geometric Figure rotation task. The subjects were given 30 s to study a particular three-dimensional block object, after which the drawing was removed and the subjects were asked to visualize the object being rotated about an axis. The EEG signals were recorded during the mental rotation period.
-
Math task. The subjects were given nontrivial multiplication problems, such as 79 times 56 and were asked to solve them without vocalizing or making any other physical movements. The tasks were non-repeating and designed so that an immediate answer was not apparent. The subjects verified at the end of the task whether or not he/she arrived at the solution and no subject completed the task before the end of the 10 s recording session.
-
Mental letter composing task. The subjects were asked to mentally compose a letter to a friend or a relative without vocalizing. Since the task was repeated for several times the subjects were told to continue with the letter from where they left off.
-
Visual counting task. The subjects were asked to imagine a blackboard and to visualize numbers being written on the board sequentially, with the previous number being erased before the next number was written. The subjects were instructed not to verbalize the numbers but to visualize them. They were also told to resume counting from the previous task rather than starting over each time.
The captured data features were extracted using Auto Regression (AR) modeling. Six AR coefficients were obtained for each channel, giving a total of 36 feature vector for each EEG segment for a mental thought. When two mental thoughts were used, the size of the feature vector was 72 and so forth when more mental thoughts were used.
Linear Discriminant Classifier was used to classify the EEG feature vectors, LDC is a linear classification method that is computationally attractive as compared to other classifiers like artificial neural network. Various results were presented showing the error rate using 1, 2, …, 5 five combination of the mental tasks. Using 1 task an average of error rate is 2.6 %, while using the 5 mental tasks, the error rate was 0.1 %.
10.8.3 LVQ Neural Net
Cempírek and Šťastný [18], proposed neural network classification technique for user identification. The algorithm was conducted on a datasets of 8 subjects. The subject sat is a dim and silent room, eyes kept closed. Then the EEG recordings were segmented (segment length 180 s, step 22.5 s); the single segments were centered. Linear magnitude spectra of the single segments were computed by Fast Fourier transform (Hamming window was used).
Learning Vector Quantisation (LVQ) is a supervised version of vector quantization, similar to Self organizing Maps (SOM) (see [13, 19] for a comprehensive overview). It can be applied to pattern recognition, multi-class classification and data compression tasks, e.g. speech recognition, image processing or customer classification. As supervised method, LVQ uses known target output classifications for each input pattern of the form.
LVQ algorithms do not approximate density functions of class samples like Vector Quantization or Probabilistic Neural Networks do, but directly define class boundaries based on prototypes, a nearest-neighbor rule and a winner-takes-it-all paradigm. The main idea is to cover the input space of samples with ‘codebook vectors’ (CVs), each representing a region labelled with a class. A CV can be seen as a prototype of a class member, localized in the center of a class or decision region in the input space. As a result, the space is partitioned by hyper planes perpendicular to the linking line of two CVs. A class can be represented by an arbitrarily number of CVs, but one CV represents one class only [19].
The LVQ neural network is a self–organizing neural network, with added second layer for vectors classification intended to be used with unlabeled training data. The first network layer detects subclasses. The second layer combines these subclasses into one single class. Actually, the first layer computes distance between input and stored patterns; the winning neuron is the one with minimum distance. Hence LVQ network is a kind of nearest-neighbor classifier; it does not make clusters, but the algorithm search through the weights of connections between input layer neurons and output map neurons. These represent classes [18].
10.8.4 Neural Networks
Sun [20] has developed a user identification system based on Neural Networks. The system was tested on 9 subjects. The task was to imagine moving his or her left or right index finger in response to a highly predictable visual cue. EEG signals were recorded with 59 electrodes mounted according to the international 10-10 system. Only Signals from 15 electrodes were used in the system. Totally 180 trials were recorded for each subject. Ninety trials with half labeled left and the other half right were used for training, and the other 90 trials were for testing. Each trial lasted 6 s with two important cues. The preparation cue appeared at 3.75 s indicating which hand movement should be imagined, and the execution cue appeared at 5.0 s indicating it was time to carry out the assigned response. The common spatial patterns (CSP) is employed to carry out energy feature extraction. As a result, each trial is modeled by an 8-dimensional vector (4 sources from each kind of mental task is assumed in this paper). Based on these features, neural network classifiers can be learned. Neural networks of one hidden layer and one output layer for experiments. The results showed that imagining left index finger movements is more appropriate for personal identification. Left index movement gave a classification accuracy of 95.6 % and right index accuracy gave 94.81 %. To summarize the above mentioned techniques’, Table 10.2 presents a summary of these techniques.
10.9 Conclusion
Table 10.3 shows a comparison of various biometric technologies. High, Medium, and Low are Denoted by H, M, and L, Respectively.
A brief comparison of some of the biometric identifiers based on seven factors is provided in Table 10.3. Universality (do all people have it?), distinctiveness (can people be distinguished based on an identifier?), permanence (how permanent is the identifier?), and collectability (how well can the identifier be captured and quantified?) are properties of biometric identifiers. Performance (speed and accuracy), acceptability (willingness of people to use), and circumvention (foolproof) are attributes of biometric systems [21].
Table 10.4 Shows the advantages and disadvantages of each biometric. There is no right or wrong about selecting which biometric to use to for you specific access control. The implementer has to consider these factors while selecting the best biometric or combination of biometrics for their application.
-
Cost versus performance
-
Throughput
-
Verification versus Identification mode
-
Choice and number of biometrics
-
Level of fusion
-
Fusion methodology
-
Assigning weights to biometrics
-
Multimodal databases
In this chapter we explained the different types of popular biometrics that are used for access control. We have demonstrated the methodology for developing machine learning techniques for intelligent access control. Moreover, we showed the challenges that arise during the development of each step of the methodology. Moreover we explored various famous biometric techniques that are widely used and the advantages and disadvantages of each technique. We also presented the benefits and challenges for developing a multimodal biometric system. We also demonstrated some of the machine learning techniques used in biometrics. Finally we present a comparison for the biometric features covered in the chapter as depicted in Table 10.3.
References
Biometrics History: Biometrics.gov. http://www.biometrics.gov/Documents/BioHistory.pdf (2014). Accessed 26 Apr 2014
Gupta, C.N., Palaniappan, R.: Biometric paradigm using visual evoked potential. In: Encyclopedia of Information Science and Technology, vol. 1, 2nd edn, pp. 362–368 (2009)
Liu, S., Silverman, M.: A practical guide to biometric security technology. IT Prof. 3(1), 27–32 (2001)
Ratha, N.K., Connell, J.H., Bolle, R.M.: Enhancing security and privacy in biometrics-based authentication systems. IBM Syst. J. 40(31), 614–634 (2001)
Yun, Y.W.: The ‘123’ of biometric technology. In: Biometrics Working Group of Security and Privacy Standards Technical Committee, pp. 80–96 (2002)
Jafri, R., Arabnia, H.R.: A survey of face recognition techniques. J. Inf. Process. Syst. 5(2), 41–68 (2009)
Wildes, R.P.: Iris recognition: an emerging biometric technology. Proc. IEEE 85(9), 1348–1363 (1997)
Shen, P., Andrew, B., Jin, T., Shiang, Y.: A survey of keystroke dynamics biometrics. Sci. World J. 1–24 (2013)
Fabian, M., Aviel, R.: Keystroke dynamics as a biometric for authentication. Future Gener. Comput. Syst. 16, 351–359 (2000)
Biometrics.gov. http://www.biometrics.gov/ (2014). Accessed 26 Apr 2014
Arun, R., Anil, J.: Information fusion in biometrics. Pattern Recogn. Lett. 24, 2115–2125 (2003)
Ross, A., Jain, A.K.: Fusion techniques in multibiometric systems. In: Face Biometrics for Personal Identification, pp. 185–212. Springer (2007)
Ross, A., Nandakumar, K., Jain, A.K.: Handbook of Multibiometrics. Springer Science + Business Media, LLC (2006)
ISO/IEC TR 24722. Information technology. In: Biometrics: Multimodal and Other Multibiometric Fusion (2007)
Riera, A., Soria-Frisch, A., Caparrini, M., Cester, I., Ruffini, G.: Multimodal physiological biometrics authentication. In: Biometrics: Theory, Methods, and Applications, pp. 461–482. Wiley Press (2010)
ENOBIO. http://www.neuroelectrics.com/enobio (2014). Accessed 26 Apr 2014
Ramaswamy, P.: Multiple mental thought parametric classification: a new approach for individual identification. Proc. Int. J. Signal Process. 2, 222–226 (2006)
Cempírek, M., Šťastný, J.: The optimization of the EEG-based biometric classification. Appl. Electron. 25–28 (2007)
Forecasting with Artificial Neural Networks. http://www.neural-forecasting.com/lvq_neural_nets.htm (2014). Accessed 26 Apr 2014
Sun, S.: Multitask learning for EEG-based biometrics. In: Proceeding of International Conference on Pattern Recognition, pp. 51–55 (2008)
Jain, K.A., Pankanti, S., Prabhakar, S., Uludag, U.: Issues and challenges. Proc. IEEE 92(6), 948–960 (2004)
Finger Print Features. http://biometrics.derawi.com/wp-content/uploads/2011/01/fingerprint_definition.jpg (2014). Accessed 26 Apr 2014
Face Recognition Features. http://www.engineersgarage.com/sites/default/files/imagecache/Original/wysiwyg_imageupload/28714/Face-Recognition.jpg (2014). Accessed 26 Apr 2014
Iris Features. http://www.cl.cam.ac.uk/~jgd1000/iriscode.jpg (2014). Accessed 26 Apr 2014
KeyStroke Features. http://img.zdnet.com.cn/0/702/liIVtnoGEwL5o.jpg (2014). Accessed 26 Apr 2014
Author information
Authors and Affiliations
Corresponding author
Editor information
Editors and Affiliations
Rights and permissions
Copyright information
© 2016 Springer International Publishing Switzerland
About this chapter
Cite this chapter
Khalifa, W.H., Roushdy, M.I., Salem, AB.M. (2016). Machine Learning Techniques for Intelligent Access Control. In: Kountchev, R., Nakamatsu, K. (eds) New Approaches in Intelligent Image Analysis. Intelligent Systems Reference Library, vol 108. Springer, Cham. https://doi.org/10.1007/978-3-319-32192-9_10
Download citation
DOI: https://doi.org/10.1007/978-3-319-32192-9_10
Published:
Publisher Name: Springer, Cham
Print ISBN: 978-3-319-32190-5
Online ISBN: 978-3-319-32192-9
eBook Packages: EngineeringEngineering (R0)