
Abstract
The inability of central nervous system (CNS) neurons to regenerate damaged axons and dendrites following traumatic brain injury (TBI) creates a substantial obstacle for functional recovery. Apoptotic cell death, deposition of scar tissue, and growth-repressive molecules produced by glia further complicate the problem and make it challenging for re-growing axons to extend across injury sites. To date, there are no approved drugs for the treatment of TBI, accentuating the need for relevant leads. Cell-based and organotypic bioassays can better mimic outcomes within the native CNS microenvironment than target-based screening methods and thus should speed the discovery of therapeutic agents that induce axon or dendrite regeneration. Additionally, when used to screen focused chemical libraries such as small-molecule protein kinase inhibitors, these assays can help elucidate molecular mechanisms involved in neurite outgrowth and regeneration as well as identify novel drug targets. Here, we describe a phenotypic cellular (high content) screening assay that utilizes brain-derived primary neurons for screening small-molecule chemical libraries.
Access provided by CONRICYT – Journals CONACYT. Download protocol PDF
Key words
- High-content screening
- Primary neurons
- Cell-based assay
- Axon regeneration
- CNS injury
- Kinase inhibitor
- Drug discovery
1 Introduction
According to the Centers for Disease Control and Prevention (CDC), at least 1.7 million cases of traumatic brain injury (TBI) occur every year and contribute to one third of all injury-related deaths in the USA [1]. The mechanism of TBI progression often involves diffuse axonal injury , associated with axon shearing from mechanical trauma, neurodegeneration, and formation of amyloid protein aggregate in afflicted areas [2]. Therefore, regeneration of axons to reestablish interrupted connections is a critical step for functional recovery from TBI. The adult CNS, however, is characterized by a markedly low capacity for axonal regeneration [3]. This involves an intrinsic loss of regenerative ability in mature neurons, which is correlated with changes in expression of regeneration-associated genes [4, 5]. Furthermore, extension of axons from either mature or newly formed neurons is repressed by the presence of glial scars around damaged areas in the brain [6]. These scars contain growth-repressive molecules secreted by reactive astrocytes, of which chondroitin sulfate proteoglycans (CSPGs) are the best characterized [7–11]. Additionally, several myelin-associated proteins have been shown to negatively affect axon growth [7, 12–15]. Thus, identifying agents that can induce axon growth or overcome growth-repressive signals within the injury site could have significant clinical impact on the treatment of, and recovery from, TBI.
Over the past decade, phenotypic drug screening has been recognized as an effective method for discovering first-in-class drugs with new molecular modes of action [16]. In contrast to target-based screening, where the most selective ligands for a target involved in disease etiology are identified, phenotypic screening relies on complex cellular readouts [17, 18]. Phenotypic screening is therefore agnostic with regard to targets and molecular mechanisms . While this allows for the discovery of less selective, but potentially more effective drugs [19], the absence of prior knowledge regarding targets makes it difficult to optimize lead compounds or develop backups in case initial leads fail in clinical trials. However, phenotypic screening of focused and highly annotated chemical libraries, such as libraries of small molecules with verified activities against intracellular kinases, can identify effective pharmacological targets [20]. Kinases are proven drug targets in a multitude of diseases [21–26] and appear to be desirable targets in neurological disorders [20, 27–30]. Once a few candidate targets are identified, follow-up validation experiments, such as knockdown or overexpression, can be carried out to verify the relevance of the suggested targets and gain insight into their biological involvement [20, 31–33].
In this chapter, we detail a high-content bioassay suitable for low- to medium-throughput screening in the current reported format. It utilizes brain-derived primary neurons from E18 rat pups cultured on poly-d-lysine (PDL) and identifies protein kinase inhibitors that can promote neurite outgrowth (Fig. 1). The assay has an excellent Z′-factor of 0.73 and a relatively low false discovery rate of 7 % [20, 34].

High-content analysis of neurons in culture. Neurons cultured on PDL and immunostained for βIII-tubulin (cell bodies and neurites) and nuclei (Hoechst). Top left: Image of a neuron in a low-density culture treated with DMSO (control treatment). Top right: Image of a neuron in a low-density culture treated with a kinase inhibitor that promotes neurite outgrowth. Bottom right and left: Automated tracing of top images by the Cellomics Neuronal Profiling Bioaspplication software yields dozens of phenotypic measurements for each neuron. Scale bar 100 μm
2 Materials
2.1 Cell Preparation and Culture
-
1.
Hanks’ Balanced Salt Solution (HBSS; Life Technologies cat. no. 14170-112).
-
2.
1 M HEPES (Life Technologies cat. no. 15630-080).
-
3.
Glass Pasteur pipettes, flame polished.
-
4.
Hibernate®-E (Life Technologies cat. no. A12476-01).
-
5.
NbActiv4 Cell-culture media (BrainBits cat. no. Nb4-500).
-
6.
NeuroCult™ SM1 Supplement (Stemcell cat. no. 05711): Prepare 1 ml aliquots and store at −20 °C.
-
7.
2.5 % (wt/vol) trypsin: Aliquot for single use (0.5 ml) and store at −20 °C.
-
8.
DNase 30 mg/ml in ddH2O (Sigma-Aldrich cat. no. D-5025): Make 0.1 ml aliquots and store at −20 °C.
-
9.
Poly-d-lysine (PDL) solution, 0.5 mg/ml in HBSS prepared from PDL (molecular weight 30,000–70,000 kDa; Sigma-Aldrich, cat. no. P2636): Prepare stock at 1 mg/ml and store at −20 °C.
2.2 Immunostaining Reagents
-
1.
Phosphate-buffered saline (PBS) [add 0.02 % NaN3 for long-term storage of plates and solutions].
-
2.
4 % Paraformaldehyde (PFA) in PBS: Make stock solution at 16 % and store at −20 °C. Dilute immediately before use and do not refreeze.
PFA is a fixative and carcinogen: Exercise care when handling PFA and perform all steps inside a fume hood with sufficient protection. Be sure to properly dispose of waste PFA solution. To make 16 % PFA stock, dissolve 16 g paraformaldehyde (wear mask during weighing) in 90 ml ddH2O. Heat to 60 °C and stir until solution turns milky white. Add 0.1 M NaOH dropwise and continue stirring for at least 10 min after each drop. Repeat until solution is clear (keep at 60 °C and be patient). Check pH with pH strip and make sure that it is around 7.0.
-
3.
Blocking and permeabilization buffer (0.2 % fish gelatin, 0.03 % Triton X-100, in PBS).
-
4.
Anti-tubulin antibody: An antibody raised against βIII-tubulin [35] is recommended to avoid staining non-neuronal cells.
-
5.
Hoechst solution (10 mg/ml).
-
6.
Alexa Fluor® 488 Goat Anti-Mouse IgG (H + L) (Life Technologies cat. no. A-11029).
2.3 Equipment
-
1.
Biological safety cabinet, big enough to accommodate a dissecting microscope.
-
2.
Tissue culture incubator at 37 °C with humidified 5 % CO2 atm. Ensure that building and equipment (especially air pump) vibrations do not affect the incubator. These vibrations are often variable and can add noise to neurite outgrowth experiments. It may be necessary to set the incubator on vibration isolation blocks (such as VibraSystems ZA-124) to mitigate these effects.
-
3.
Water bath at 37 °C.
-
4.
Dissecting microscope.
-
5.
Sterilized dissecting tools: Fine-tipped forceps, micro-dissecting scissors.
-
6.
Hemocytometer or automated cell counter.
-
7.
Sterile plasticware: 5, 10 and 25 ml serological pipettes, Falcon™ 96-Well Flat- and Round-Bottom Plates (VWR cat. no. 80086-578), bacteriological dishes, 15 and 50 ml conical centrifuge tubes.
-
8.
Sterile cotton-plugged glass Pasteur pipettes.
-
9.
Sterile filter-plugged pipette tips (1200, 200, and 20 μl).
3 Methods
3.1 Pre-coating Culture Plates
-
1.
On the day before the experiment, pre-coat the 96-well plates with PDL (see Note 1 ) by plating 50 μl of PDL solution in each well. Since only the central 48 wells will be used for cell culture, it is recommended to save PDL by leaving the perimeter wells empty (see Subheading 3.3 and Fig. 2).
Fig. 2 
Cell plate layout: Load cells in indicated wells at 1500 cells per well in 150 μl of culture media
-
2.
Wash plates the next morning four or five times with HBSS or PBS (150 μl/rinse), and then leave in buffer until cell plating.

3.2 Preparing the Cells
-
1.
Euthanize pregnant rats timed to carry E18 embryos using an IACUC-approved method.
-
2.
In a laminar flow hood, remove the embryos and place in a petri dish containing HBSS with 20 mM HEPES, pH 7.3.
-
3.
Dissect pup brains [36] and collect hippocampi in 15 ml conical tube containing x ml of Hibernate E with SM1 (2 % v/v) (see Note 2 ).
-
4.
Prepare dissociation media by combining 4.5 ml of Hibernate E (without SM1) with 0.5 ml of trypsin and 100 μl of DNase solution.
-
5.
Carefully remove the medium over the hippocampi and then add dissociation solution.
-
6.
Incubate at 37 °C for 15–20 min, occasionally swirling the tube.
-
7.
Using flame-polished cotton-plugged Pasteur pipettes, remove the dissociation media and then add 5 ml of Hibernate E containing SM1. Swirl the tube to thoroughly wash the tissue. Allow the tissue to settle to the bottom of the tube and then carefully remove the rinse solution. Repeat this step five times to dilute out the trypsin and DNase and remove any debris from lysed cells.
-
8.
Remove final rinse media from the tube and then add 1 pipette-full (1–2 ml) of Hibernate E with SM1.
-
9.
Using the flame-polished Pasteur pipette (pre-wetted with rinse media), triturate until all cells are dissociated and no visible chunks of tissue remain. It is recommended to perform fewer than ten triturations as these adversely affect cell viability (usually six is enough) (see Note 3 ).
-
10.
Bring volume up to 8–12 ml using Hibernate E containing SM1, then mix well (tap tube; do not vortex), and determine cell concentration.
3.3 Plating
-
1.
Dilute cells in culture media to a final concentration of 10,000 cells/ml.
-
2.
Aspirate HBSS from PDL-coated plates.
-
3.
Load 150 μl of cell solution in the middle 48 wells (Fig. 2) at 1500 cells per well (see Notes 4 and 5 ). It is advisable to load culture media in the outer wells to decrease variations in cellular behavior from edge-wells effects.
-
4.
Allow cells to adhere for 2 h in tissue culture incubator prior to treatment.
3.4 Preparing Compound Dilution Plates
-
1.
Place culture medium in a 96-well plate (new—uncoated) as shown in Fig. 3 below (solution A = culture medium, solution B = culture medium + 0.8 % DMSO).
Fig. 3 
Compound masterplate layout: Load media in indicated wells at indicated volumes. A is the medium without DMSO and B is the medium with DMSO added
-
2.
Add 1 μl of compound stock solution (10 mM in DMSO) to the wells in row B containing 124 μl (Fig. 3). This will produce a final DMSO concentration of 0.8 % and a final compound concentration of 80 μM. Control wells receive 1 μl of DMSO.
-
3.
Using a multichannel manual P200 pipette, mix the solutions in the top row (3–5 times) and then move 25 μl to the row below. This results in a 1:5 dilution of compound while DMSO is held constant at 0.8 %. Repeat serial dilutions until the last row. This format allows for screening three compounds per plate at six concentrations with duplicate wells per condition.
-
4.
Equilibrate dilution plates in tissue culture incubator for 1–2 h.

3.5 Quality Control (QC)
It is important to calculate the Z′-factor for any bioassay, both for quantifying the dynamic range of the assay [37] and for performing regular QC (see Note 6 ). Include an additional plate (or more) with the corresponding treatment format below (Fig. 4). (C H is a compound that produces the high bioassay readout—in this case neurite outgrowth promotion, and C L is a compound that produces the opposite (low) effect—or neurite outgrowth repression. Both compounds must be prepared at 4× the corresponding concentration where their maximal effects are observed. See below.) In the current assay, ML-7 and Torin-2 can be used as promoter and repressor controls, respectively [34].

High/low control masterplate layout: Masterplates for high and low controls are prepared as indicated at 4× of final concentration where maximal effect is observed
3.6 Treatment
-
1.
Using a multichannel manual P200 pipette, aspirate 50 μl from the compound dilution plate and add to the corresponding row in the cell plate (see Notes 7 and 8 ). Final compound concentrations in assay: 0.0064, 0.032, 0.16, 0.8, 4, and 20 μM (in 0.2 % DMSO).
-
2.
Culture for 48 h.
3.7 Fixing the Cultures
-
1.
Remove medium from plates and immediately replace with 100–200 μl of warm (37 °C) PFA solution (see Subheading 4 for details about handling the plates).
-
2.
Fix for 15–20 min at room temperature.
-
3.
Rinse with PBS (200 μl/well × 3) (see Note 9 ).
3.8 Staining and Imaging
-
1.
Remove PBS and add 100 μl of blocking/permeabilization buffer (PBS, 0.2 % fish gelatin, 0.03 % Triton X-100, 0.02 % NaN3) and incubate overnight at 4 °C (can be stored over the weekend) (see Note 10 ).
-
2.
Add 100 μl of primary antibody solution (mouse anti-Beta III tubulin in blocking buffer) and incubate overnight at 4 °C (see Note 11 ).
-
3.
Rinse wells with PBS (200 μl × 3).
-
4.
Remove PBS and add 100 μl of secondary antibody solution (goat anti-mouse Alexa 488, 10 μg/ml Hoechst 33342, 0.2 % fish gelatin, 0.02 % azide, in PBS). Shake gently on a rotating shaker for 2 h.
-
5.
Rinse wells with PBS (200 μl × 5).
-
6.
Image plates using a Cellomics ArrayScan VTI in two different channels for nuclear staining (Hoechst) and cell body/neurite staining (βIII-tubulin). Typically, nine fields per well are imaged with a 5× objective and automatically traced by the Neuronal Profiling Bioapplication. To get reproducible results, at least 200–300 valid neurons (see below) should be measured per condition.
3.9 Data Analysis
-
1.
Export plate data in Excel sheet format.
-
2.
Filter out artifacts, cells that died upon plating, debris, etc. This can usually be achieved by setting inclusion cutoffs on phenotypic parameters. A set that works well for this assay includes the following cutoffs (NeuriteTotalLength >10 μm, NeuriteMaxLengthWithoutBranching < 500 μm, MinCellBodyArea > 100 μm2, MaxCellBodyArea < 3000 μm2, MaxNeuriteBranching < 50). Cutoffs for additional parameters (such as for nuclear or cell body average intensity) can be derived empirically and added as required. This leaves only the valid neurons in each well to be analyzed (see Note 12 )
-
3.
For each drug condition, normalize the data to the controls in the corresponding row. For example, to calculate the effect of Compound 1 on neurite total length (NTL) at 20 μM, use the following formula:
$$ \mathrm{Compound}1\kern0.5em \%\mathrm{N}\mathrm{T}\mathrm{L}\left(20\mu \mathrm{M}\right)=\frac{\mathrm{AVG}\left(\mathrm{B}{3}_{\mathrm{NTL}}+\mathrm{B}{4}_{\mathrm{NTL}}\right)}{\mathrm{AVG}\left(\mathrm{B}{9}_{\mathrm{NTL}}+\kern0.28em \mathrm{B}{10}_{\mathrm{NTL}}\right)}\times 100 $$where B3NTL and B4NTL are the averages of neurite total length in wells B3 and B4, and B9NTL and B10NTL are the averages of neurite total length in wells B9 and B10.
-
4.
Calculate the Z-score for each attribute using the following formula:
$$ \mathrm{Compound}1\kern0.5em \mathrm{Z}-\mathrm{score}\kern0.5em \mathrm{N}\mathrm{T}\mathrm{L}\left(20\mu \mathrm{M}\right)=\kern0.28em \frac{\mathrm{AVG}\left(\mathrm{B}{3}_{\mathrm{NTL}}+\mathrm{B}{4}_{\mathrm{NTL}}\right)-\kern0.28em \mathrm{A}\mathrm{V}\mathrm{G}\left(\mathrm{B}{9}_{\mathrm{NTL}}+\mathrm{B}{10}_{\mathrm{NTL}}\right)}{\sigma_{\mathrm{controls}}} $$where σ controls is the standard deviation for NTL in all DMSO wells within the plate (columns 9[B → G] and 10[B → G]).
-
5.
Calculate the Z′-factor for the assay using the high and low control (C H/C L) plate(s) according to the following formula:
$$ {\mathrm{Z}}^{\prime }-\mathrm{factor}=\frac{\left(3\sigma {C}_{\mathrm{H}}+3\sigma {C}_{\mathrm{L}}\right)}{\mu {C}_{\mathrm{H}}-\mu {C}_{\mathrm{H}}} $$where μC H and μC L are the means for the high and low (neurite outgrowth promoter and neurite outgrowth repressor) control wells, respectively, and σC H and σC L are the respective standard deviations.
-
6.
Hits are identified as compounds that fulfill the following criteria: %NTL > 130 %, NTL Z-score > 1.5, % valid neurons > 60 %, and valid neurons Z-score > −4 (Fig. 5). Hits must be confirmed in two independent screens. These criteria usually yield an average false discovery rate of ~10 %.
Fig. 5 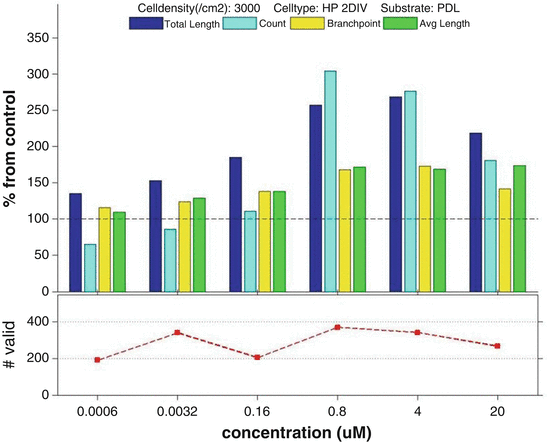
Phenotypic profile of ML-7, a kinase inhibitor that strongly promotes neurite outgrowth in cultured neurons: Bar chart: HCS data for ML-7 collected for four different parameters: Neurite total length, neurite count, neurite branching, and neurite average length and processed as described above to yield a phenotypic profile for ML-7 at six treatment doses. Lineplot: Total number of valid neurons at each data point

4 Notes
-
1.
The coating substrate can significantly influence the behavior of cells and growing neurites and thus the dynamic range and suitability of the assay for screening. PDL is a good substrate for detecting neurite outgrowth promoters, as it is only marginally permissive for neurite outgrowth, leaving a large margin for outgrowth induction by screened agents. If, on the other hand, a neurite outgrowth-promoting substrate (such as laminin) is used, most cells will extend long neurites, leaving less room for outgrowth induction by screened agents and decreasing the dynamic range of the experiment. However, that may make laminin a more suitable substrate when screening for agents that decrease neurite outgrowth.
-
2.
Different types of fully differentiated primary neurons exhibit significant differences in their gene expression profiles, which correlate with differences in response to various perturbagens. Selecting the most relevant cell type for a screening experiment can improve the success rate of follow-up hit validation prior to in vivo testing.
-
3.
Plating cells immediately after trituration will prevent clumping and improve the quality of the culture.
-
4.
If culturing cells in larger well size is desired, the assay can be scaled up. The volume of PDL coating solution and number of plated cells have to be increased proportionally to the well area to ensure consistent neurite outgrowth profiles. Increasing neuronal plating density can cause growing neurites to overlap before the experiment is terminated, thus making automated tracing difficult. Decreasing the plating density too much can result in decreased viability.
-
5.
When plating the cells, use a manual multichannel pipette and load gently. Alternatively, use the slowest speed setting on an electronic pipette. This helps avoid patterning in the wells, promote even spreading of the cells, and decrease variation from local changes in cell density.
-
6.
Variations in media components across different lots can induce enough variability to interfere with hit selection and increase the yield of false negatives. It is critical to run positive controls alongside each screen to ensure that the behavior of the cells is consistent across multiple experiments.
-
7.
When adding compound solutions to the cell plates, start with the final dilution (row G) and slowly add to the corresponding row of recipient cell plate (4× dilution, 50 μl of compound solution into 150 μl of cell culture). Repeat going up the rows (increasing concentration). For the Z′-factor plates, the row order for loading the treatment does not matter, since all rows have the same concentration. However, it is helpful to follow a consistent pattern of treatment for all plates.
-
8.
When taking cell plates out of the incubator for treating with compounds, do not take out more than five plates at a time. It is important to minimize the time the plates spend out of the incubator as exposure to room air can lead to changes in both temperature and pH of culture media, reducing viability.
-
9.
To avoid mechanical damage to delicate neurites and cellular structures, it is advisable to remove the rinse media by gently inverting the plates rather than using suction. If an automated plate washer is being used, make sure to program the washer to leave 50 ul in the wells at all times to avoid shearing and detachment of neural processes or cell bodies.
-
10.
If faster permeabilization and blocking are desirable, cells can be permeabilized in a higher Triton X-100 concentration (0.3 % in PBS) for 1 h and then blocked for 1 h.
-
11.
The primary antibody used for tubulin staining was produced in-house and is specific for the neuronal Beta-III tubulin isoform. Many acceptable anti-tubulin antibodies are commercially available, though most recognize all isoforms of beta tubulin and will thus stain all cells, not just neurons.
-
12.
Considering the large size of datasets generated from this kind of experiment, it is advisable to automate the data analysis process, for example using MatLab routines, provided that sufficient attention is given to QC and validation of all steps is performed.
References
Centers for Disease Control and Prevention (2013) Injury prevention and control: traumatic brain injury. Centers for Disease Control and Prevention, Washington, DC
DeKosky ST, Blennow K, Ikonomovic MD, Gandy S (2013) Acute and chronic traumatic encephalopathies: pathogenesis and biomarkers. Nat Rev Neurol 9:192–200
Cafferty WBJ, Mcgee AW, Strittmatter SM (2008) Axonal growth therapeutics: regeneration or sprouting or plasticity? Trends Neurosci 31:215–220
Blackmore MG, Moore DL, Smith RP, Goldberg JL, Bixby JL, Lemmon VP (2010) High content screening of cortical neurons identifies novel regulators of axon growth. Mol Cell Neurosci 44:43–54
Blackmore MG, Moore DL, Smith RP, Goldberg JL, Bixby L, Lemmon VP (2011) Regulators of axon growth. Mol Cell 44:43–54
Itoh T, Satou T, Nishida S, Hashimoto S, Ito H (2007) Immature and mature neurons coexist among glial scars after rat traumatic brain injury. Neurol Res 29:734–742
Sivasankaran R, Pei J, Wang KC, Zhang YP, Shields CB, Xu X-M, He Z (2004) PKC mediates inhibitory effects of myelin and chondroitin sulfate proteoglycans on axonal regeneration. Nat Neurosci 7:261–268
Shen Y, Tenney AP, Busch SA, Horn KP, Cuascut FX, Liu K, He Z, Silver J, Flanagan JG (2009) PTPsigma is a receptor for chondroitin sulfate proteoglycan, an inhibitor of neural regeneration. Science 326:592–596
Shields LBE, Zhang YP, Burke DA, Gray R, Shields CB (2008) Benefit of chondroitinase ABC on sensory axon regeneration in a laceration model of spinal cord injury in the rat. Surg Neurol 69:568–577, discussion 577
Monnier PP, Sierra A, Schwab JM, Henke-Fahle S, Mueller BK (2003) The Rho/ROCK pathway mediates neurite growth-inhibitory activity associated with the chondroitin sulfate proteoglycans of the CNS glial scar. Mol Cell Neurosci 22:319–330
Lingor P, Teusch N, Schwarz K, Mueller R, Mack H, Bähr M, Mueller BK (2007) Inhibition of Rho kinase (ROCK) increases neurite outgrowth on chondroitin sulphate proteoglycan in vitro and axonal regeneration in the adult optic nerve in vivo. J Neurochem 103:181–189
Lee JK, Zheng B (2012) Role of myelin-associated inhibitors in axonal repair after spinal cord injury. Exp Neurol 235:33. doi:10.1016/j.expneurol.2011.05.001
Lee JK, Chow R, Xie F, Chow SY, Tolentino KE, Zheng B (2010) Combined genetic attenuation of myelin and semaphorin-mediated growth inhibition is insufficient to promote serotonergic axon regeneration. J Neurosci 30:10899–10904
Filbin MT (2003) Myelin-associated inhibitors of axonal regeneration in the adult mammalian CNS. Nat Rev Neurosci 4:703–713
Wang H, Shen J, Xiong N, Zhao H, Chen Y (2011) Protein kinase B is involved in Nogo-66 inhibiting neurite outgrowth in PC12 cells. Neuroreport 22:733–738
Swinney DC, Anthony J (2011) How were new medicines discovered? Nat Rev Drug Discov 10:507–519
Giuliano KA (1997) High-content screening: a new approach to easing key bottlenecks in the drug discovery process. J Biomol Screen 2:249–259
Al-Ali H, Blackmore M, Bixby JL, Lemmon VP (2013) High content screening with primary neurons. Assay Guid Man
Frantz S (2005) Drug discovery: playing dirty. Nature 437:942–943
Al-Ali H, Lee D-H, Danzi M, Nassif H, Gautam P, Wennerberg K, Zuercher B, Drewry D, Lee JK, Lemmon V, Bixby J (2015) Rational polypharmacology: systematically identifying and engaging multiple drug targets to promote axon growth. ACS Chem Biol 10:1939
Klebl BM, Müller G (2005) Second-generation kinase inhibitors. Expert Opin Ther Targets 9:975–993
Pearce LR, Komander D, Alessi DR (2010) The nuts and bolts of AGC protein kinases. Nat Rev Mol Cell Biol 11:9–22
Pettus LH, Wurz RP (2008) Small molecule p38 MAP kinase inhibitors for the treatment of inflammatory diseases: novel structures and developments during 2006-2008. Curr Top Med Chem 8:1452–1467
Duffy P, Schmandke A, Schmandke A, Sigworth J, Narumiya S, Cafferty WBJ, Strittmatter SM (2009) Rho-associated kinase II (ROCKII) limits axonal growth after trauma within the adult mouse spinal cord. J Neurosci 29:15266–15276
Zhang J, Yang PL, Gray NS (2009) Targeting cancer with small molecule kinase inhibitors. Nat Rev Cancer 9:28–39
Don ASA, Tsang CK, Kazdoba TM, D’Arcangelo G, Young W, Zheng XFS (2012) Targeting mTOR as a novel therapeutic strategy for traumatic CNS injuries. Drug Discov Today 17:861–868
Bermel C, Tönges L, Planchamp V, Gillardon F, Weishaupt JH, Dietz GPH, Bähr M, Lingor P (2009) Combined inhibition of Cdk5 and ROCK additively increase cell survival, but not the regenerative response in regenerating retinal ganglion cells. Mol Cell Neurosci 42:427–437
Watanabe K, Ueno M, Kamiya D, Nishiyama A, Matsumura M, Wataya T, Takahashi JB, Nishikawa S, Nishikawa S, Muguruma K, Sasai Y (2007) A ROCK inhibitor permits survival of dissociated human embryonic stem cells. Nat Biotechnol 25:681–686
Mueller BK, Mack H, Teusch N (2005) Rho kinase, a promising drug target for neurological disorders. Nat Rev Drug Discov 4:387–398
Lu Q, Longo FM, Zhou H, Massa SM, Chen Y-H (2009) Signaling through Rho GTPase pathway as viable drug target. Curr Med Chem 16:1355–1365
Buchser WJ, Slepak TI, Gutierrez-Arenas O, Bixby JL, Lemmon VP (2010) Kinase/phosphatase overexpression reveals pathways regulating hippocampal neuron morphology. Mol Syst Biol 6:391
Loh SHY, Francescut L, Lingor P, Bähr M, Nicotera P (2008) Identification of new kinase clusters required for neurite outgrowth and retraction by a loss-of-function RNA interference screen. Cell Death Differ 15:283–298
Welsbie DS, Yang Z, Ge Y, Mitchell KL, Zhou X, Martin SE, Berlinicke CA, Hackler L, Fuller J, Fu J, Cao L-H, Han B, Auld D, Xue T, Hirai S-I, Germain L, Simard-Bisson C, Blouin R, Nguyen JV, Davis C-HO, Enke RA, Boye SL, Merbs SL, Marsh-Armstrong N, Hauswirth WW, Diantonio A, Nickells RW, Inglese J, Hanes J, Yau K-W, Quigley HA, Zack DJ (2013) Functional genomic screening identifies dual leucine zipper kinase as a key mediator of retinal ganglion cell death. Proc Natl Acad Sci U S A 110:4045–4050
Al-Ali H, Schürer SC, Lemmon VP, Bixby JL (2013) Chemical interrogation of the neuronal kinome using a primary cell-based screening assay. ACS Chem Biol 8:1027–1036
Lerch JK, Kuo F, Motti D, Morris R, Bixby JL, Lemmon VP (2012) Isoform diversity and regulation in peripheral and central neurons revealed through RNA-Seq. PLoS One 7:e30417
Meberg PJ, Miller MW (2003) Culturing hippocampal and cortical neurons. Methods Cell Biol 71:111–127
Zhang JJ-H, Chung T, Oldenburg K (1999) A Simple Statistical Parameter for Use in Evaluation and Validation of High Throughput Screening Assays. J Biomol Screen 4:67–73
Author information
Authors and Affiliations
Corresponding author
Editor information
Editors and Affiliations
Rights and permissions
Copyright information
© 2016 Springer Science+Business Media New York
About this protocol
Cite this protocol
Al-Ali, H., Lemmon, V.P., Bixby, J.L. (2016). Phenotypic Screening of Small-Molecule Inhibitors: Implications for Therapeutic Discovery and Drug Target Development in Traumatic Brain Injury. In: Kobeissy, F., Dixon, C., Hayes, R., Mondello, S. (eds) Injury Models of the Central Nervous System. Methods in Molecular Biology, vol 1462. Humana Press, New York, NY. https://doi.org/10.1007/978-1-4939-3816-2_37
Download citation
DOI: https://doi.org/10.1007/978-1-4939-3816-2_37
Published:
Publisher Name: Humana Press, New York, NY
Print ISBN: 978-1-4939-3814-8
Online ISBN: 978-1-4939-3816-2
eBook Packages: Springer Protocols