
Abstract
Live cell-based SELEX (Systematic Evolution of Ligand EXponential enrichment) is a promising approach for identifying aptamers that can selectively bind to a cell-surface antigen or a particular target cell population. In particular, it offers a facile selection strategy for some special cell-surface proteins that are original glycosylated or heavily post-translationally modified, and are unavailable in their native/active conformation after in vitro expression and purification. In this chapter, we describe evolution of cell-type-specific RNA aptamers targeting the human CCR5 by combining the live cell-based SELEX strategy with high-throughput sequencing (HTS) and bioinformatics analysis.
Access provided by CONRICYT – Journals CONACYT. Download protocol PDF
Key words
- Live cell-based SELEX
- Cell-type-specific RNA aptamer
- High-throughput sequencing (HTS)
- Human CCR5 protein
- Aptamer-mediated targeted siRNA delivery
1 Introduction
Nucleic acid aptamers are single-stranded DNA or RNA molecules, which can be selected from a combinatorial DNA or RNA library through SELEX technology [1, 2]. Because of their superior characteristics, such as small size, high stability (dehydrated form), lack of immunogenicity, facile chemical synthesis, and adaptable modification, aptamer and aptamer-functionalized agents have been used extensively for targeted therapeutics, molecular diagnostics, in vivo imaging and tracking systems, biosensor systems, and biomarker discovery [3–5]. To select and identify cell-type-specific, nucleic acid aptamers, two typically selection procedures have been applied [2]: (1) traditional purified membrane protein-based SELEX and (2) live cell-based SELEX. Although most cell-type-specific aptamers have been successfully generated using the purified protein-based selection procedure, it is largely limited to target some single pass receptors. It is challenging to develop aptamers for many multiple transmembrane spanning receptors, or some special cell-surface proteins that are original glycosylated or heavily post-translationally modified, and are unavailable in their native/active conformation after in vitro expression and purification. Live cell-based SELEX techniques have provided a promising alternative for generating aptamers that can recognize particular target membrane proteins under their native conditions [6, 7].
In principle, live cell-based SELEX methodology relies on the differences between the target cells population (positive cells that express the target of interest) and the control cell population (negative cells that do not express the target protein). Therefore, the selection procedure generally includes positive selection against the target cells and counter selection against related non-target cells to remove nonspecific binding [8]. For example, by using this method, Giangrande group successfully enriched for 2′-fluoropyrimidine RNA aptamers that could selectively bind and be internalized by breast cancer cells that expressed human EGFR2 (HER2) [9].
One of the major challenges of cell-based SELEX is the nonspecific binding and/or uptake of nucleic acids to dead cells, resulting in the delay of target-specific sequence enrichment or even failure of aptamer selection [2, 5]. Selection procedures, especially those that adversely affect cell health and damage cells, such as cell culture, washing condition, and detachment of cells, should be carefully controlled in order to avoid causing damage or death to fragile cells. On the other hand, the complexity of target cell-surface proteins or low expression of the desired targets generally increases the number of selection rounds needed (~14 cycles and up to 25 cycles) to achieve a high-affinity aptamers. The additional enzymatic amplification steps can also introduce biases and artifacts. Previous studies have demonstrated that once maximal molecular enrichment is achieved, further selection rounds not only increase the cost and time but also attenuate the efficiency of the selection as well as the efficacy of the aptamers [2]
In this chapter, we describe detailed practical procedures for live cell-based SELEX. Considering the limited resource and the risk of changed conformation of purified CCR5 protein after purification, we utilized live cell-based SELEX methodology for generating cell-type-specific 2′-fluoropyrimidine RNA aptamers directed to human CCR5. Particularly, the tricky steps and problems often encountered in the selection are highlighted and discussed in detail to improve the success and efficiency of the SELEX.
2 Materials
2.1 Cell Culture and Cell-Surface Target Protein Detection by Flow Cytometry
-
1.
U373-Magi cells, U373-Magi-CCR5E cells, CEM-NKr cells, CEM-NKr-CCR5 cells (AIDS Research and Reference Reagent Program).
-
2.
Complete medium for U373-Magi cells: 90 % DMEM (Dulbecco’s Modified Eagle Medium) supplemented with 10 % FBS (Fetal Bovine Serum), 0.2 mg/mL G418 and 0.1 mg/mL hygromycin B. Store at 4 °C.
-
3.
Complete medium for U373-Magi-CCR5E cells: 90 % DMEM supplemented with 10 % FBS, 0.2 mg/mL G418, 0.1 mg/mL hygromycin B and 1.0 μg/mL puromycin.
-
4.
Cell stripper solution (Cellgro, Mediatech Inc.). Store at 4 °C.
-
5.
Washing buffer: DPBS (Dulbecco’s Phosphate Buffered Saline) (Cellgro, Mediatech Inc.). Store in aliquots at 4 °C.
-
6.
Binding buffer: DPBS (pH 7.0–7.4) with Ca2+ and Mg2+ (pH 7.0–7.4, 1 mM CaCl2; 2.7 mM KCl; 1.47 mM KH2PO4; 1 mM MgCl2; 136.9 mM NaCl; 2.13 mM Na2HPO4) (Cellgro, Mediatech Inc.). Store in aliquots at 4 °C.
-
7.
APC-conjugated mouse Anti-human CD195 antibody (BD Pharmingen). Store at 4 °C.
-
8.
Flow cytometry instrument.
2.2 Preparation of RNA Library and Aptamer Selection
-
1.
The starting DNA library contained 20 nucleotides of random sequences (synthesized and obtained commercially). Make stock solution with water and store in aliquots at −20 °C (see Note 1 ).
-
2.
Taq PCR polymerase and buffer. Store in aliquots at −20 °C.
-
3.
dNTP. Make 10 mM dNTP mixture and store in aliquots at −20 °C.
-
4.
QIAquick Gel purification Kit (QIAGEN).
-
5.
DuraScribe T7 transcription Kit (EPICENTRE Biotechnologies). Store at −20 °C (see Note 2 ).
-
6.
DNase I. Store at −20 °C.
-
7.
RNase free Bio-Spin 30 Columns (Bio-Rad). Store at 4 °C.
-
8.
Acid phenol:chloroform (5:1) solution (pH 4.5, Ambion). Phenol and chloroform are human health hazards. Take appropriate measures to prevent exposure.
-
9.
Chloroform:Isopropanol (24:1) solution.
-
10.
Glycogen (20 mg/mL). Store in aliquots at −20 °C.
-
11.
RNA refolding and binding buffer: DPBS (pH 7.0–7.4) with Ca2+ and Mg2+ (pH 7.0–7.4, 1 mM CaCl2; 2.7 mM KCl; 1.47 mM KH2PO4; 1 mM MgCl2; 136.9 mM NaCl; 2.13 mM Na2HPO4) (Cellgro, Mediatech Inc.). Store in aliquots at 4 °C.
-
12.
Yeast tRNA. Make 10 mg/mL in water and store in aliquots at −20 °C.
-
13.
TRIzol reagent (Invitrogen). This reagent containing phenol and guanidine is a human health hazard. Take appropriate measures to prevent exposure. Store in aliquots at 4 °C.
-
14.
ThermoScript RT-PCR system (Invitrogen) (see Note 3 ).
-
15.
2× iQ SyberGreen MasterMix (BIO-RAD) for PCR. Store at −20 °C.
2.3 Illumina High-Throughput Sequencing (HTS) and Data Analysis
-
1.
The relevant PCR primer. Prepare 5 mM stock solution in water and store in aliquots at −20 °C (see Note 4 ).
-
2.
Forty percent acrylamide/bis-acrylamide solution (AccuGel 19:1, National Diagnostics). This is a neurotoxin when unpolymerized. Take appropriate measures to prevent exposure.
-
3.
N,N,N,N'-Tetramethyl-ethylenediamine (TEMED). Store at 4 °C.
-
4.
Ammonium persulfate: prepare 10 % solution in water and immediately freeze in single use (150 μL) aliquots at −20 °C.
-
5.
10 × TBE.
-
6.
Running buffer (1 × TBE): dilute 10 × TBE with water. Store at room temperature.
-
7.
Illumina HiSeq2000 instrument.
2.4 Flow Cytometry and Live-Cell Confocal Microscopy
-
1.
Silencer siRNA Labeling Kit (Ambion). Store at −20 °C.
-
2.
Trypsin/EDTA 1 × solution. Store in aliquots at 4 °C.
-
3.
Peripheral blood mononuclear cells (PBMCs) from healthy volunteers. Isolate PBMCs from whole blood by centrifugation through Ficoll-Hypaque solution (Histopaque-1077, Sigma) and deplete for CD8 T cells (cytotoxic/suppressor cells) using Dynabeads CD8 (Invitrogen, CA). Culture PBMCs in T-cell active medium (BioE) in a humidified 5 % CO2 incubator at 37 °C.
-
4.
35 mm plates for live-cell confocal microscopy (Glass Bottom Dish, MatTek).
-
5.
Poly-lysine.
-
6.
Hoechst 33342 (Molecular Probes): prepare 0.15 mg/mL solution in water and store in aliquots at 4 °C.
-
7.
Zeiss LSM 510 Meta Inverted 2 photon confocal microscope.
2.5 CCR5 Knockdown Experiment
-
1.
The CCR5 siRNA and relevant PCR primer. Prepare 5 mM stock solution in water and store in aliquots at −20 °C (see Note 5 ).
-
2.
Lipofectamine 2000 (Invitrogen).
-
3.
STAT-60 reagent (TEL-TEST). This reagent containing phenol and guanidine is a human health hazard. Take appropriate measures to prevent exposure. Store in aliquots at 4 °C.
-
4.
DNA-free DNA removal kit (Ambion). Store at −20 °C.
-
5.
RNase inhibitor (Promega). Store at −20 °C.
-
6.
Moloney murine leukemia virus reverse transcriptase (MML-RT) and random primers (Invitrogen). Store at −20 °C.
-
7.
2× iQ SyberGreen MasterMix (BIO-RAD) for PCR. Store at −20 °C.
-
8.
CFX96 Touch™ Real-Time PCR Detection System (Bio-Rad).
3 Methods
By combining the live cell-based SELEX strategy with high-throughput sequencing (HTS) and bioinformatics analysis, 2′-fluoropyridine-modified RNA aptamers directed to human CCR5 can be successfully isolated. The high-throughput sequencing (HTS) technology and bioinformatics analysis facilitate the rapid identification of individual RNA aptamers and monitor the library evolution. Multiple SELEX libraries from different rounds of selection can simultaneously be analyzed by HTS. Millions of sequence reads obtained from each round can provide comprehensive and in-depth information, such as the basic sequences, total reads, the complexity of the library, the enrichment factor, frequency of each unique sequences, and distribution of each nucleotide at random region, which allow us to better understand the selection progression and the molecular evolution. One of the best candidates (G-3) efficiently binds CCR5 and is internalized into human CCR5 expressing U373-Magi-CCR5E cells, CEM-NKr-CCR5 cells, and primary PBMCs. The selection procedures, progression, and aptamer characterization are described in this section.
3.1 Detection of the Cell-Surface Target Protein (CCR5)
-
1.
Wash the adherent cell lines (U373-Magi cells and U373-Magi-CCR5E cells) with pre-warmed DPBS, and detach cells with Cell stripper from the plates (see Note 6 ).
-
2.
After washing cells twice with 500 μL binding buffer containing DPBS (pH 7.0–7.4) and Ca2+ and Mg2+, resuspend cell pellets in binding buffer and incubate at 37 °C for 30 min. And then pellet cells and resuspend in 100 μL of pre-warmed binding buffer (see Note 7 ).
-
3.
Add APC mouse anti-human CD195 antibody for cell-surface staining (see Note 8 ). After incubation at room temperature for 30 min in the dark, wash cells three times with 500 μL of pre-warmed binding buffer, and resuspend cells in 350 μL of DPBS pre-warmed to 37 °C and immediately analyze by flow cytometry. An example result is shown in Fig. 1.
Fig. 1 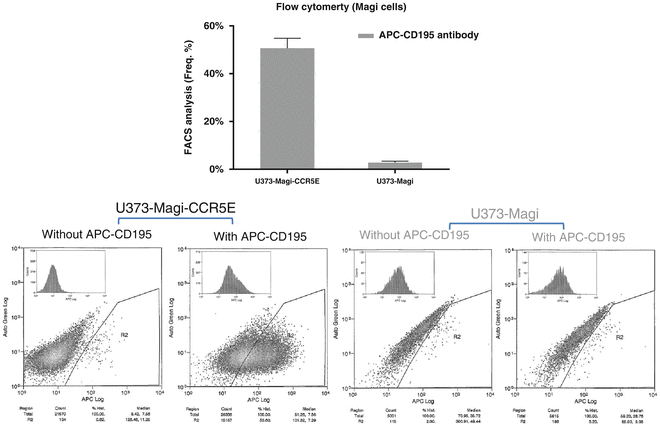
Cell-surface expression of CCR5 on U373-Magi-CCR5E cells and U373-Magi cells was measured by flow cytometry using non-permeabilized cells stained with CCR5 antibody conjugated to APC (APC anti-human CD195). (Reprinted from [17], Figure S1)

3.2 Generation of RNA Library by In Vitro Transcription
-
1.
Amplify the initial single-stranded DNA library pool (0.4 μM) by PCR using 3 μM each of 5′- and 3′-primers, along with 2 mM MgCl2 and 200 μM of each dNTP. Conduct 10 PCR cycles as follows: 93 °C, 3 min (the initial step); 93 °C, 1 min, 63 °C, 1 min, 72 °C, 1 min; 72 °C, 7 min (the last step); 4 °C, keep! (see Note 9 ).
-
2.
Recover the resulting PCR products using a QIAquick Gel purification Kit.
-
3.
Transcribe RNA library from its PCR-generated DNA templates using the DuraScription Kit. In the transcription reaction mixture, replace CTP and UTP with 2′-F-CTP and 2′-F-UTP (please refer to Subheading 2) to produce RNA that is resistant to RNase A degradation. Set up a 20 μL transcription reaction, by mixing:
-
(a)
1 μg of DNA template.
-
(b)
2 μL 10 × buffer.
-
(c)
2 μL ATP (50 mM).
-
(d)
2 μL GTP (50 mM).
-
(e)
2 μL 2′-F-dCTP (50 mM).
-
(f)
2 μL 2′-F-dUTP (50 mM).
-
(g)
2 μL DTT (100 mM).
-
(h)
2 μL T7 RNA polymerase.
Incubate at 37 °C for 6 h (see Note 10 ), and purify with Bio-Spin 30 Columns following phenol extraction and ethanol precipitation. And resuspend RNA pellet into water.
-
(a)
-
4.
Remove the template DNA by DNase I digestion. Set up a 200 μL reaction, by mixing:
-
(a)
10 μg of the transcribed RNA pool.
-
(b)
20 μL 10 × reaction buffer.
-
(c)
5 μL DNase I.
Incubate at 37 °C for 1 h (see Note 11 ). After phenol extraction and ethanol precipitation, resuspend RNA pellet into RNase-free water.
-
(a)
-
5.
Refold RNA pool in binding buffer containing DPBS (pH 7.0–7.4) and Ca2+ and Mg2+, by heating mixture at 65 °C for 5 min and then slowly cooling to 37 °C. Continue incubation at 37 °C for 10 min.
3.3 Live Cell-Based SELEX
-
1.
In principle, perform a SELEX procedure as described by Tuerk and Gold [10]. In this case, conduct a modified cell-based SELEX described by Thiel et al. [9, 11–13]. The detailed selection procedure and conditions are summarized in Fig. 2 and Table 1 (see Note 12 ).
Fig. 2 
Schematic of live cell-based SELEX procedure for evolution of RNA aptamers. It consists of four main steps: (1) counter selection by incubating library with negative cells that do not express the target protein; (2) positive selection by incubating recovered unbound sequences with positive cells expressing the target protein; (3) recovery of target-bound sequences; and finally (4) re-amplification of recovered species and make new RNA pool for next selection round. After 5–10 selection cycles, individual aptamer sequences are identified through barcode-based high-throughput, Illumina Deep Sequencing (HTS) and bioinformatics analysis. (Reprinted from [17], Fig. 1a)
Table 1 The selection condition. The numbers of cells, plate size, medium volume, the amount of RNA pool and tRNA, washing condition, and incubation time are indicated here. (Reprinted from [17], Table S1) -
2.
For the first cycle of selection, 24 h before selection, seed U373-Magi cells (CCR5-negative) and U373-Magi-CCR5E cells (CCR5-positive) at equal density (5 × 10⁶ cells per plate, respectively) on 150 mm tissue culture dish with 25 mL complete culture medium.
-
3.
On the day of selection, wash U373-Magi cells and U373-Magi-CCR5E cells with 15 mL pre-warmed binding buffer to remove dead cells, and add 15 mL pre-warmed binding buffer supplemented with 100 μg/mL yeast tRNAs (see Note 13 ).
-
4.
After 25 min incubation at 37 °C, remove the buffer from U373-Magi cells and add the refolded, initial RNA library (4 nmol of 0-RNA library in 15 mL refolding buffer). Incubate at 37 °C for 30 min and collect the supernatants from U373-Magi cells. Discard the U373-Magi cells (see Note 14 ).
-
5.
Following step 4, after 25 min incubation at 37 °C, remove the buffer from U373-Magi-CCR5E cells and add the supernatants from U373-Magi cells (15 mL from step 5). Incubate at 37 °C for 30 min. Wash the U373-Magi-CCR5E cells twice with 12 mL pre-warm binding buffer to remove unbound sequences and cell-surface RNAs with weak binding (see Note 15 ).
-
6.
Recover the cell-surface bound RNA with strong binding affinity and internalized RNA sequences by TRIZol extraction. After ethanol precipitation, resuspend RNA pellet into RNase-free water (see Note 16 ).
-
7.
Reversely transcribe the recovered RNA pool by using the ThermoScript RT-PCR system. Add 1 μL of 10 μM gene-specific primer (reverse primer) and 2 μL of 10 mM dNTP mixture into 9 μL of the recovered RNA, and heat at 65 °C for 5 min. Immediately, chill the reaction on the ice. Subsequently, add the following reagents:
-
(a)
4 μL 5 × First strand buffer.
-
(b)
1 μL 0.1 M DTT.
-
(c)
1 μL RNaseOut (40 U/μL).
-
(d)
1 μL ThermoScript RT (15 U/μL).
-
(e)
1 μL RNase-free water.
Incubate the reaction (total volume of 20 μL) at 50 °C for 60 min. Heat the mixture at 85 °C for 5 min to inactivate reverse transcriptase and chill on ice. The cDNA is ready for PCR (see Note 17 ).
-
(a)
-
8.
Amplify the cDNA by PCR using 2 μM each of 5′- and 3′-primers, along with 2 mM MgCl2 and 200 μM of each dNTP. Conduct 15 PCR cycles as follows: 94 °C, 5 min; 94 °C, 1 min, 63 °C, 1 min, 72 °C, 1 min; 72 °C, 7 min; 4 °C, keep! Run 2.5 % agarose gel to verify PCR product (see Note 18 )
-
9.
Recover the resulting PCR products using a QIAquick Gel purification Kit and transcribe it to new RNA pool as described in Subheading 3.2.
-
10.
After purification, refold the new RNA pool for the next selection round (counter selection and positive selection) as described in Subheading 3.3 (see Note 15 )

3.4 Monitor the Progress of SELEX or Detect Binding Affinity by qRT-PCR
-
1.
Apply quantitative real-time PCR (qRT-PCR) methods to monitor SELEX progress.
-
2.
24 h before selection, seed U373-Magi cells (CCR5-negative) and U373-Magi-CCR5E cells (CCR5-positive) at equal density (3 × 10⁴ cells per well, respectively) on a 48-well plate with 250 μL complete culture medium.
-
3.
On the day of selection, wash U373-Magi cells and U373-Magi-CCR5E cells with 250 μL pre-warmed binding buffer to remove dead cells, and add 250 μL pre-warmed binding buffer supplemented with 100 μg/mL yeast tRNAs.
-
4.
After 15 min incubation at 37 °C, remove the buffer from both cell lines and add the refolded RNA library or RNA aptamer candidate (0.1 nmol of RNA library in 250 μL refolding buffer) supplemented with 1 nmol yeast tRNA.
-
5.
Incubate at 37 °C for 15 min. Wash the cells six times with 250 μL pre-warmed binding buffer to remove unbound RNA and cell-surface RNAs with weak binding.
-
6.
Recover the cell-surface bound RNA with strong binding affinity and internalized RNA sequences by TRIZol extraction. And reversely transcribe those recovered RNA pools as described in Subheading 3.3.
-
7.
Analyze the resulting cDNA by qRT-PCR using 2 × iQ SyberGreen Mastermix and specific primer sets at a final concentration of 400 nM (triplex assay). An example result is shown in Fig. 3 (see Note 19 ).
Fig. 3 
The progress of SELEX. Progression of the selection was monitored using quantitative RT-PCR (qRT-PCR) and normalizing to GAPDH gene. Nine rounds of live cell-based SELEX were performed to enrich for RNA aptamers that bind and internalize into U373-MAGI-CCR5E (CCR5+) cells. Nonspecific aptamers were removed by pre-clearing against U373-MAGI (CCR5−) cells. From the seventh selection round, selective binding/internalization of RNA pools was observed in U373-MAGI-CCR5E (CCR5+) cells. (Reprinted from [17], Fig. 1b)
Add the following reagents in one 25 μL qPCR reaction:
-
(a)
1 μL cDNA reaction mixture.
-
(b)
12.5 μL 2 × iQ SyberGreen Mastermix.
-
(c)
2 μL primer mixture (5 mM).
-
(d)
9.5 μL RNase-free water.
Standard PCR program: 1 cycle of 94 °C for 5 min; 35–40 cycles of 94 °C for 30 s; 55–62 °C (mostly 60) for 30 s; 72 °C for 30 s; 1 cycle of 72 °C for 5 min.
-
(a)

3.5 Illumina High-Throughput Sequencing (HTS) and Data Analysis
-
1.
After nine rounds of SELEX, send the RNA libraries for selection rounds 5, 6, 7, 8, and 9 for Illumina high-throughput sequencing analysis.
-
2.
Reversely transcribe 1 μg of RNA library using RT primer and amplify the resulting cDNA by 8 PCR cycles. Gel purify the product and dilute with 1 mL of hybridization buffer. Use a final DNA concentration of 10 pM for single read flow cell cluster generation (see Note 4 ).
-
3.
Bioinformatics analysis (see Note 20 ). Count unique reads in each sample and identify the most frequent 1000 unique sequences in each sample. For alignment and grouping analysis, classify the top 40 unique sequences into six major groups (groups 1–6) based on the similarity in the sequences and secondary structures. Predict their secondary structures by MFold RNA (http://mfold.rna.albany.edu/?q=mfold/RNA-Folding-Form). An example result is shown in Table 2 and Fig. 4.
Table 2 Bioinformatics analysis of high-throughput sequence data from selection rounds. (a) The total reads and useful reads were defined as follows. The 3′-fixed oligo sequence and 3′-Solexa adapter were identified and trimmed from each reads. The reads with 20-base (random domain) after processing were considered as usable reads and retained for further analysis. The most frequent 1000 unique sequences were identified and listed here for the clarity. The molecular enrichment at each round was calculated by the formula (total reads of top 1000 unique sequences at round X/round 5). (b) Bioinformatics analysis of RNA aptamers to identify related sequence and structure groups. After alignment of top 40 sequences, six groups of RNA aptamers were identified. The representative RNA aptamers and the reads of each group are listed here. Only the random sequences of the aptamer core regions (5′–3′) are indicated. Groups 2, 4, and 5 (G-2, G-4, and G-5 aptamers) shared a conserved sequence, which is comprised of 10 nucleotides UUCGUCUG(U/G)G. (Reprinted from [17], Tables 1 and 2) Fig. 4 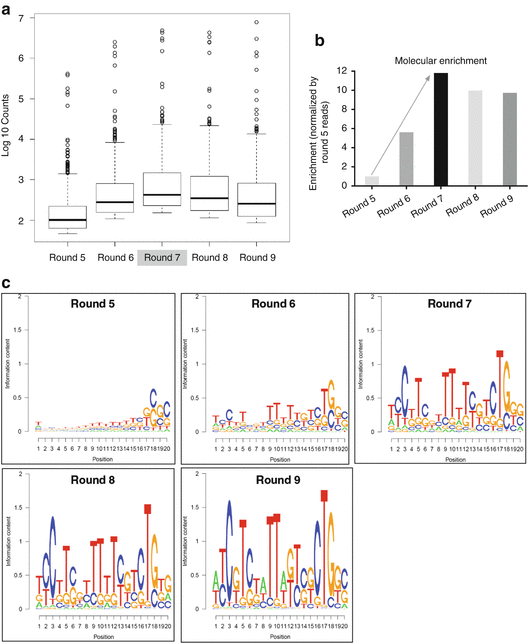

Bioinformatics analysis of high-throughput sequence data from selection rounds. (a) Distribution of frequencies of top 1000 unique sequences at each round. The most frequent 1000 unique sequences were identified at each selection round. From Round 7, enrichment saturation was observed. (b) The molecular enrichment at each round. The molecular enrichment at each round was calculated by the formula (total reads of top 1000 sequences in round X/round 5). From Round 5 to Round 9, the molecular diversity was significantly converged, suggesting some specific sequences have been enriched. (c) Sequence logo for each select round. Bioinformatics analysis of RNA aptamers to identify related sequence and structure families. Through the alignment of primary sequences, the distributions within each round were identified at the 20-nt random domain. From Round 7, highly represented sequences were observed. (d) The frequency of each group at each selection round. After alignment of top 40 sequences, six groups of RNA aptamers were identified. The percent frequency of each group at each selection round was calculated by the formula (the reads of each group/the useful reads at each round). (Reprinted from [17], Figure S2a, b and Fig. 1c, d)


3.6 Cell-Surface Binding and Internalization Studies by Flow Cytometry
-
1.
Generate 2’-fluoropurimidine modified RNA aptamers (G-1, G-2, G-3, G-4, G-5, and G-6) as described in Subheading 3.2 (see Note 21 )
-
2.
Generate fluorescent aptamers using the Silencer siRNA Labeling Kit (see Note 22 ). Add the following reagents in order:
-
(a)
22.5 μL nuclease-free water.
-
(b)
5 μL 10 × Labeling Buffer.
-
(c)
15 μL RNA (5 μg).
-
(d)
7.5 μL Labeling Dye.
Incubate at 37 °C for 1 h.
-
(a)
-
3.
After incubation, add 5.0 μL (0.1 vol) 5 M NaCl and 125 μL (2.5 vol) cold 100 % EtOH, and mix thoroughly. Incubate at −20 °C for 60 min. And then centrifuge at top speed in a microcentrifuge (12,000 × g) at 4 °C for 20 min. Remove supernatant and wash pellet with 175 μL of 70 % EtOH. Air dry pellet in the dark. And then suspend labeled RNA in 15 μL of nuclease-free water.
-
4.
Measure the absorbance of the labeled RNA at 260 nm and at the absorbance maximum for the fluorescent dye (Cy3 at 550 nm).
-
5.
Calculate the base:dye ratio and RNA concentration according to the calculator provided by http://www.genelink.com/tools/gl-BDratiores.asp (see Note 23 ).
-
6.
Refold the mixture in refolding buffer as described above (see Subheading 3.2).
-
7.
Cell-surface binding assay with adherent cell lines: Wash U373-Magi cells or U373-Magi-CCR5E cells with pre-warmed DPBS, and detach cells with Cell stripper from the plates (see Note 6 ).
-
8.
Cell-surface binding assay with suspension cells: directly pellet the CEM-NKr cells, CEM-NKr-CCR5 cells, or PBMCs from the flask.
-
9.
After washing cells twice with 500 μL binding buffer containing DPBS (pH 7.0–7.4) and Ca2+ and Mg2+, resuspend cell pellets in binding buffer and incubate at 37 °C for 30 min. And then pellet cells and resuspend in 100 μL of pre-warmed binding buffer (see Note 7 ).
-
10.
Add the refolded Cy3-labeled experimental RNAs and incubate at RT for 30 min in the dark (see Note 24 ).
-
11.
Wash cells three times with 500 μL of pre-warmed binding buffer, and resuspend cells in 350 μL of DPBS pre-warmed to 37 °C and immediately analyze by flow cytometry. An example result is shown in Fig. 5.
Fig. 5 
Cell-type-specific binding and internalization studies of individual RNA aptamers. (a) Cell-type-specific binding/internalization was evaluated by qRT-PCR. Six representative RNA aptamers from each groups were incubated with U373-Magi-CCR5E (CCR5 positive) cells or U373-Magi negative cells. The total RNA was isolated for cDNA synthesis followed by qPCR amplification. The RNA aptamers showed selective binding/internalization to CCR5 expressing cells. The 0-RNA pool was used as negative controls. Data represent the average of three replicates. Cell-surface binding of Cy3-labeled RNAs was assessed by flow cytometry. The 0-RNA pool was used as negative control. Data represent the average of three replicates. (b) Cy3-labeled RNAs were tested for binding to U373-Magi-CCR5 positive cells and U373-Magi negative cells. The selected aptamers showed cell-type-specific binding affinity. APC-CD195 antibody was used to stain cellular surface CCR5. (c) One of the best RNA aptamer, G-3, was chosen for further binding affinity test with PBMC-CD4+ cells, CEM-NKr-CCR5 positive cells, CEM negative cells. (d) Cell-surface binding constant (Kd) of G-3 aptamer was evaluated. The U373-Magi-CCR5 positive cells, CEM-NKr-CCR5 positive cells, and CEM negative cells were incubated with the increasing amounts of Cy3-labeled G-3 aptamer. The binding affinity was analyzed by flow cytometry assay. The calculated Kd determinations are indicated. (Reprinted from [17], Fig. 2a, b, c and d)

3.7 Cell-Surface Binding and Internalization Studies by Live-Cell Confocal Microscopy
-
1.
Prepare and refold Cy3-labeled aptamers as described above (see Subheading 3.6).
-
2.
For the adherent cell lines: Before one day of assay, grow the U373-Magi cells or U373-Magi-CCR5E cells in 35 mm plate pre-treated with poly-lysine seeding at 0.3 × 10⁶ in 2 mL of complete medium to allow about 70–80 % confluence in 24 h (see Note 25 ). On the day of the experiments, wash cells with 1 mL of pre-warmed binding buffer and then incubate with 1.5 mL of pre-warmed complete growth medium for 30–60 min in a humidified 5 % CO2 incubator at 37 °C.
-
3.
For the suspension cells: on the day of experiments, pellet the cells CEM-NKr cells, CEM-NKr-CCR5 cells, or PBMCs from the flask. Wash the cells twice with pre-warmed binding buffer and grow the cells in 35 mm plate pre-treated with poly-lysine seeding at 1 × 10⁶ in 1.5 mL of complete medium. Incubate the cells for 30–60 min in a humidified 5 % CO2 incubator at 37 °C for attaching on the dish surface.
-
4.
Add the Cy3-labeled aptamer at a 67 nM final concentration into the media and incubate for live-cell confocal microscopy in a 5 % CO2 microscopy incubator at 37 °C. Collect the images every 15 min using a Zeiss LSM 510 Meta Inverted 2 photon confocal microscope system under water immersion at 40 × magnification.
-
5.
After 4–5 h of incubation and imaging, stain the cells with 0.15 mg/mL Hoechst 33342 (nuclear dye for live cells) for 15 min at 37 °C. Collect the images are as described above. An example result is shown in Fig. 6 .
Fig. 6 

Internalization analysis. (a) U373-Magi-CCR5 positive cells, U373-Magi negative cells, CEM-NKr-CCR5 positive cells, CEM negative cells, or (b) PBMC-CD4+ cells were grown in 35 mm plates treated with polylysine and incubated with a 67 nM concentration of Cy3-labeled G-3 aptamer in complete culture media for real-time live-cell confocal microscopy analysis. The images were collected using 40 × magnification. (c) Localization analysis. (Reprinted from [17], Fig. 2f, g and h)


3.8 Validate the Target Protein as Human CCR5
-
1.
Transfect the CCR5 siRNA and control non-silencing siRNA NC-1 to U373-Magi-CCR5E cells using Lipofectamine 2000 (see Notes 5 and 26 ).
-
2.
After 48 h of transfection, isolate total RNAs with STAT-60, and then treat the total RNAs with DNase I to remove genomic DNA.
Mix the following reagents:
-
(a)
8 μL nuclease-free water.
-
(b)
1.5 μL 10 × DNase Buffer.
-
(c)
4 μL RNA (2 μg).
-
(d)
0.5 μL RNain inhibitor.
-
(e)
1.0 μL RNase-free DNase I.
Incubate at 37 °C for 1 h, heat at 80 °C for 10 min to inactivate DNase I, and immediately chill the reaction on the ice.
-
(a)
-
3.
Reversely transcribe the cDNA. Add 2 μL of 50 ng/μL random primer and 1 μL of 10 mM dNTP into the reaction mixture, and heat at 65 °C for 5 min. Immediately, chill the reaction on the ice. Subsequently, add the following reagents:
-
(a)
5 μL 5 × First strand buffer.
-
(b)
2.5 μL 0.1 M DTT.
-
(c)
0.5 μL RNasin inhibitor.
-
(d)
1.0 μL MMLV-RT.
Incubate the reaction (total volume of 27 μL) at 25 °C for 10 min and at 37 °C for 1 h. Heat the mixture at 70 °C for 15 min to inactivate reverse transcriptase and chill on ice. The cDNA is ready for qRT-PCR analysis.
-
(a)
-
4.
Analyze expression of the target genes by quantitative RT-PCR using 2× iQ SyberGreen Mastermix and specific primer sets at a final concentration of 400 nM (triplex assay) as described in Subheading 3.4 (see Note 19 ). An example result is shown in Fig. 7.
Fig. 7 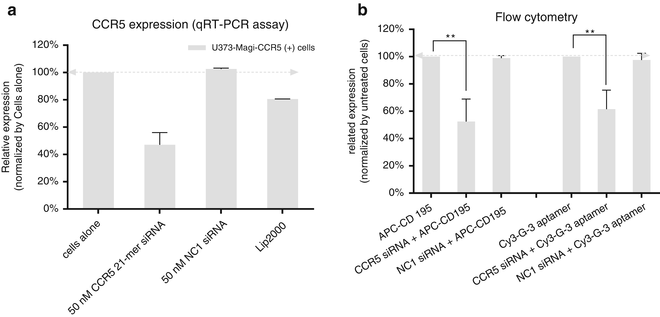
Knockdown of CCR5 reduced binding affinity of aptamers. CCR5 siRNA was transfected into U373-Magi-CCR5 positive cells. After 48 h post-transfection, (a) CCR5 gene expression was detected by qRT-PCR and (b) cell-surface binding of Cy3-labeled G-3 aptamer was assessed by flow cytometry. A scrambled siRNA (NC1) was used as negative control. Data represent the average of three replicates. (Reprinted from [17], Figure S3e and Fig. 2e)
-
5.
Analyze expression of the CCR5 protein by flow cytometry. After 48 h of transfection, wash the cells and detach with Cell stripper as described in Subheading 3.6. An example result is shown in Fig. 7.

4 Notes
-
1.
Common chemicals can be purchased from various reliable sources such as Sigma-Aldrich. Suppliers for some reagents are provided for convenience, and in most cases they can also be purchased from other reputable suppliers. Unless stated otherwise, all solutions should be prepared in autoclaved water that has a resistivity of 18.2 MΩ-cm, which is referred to as “water” in the text.
-
2.
In order to obtain the best performance, avoid repeated freeze–thaw steps and finish the T7 transcription Kit within 6 months which contains 2′-F-dCTP and 2′-F-dUTP. 2′-F-dCTP and 2′-F-dUTP are 2′-fluorine-2′-deoxyribonucleoside-5′-triphosphates.
-
3.
This special reverse transcriptase is good for RNAs with highly secondary structures. The cDNA synthesis was conducted at a higher temperature (55–60 °C).
-
4.
The sample preparation and deep sequencing can be performed by a DNA sequencing core facility. The following is a protocol we often use: 1.0 μg of RNA pool is reverse-transcribed using RT primer (5′-CAG ATT GAT GGT GCC TAC AGT CGG GCG UGT CGT CTG-3′), and then is subjected to PCR amplification for 8 cycles using primers JH5 (5′-AAT GAT ACG GCG ACC ACC GAC AGG TTC AGA GTT CGA TCG GGA GGA CGA TGC GG-3′) and RT/index primer (5′-CAG ATT GAT GGT GCC TAC AGT CGG GCG UGT CGT CTG-3′). The PCR product is subjected to 6 % TBE PAGE gel purification with size selection (for targeted smRNAs of 51 nt). The purified library is followed by the second round of PCR amplification for 4 cycles with primers PE-mi-index primer (5′-CAA GCA GAA GAC GGC ATA CGA GAT NNNNNN CAG ATT GAT GGT GCC TAC AG-3′) and R2 (5′-AAT GAT ACG GCG ACC ACC GA-3′) then followed by 6 % TBE PAGE gel purification with size selection (for targeted smRNAs of 51 nt). The purified library is quantified using qPCR with a forward primer (5′-CAA GCA GAA GAC GGC ATA CG-3′) and a reverse primer (5′-AAT GAT ACG GCG ACC ACC GA-3′). The quantified, denatured PCR product from smRNA library is loaded in 1 mL of hybridization buffer to a final DNA concentration of 10 pM then used for single read flow cell cluster generation and 40 cycle (40 nt) sequencing on an Illumina HiSeq2000.
-
5.
The CCR5 siRNA (sense: 5′ P-CUC UGC UUC GGU GUC GAA A dTdT-3′; Antisense: 5′ P-UUU CGA CAC CGA AGC AGA G dTdT-3′) has been demonstrated previously to knockdown CCR5 expression. Primers are as follows: CCR5 forward primer: 5′-AAC ATG CTG GTC ATC CTC AT-3′; CCR5 reverse primer: 5′-AAT AGA GCC CTG TCA AGA GT-3′. GAPDH expression is used for normalization of the qPCR data.
-
6.
To avoid the damage of the cells, the cells are gently and briefly incubated with a small amount of Cell Stripper solution for detachment.
-
7.
Washing step: spin cells at 1000 rpm in a microcentrifuge for 5 min at 25 °C.
-
8.
1 μL antibody should be enough for 2 × 10⁵ cells in 100 μL reaction system.
-
9.
To preserve the abundance of the original DNA library, PCR was limited to 10 cycles. PCR Forward primer: 5′-TAA TAC GAC TCA CTA TAG GGA GGA CGA TGC GG-3′ (32 mer); PCR Reverse primer: 5′-TCG GGC GAG TCG TCT G-3′ (16 mer). Initial DNA pool template: 5′-GGG AGG ACG ATG CGG - N20- CAG ACG ACT CGC CCG A-3′ (51 nt).
-
10.
Mix all the reagents at room temperature and finally add T7 RNA polymerase. Increase the amount of DNA template (1 μg to 4 μg) and reaction time (overnight incubation) will improve yield of RNA.
-
11.
The work concentration of RNA in the reaction is 50 ng/μL. The template DNA pool should be completely removed to avoid its contamination during SELEX procedure.
-
12.
In principle, live cell-based SELEX methodology relies on the differences between the target cells population (positive cells that express the target of interest) and the control cell population (negative cells that do not express the target protein) [8]. Therefore, the selection procedure generally includes positive selection against the target cells and counter selection against related non-target cells to remove nonspecific binding.
-
13.
Dead cells nonspecifically take up nucleic acids and cause nonspecific binding and/or internalization of nucleic acids during cell-based SELEX, thereby resulting in the delay of target-specific sequence enrichment or even failure of aptamer selection. In this study we therefore carefully controlled the selection procedures, especially those that would probably adversely affect cell health and damage cells, such as cell culture, washing condition, detachment of cells, etc. For example, the cells used for selection are healthy, with >95 % cells alive. A non-enzymatic cell disassociation solution is used here to detach a monolayer of cells. tRNA is used as a competitor to reduce nonspecific binding.
-
14.
This is a counter-selection step. Counter-selection step is performed per cycle to minimize nonspecific binding with the non-targeted cells (negative cells). The supernatants with unbound sequences from negative cells plate are the pre-cleared 0-RNA pool which is transferred to the targeted cells for positive selection.
-
15.
This is a positive selection step. In order to increase the stringency of selection, the density and number of target cells and incubation time were reduced and competitor tRNA and washing times were progressively increased during the selection procedure. The selection conditions for each round are summarized in Table 1. In our study, we totally conducted nine selection rounds.
-
16.
In order to improve recovery yield, 1 μL of glycogen is added into ethanol precipitation step.
-
17.
A no-RT, negative control needs to be set up. The cDNA can be stored at −20 °C or used for PCR immediately.
-
18.
The amount of cDNA for PCR should be optimized to reduce nonspecific PCR product and increase PCR efficiency. Generally, we use 2, 1, 0.5, 0.02, 0.002 μL of original cDNA reaction mixture for a 50-μL PCR reaction. Under our experimental condition, 0.5 μL of original cDNA reaction mixture is optimal.
-
19.
Allow all reagents to reach room temperature before use. Label test tubes to be used for the preparation of standards and specimens. If the entire 96-well plate will not be used, remove surplus strips from the plate frame. Place surplus strips and desiccant into the Re-sealable plastic bag (provided by the manufacturer), seal and store at 4 °C. Primers were as follows: RNA pool Forward primer: 5′-TAA TAC GAC TCA CTA TAG GGA GGA CGA TGC GG-3′ (32 mer); RNA pool Reverse primer: 5′-TCG GGC GAG TCG TCT G-3′ (16 mer). GAPDH expression was used for normalization of the qPCR data. GAPDH forward primer: 5′-CAT TGA CCT CAA CTA CAT G-3′; GAPDH reverse primer: 5′-TCT CCA TGG TGG TGA AGA C-3′. Remember to include a non-template control (NTC), a standard positive control for quantification (a 3–10-fold dilution curve in duplicates) and a “no RT” negative control for each cDNA sample.
-
20.
Reads processing and data analysis were conducted. In brief, the processing principles were as follows. Bases after Ns in each read were considered low quality and were removed. The 3′-fixed oligo and 3′-Solexa adapter were identified and trimmed from each reads. The reads with 20-base after processing were considered as usable reads and retained for further analysis. Unique reads in each sample were counted. The most frequent 1000 unique sequences were identified in each sample. The most frequent 1000 unique sequence in round 9 were obtained and matched to the other four samples (top 1000 unique reads) and their frequencies were recorded. The consensus sequence of round 9 was used to compare to the reads in each round. For alignment and grouping analysis, the top 40 sequences were divided into 6 groups according to their predicted secondary structures by MFold RNA and QuickFold RNA.
-
21.
The RNA aptamers sequences are listed in Table 2b.
-
22.
Fluorescent dye reagent and Cy3-labeled RNA are sensitive to light and should limit the exposure to light for the entire procedure.
-
23.
Detected by spectrophotometry, the base:dye ratio can be calculated, which should be lower than 200. The lower the base:dye ratio, the more dye molecules are present on the RNA, indicating an effective labeling. Dye molecules (Cy3, Cy5, or fluorescein) covalently attach to the guanine base of the RNA. The dye molecule can also attach to the adenosine base of RNA, however, this reaction is very rare.
-
24.
The different work concentrations (0–1600 nM) of Cy3-labeled experimental RNA aptamers are used for cell-surface binding experiment by flow cytometry. The dissociation constants were calculated using nonlinear curve regression with a Graph Pad Prism 6.0.
-
25.
The surface of the plate for confocal microscopy is very smooth and is treated with poly-lysine to increase the attachment of the cells on the dish.
-
26.
The siRNA transfection is performed in a 6-well plate according to the manufacturer’s instruction. The CCR5 knockdown is confirmed by flow cytometry (APC-CD195 antibody staining) and qRT-PCR assay. In parallel, the cells are stained with the Cy3-labeled G-3 aptamer .
References
Mayer G (2009) The chemical biology of aptamers. Angew Chem Int Ed Engl 48:2672–2689
Ozer A, Pagano JM, Lis JT (2014) New technologies provide quantum changes in the scale, speed, and success of SELEX methods and aptamer characterization. Mol Ther Nucleic Acids 3:e183
Sundaram P, Kurniawan H, Byrne ME et al (2013) Therapeutic RNA aptamers in clinical trials. Eur J Pharm Sci 48:259–271
Ni X, Castanares M, Mukherjee A et al (2011) Nucleic acid aptamers: clinical applications and promising new horizons. Curr Med Chem 18:4206–4214
Zhou J, Rossi JJ (2014) Cell-type-specific, aptamer-functionalized agents for targeted disease therapy. Mol Ther Nucleic Acids 3:e169
Fang X, Tan W (2010) Aptamers generated from cell-SELEX for molecular medicine: a chemical biology approach. Acc Chem Res 43:48–57
Guo KT, Paul A, Schichor C et al (2008) CELL-SELEX: novel perspectives of aptamer-based therapeutics. Int J Mol Sci 9:668–678
Cerchia L, Giangrande PH, McNamara JO et al (2009) Cell-specific aptamers for targeted therapies. Methods Mol Biol 535:59–78
Thiel KW, Hernandez LI, Dassie JP et al (2012) Delivery of chemo-sensitizing siRNAs to HER2 + −breast cancer cells using RNA aptamers. Nucleic Acids Res 40:6319–6337
Tuerk C, Gold L (1990) Systematic evolution of ligands by exponential enrichment: RNA ligands to bacteriophage T4 DNA polymerase. Science 249:505–510
Cerchia L, Duconge F, Pestourie C et al (2005) Neutralizing aptamers from whole-cell SELEX inhibit the RET receptor tyrosine kinase. PLoS Biol 3:e123
Cerchia L, Esposito CL, Jacobs AH et al (2009) Differential SELEX in human glioma cell lines. PLoS One 4:e7971
Thiel WH, Bair T, Peek AS et al (2012) Rapid identification of cell-specific, internalizing RNA aptamers with bioinformatics analyses of a cell-based aptamer selection. PLoS One 7:e43836
Vodicka MA, Goh WC, Wu LI et al (1997) Indicator cell lines for detection of primary strains of human and simian immunodeficiency viruses. Virology 233:193–198
Howell DN, Andreotti PE, Dawson JR et al (1985) Natural killing target antigens as inducers of interferon: studies with an immunoselected, natural killing-resistant human T lymphoblastoid cell line. J Immunol 134:971–976
Lyerly HK, Reed DL, Matthews TJ et al (1987) Anti-GP 120 antibodies from HIV seropositive individuals mediate broadly reactive anti-HIV ADCC. AIDS Res Hum Retroviruses 3:409–422
Zhou J, Satheesan S, Li H et al (2015) Cell-specific RNA aptamer against human CCR5 specifically targets HIV-1 susceptible cells and inhibits HIV-1 infectivity. Chem Biol 22:379–390
Acknowledgments
We thank James O. McNamara II and Paloma H. Giangrande for helpful discussions. We thank Mayumi Takahashi for providing primary PBMCs. The authors would like to thank City of Hope DNA sequencing core and Bioinformatics Core facility (Harry Gao, Xiwei Wu and Jinhui Wang) for Solexa Deep sequencing and data processing. The following reagents were obtained through the NIH AIDS Research and Reference Reagent Program, Division of AIDS, NIAID, NIH: the U373-Magi and U373-Magi-CCR5E cell lines were obtained from Dr. Michael Emerman [14]; CEM-NKr and CEM-NKr-CCR5 cell lines were obtained from Dr. Peter Cresswell [15, 16].
This work was supported by National Institutes of Health grants (grant numbers R01AI29329, R01AI42552, and R01HL07470) to J.J.R. Funding for open access charge: National Institutes of Health.
Conflict of Interest declaration: J.J.R. and J.Z. have an issued patent entitled “Cell-type-specific aptamer-siRNA delivery system for HIV-1 therapy”. USPTO, No. US 8, 222, 226 B2, issued date: July 17, 2012. J. J. R. and J. Z. have a patent pending on “Cell-specific internalizing RNA aptamers against human CCR5 and used therefore”, The United States Patent, and application number: 62/025,368, filed on July 16, 2014.
Author information
Authors and Affiliations
Corresponding author
Editor information
Editors and Affiliations
Rights and permissions
Copyright information
© 2016 Springer Science+Business Media New York
About this protocol
Cite this protocol
Zhou, J., Rossi, J.J. (2016). Evolution of Cell-Type-Specific RNA Aptamers Via Live Cell-Based SELEX. In: Lin, RJ. (eds) RNA-Protein Complexes and Interactions. Methods in Molecular Biology, vol 1421. Humana Press, New York, NY. https://doi.org/10.1007/978-1-4939-3591-8_16
Download citation
DOI: https://doi.org/10.1007/978-1-4939-3591-8_16
Published:
Publisher Name: Humana Press, New York, NY
Print ISBN: 978-1-4939-3589-5
Online ISBN: 978-1-4939-3591-8
eBook Packages: Springer Protocols