
Abstract
The advancement of a kinase inhibitor throughout drug discovery and development is predicated upon its selectivity towards the target of interest. Thus, profiling the compound against a broad panel of kinases is important for providing a better understanding of its activity and for obviating any off-target activities that can result in undesirable consequences. To assess the selectivity and potency of an inhibitor against multiple kinases, it is desirable to use a universal assay that can monitor the activity of all classes of kinases regardless of the nature of their substrates. The luminescent ADP-Glo kinase assay is a universal platform that measures kinase activity by quantifying the amount of the common kinase reaction product ADP. Here we present a method using standardized kinase profiling systems for inhibitor profiling studies based on ADP detection by luminescence. The kinase profiling systems are sets of kinases organized by family, presented in multi-tube strips containing eight enzymes, each with corresponding substrate strips, and standardized for optimal kinase activity. We show that using the kinase profiling strips we could quickly and easily generate multiple selectivity profiles using small or large kinase panels, and identify compound promiscuity within the kinome.
Access provided by CONRICYT – Journals CONACYT. Download protocol PDF
Key words
1 Introduction
Kinases are phosphotransferases that account for one of the largest enzyme families in the cell. By phosphorylating a multitude of substrates, kinases transduce cellular signals altering diverse biological networks [1, 2]. Because of their importance, alterations in normal kinase activity (e.g., overexpression, hyper-activation, or inhibition) can disrupt several of these networks causing diseases such as cancer, inflammation, and diabetes. Thus, kinases became one of the largest drug target enzyme groups in the drug discovery research [3].
Many drug discovery programs are devoted to the identification of kinase inhibitors. Typically, these programs consist of screening small molecule libraries of different sizes and chemical structures, to identify compounds that inhibit the target kinase . After screening and hit identification, selected compounds are moved forward for lead optimization. During this phase, compounds are optimized for potency and selectivity to improve efficacy and prevent off-target effects once the compounds become a drug. Drug safety is of paramount importance, indicating that minimal side effects are a major requirement in drug development. Because of the large number of kinases with sequence similarity in their catalytic domain , dialing in selectivity is challenging, and off-target kinase inhibition can be a significant source of side effects including undesirable toxicities [4, 5]. Therefore, to find a balance between potency and selectivity, lead compounds need to be profiled against various liability panels, which include a protein kinase panel. Profiling a compound against a broad panel of kinases reveals its activity against off-target kinases, and this may provide insights about potential toxicities as well as mode of action [6]. Moreover, defining specificity of inhibitors towards a specific kinase or group of kinases provides useful tools to the research community in general and to the cell-signaling community in particular [7].
Several detection technologies were developed for assessing kinase activity [8–10]. These can generate kinome selectivity data and in a profiling mode they have mostly been deployed in a fee-for-service model by service providers [11–14]. This is an attractive model given the cost and complexity of setting up profiling panels, which involves rigorous optimization of each enzyme across the panel [15–17]. On the other hand, a profiling system that can be simply and rapidly implemented in-house would obviate logistical inconveniences, delays, and confidentiality concerns associated with outsourcing. To this end, a pre-configured kinase profiling system was developed based on the luminescent ADP-Glo kinase assay platform [9]. This universal kinase platform has been validated with hundreds of kinases and it has been shown to be robust and suitable for kinase drug discovery [18–20]. The kinase profiling systems are a set of kinases presented in multi-tube strips containing eight enzymes per strip with their corresponding substrate strips , and standardized for optimal kinase activity (Fig. 1). The strip system provides flexible kinase inhibitor profiling , as each strip can be used to profile compounds at a single dose or create a dose–response against eight kinases at once. We showed that using this system we could generate selectivity profiles using small or large kinase panels, and identify compound promiscuity towards members of a single kinase subfamily or different subfamilies of the kinome [21]. As an example here, we used a strip containing eight different recombinant receptor tyrosine kinases to profile eight known kinase inhibitors. We generated single-dose and dose–response inhibition data, and confirmed that the inhibition potencies observed with this approach are consistent with published values produced by other technologies [12].

Kinase selectivity profiling system overview: Two dilutions are used to create kinase working stocks and ATP/substrate working stocks. 2 μL of these stocks are added to a 384-well plate containing 1 μL of test compounds/vehicle to start kinase profiling experiments. Kinase activity in each well is quantified using ADP-Glo™ Kinase Assay. The luminescent signal generated by the ADP-Glo™ Kinase Assay is proportional to ADP concentration and is correlated with kinase activity
2 Materials
Prepare all solutions using Nanopure water, or equivalent water free of ATP. Follow all temperature-controlled steps as noted.
2.1 Single-Dose and Dose–Response Profiling
For one pair of kinase/substrate strips in the kit, up to ten compounds can be tested in a single-dose format or one compound in a dose–response format. This includes duplicate measurements per compound, no-compound vehicle controls, and no-kinase controls for each kinase in the strip. We tested one strip of eight kinases with eight compounds at 1 μM final concentration. Additionally, we used two strips to profile two compounds in dose–response mode.
-
1.
Two kinase selectivity profiling systems (KSPS) : TK-1 kits (Promega). One Kit includes:
-
(a)
5× Reaction buffer A: 200 mM Tris–HCl, pH 7.5; 100 mM MgCl2; 0.5 mg/mL BSA .
-
(b)
0.1 M dithiothreitol (DTT) in water.
-
(c)
Two 8-tube strips containing stock substrate/cofactor solutions.
-
(d)
Two 8-tube strips containing stock kinase solutions.
See Table 1 for KSPS: TK-1 kinase and substrate components.
Table 1 Kinase and substrate strip compositions of the kinase selectivity profiling system TK-1
-
(a)
-
2.
Dimethyl sulfoxide (DMSO) (Sigma).
-
3.
Reaction buffer (2.5×) for single-dose profiling : 1.4 mL of 2.5× reaction buffer made with 125 μM DTT just prior to use. Mix 700 μL 5× reaction buffer A, 1.75 μL 0.1 M DTT, and 698.25 μL Nanopure water.
-
4.
Reaction buffer (1×) with 5 % DMSO for single-dose profiling: 100 μL was made by mixing 40 μL reaction buffer (2.5×), 5 μL DMSO, and 55 μL Nanopure water (see Note 1 ).
-
5.
Reaction buffer (2.5×) for dose–response profiling: 3 mL of 2.5× reaction buffer made with 125 μM DTT just prior to use. Mix 1.5 mL 5× reaction buffer A, 3.75 μL 0.1 M DTT, and 1496.25 μL Nanopure water.
-
6.
Reaction buffer (1×) with 5 % DMSO for dose–response profiling: 2 mL was made by mixing 800 μL reaction buffer (2.5×), 100 μL DMSO, and 1.1 mL Nanopure water (see Note 1 ).
-
7.
SB 203580 compound: 100 μM SB 203580 stock (Promega) in DMSO .
-
8.
Enzastaurin compound: 100 μM Enzastaurin stock (LC Laboratories) in DMSO .
-
9.
PF-477736 compound: 1 mM and 100 μM PF-477736 stocks (Sigma) in DMSO .
-
10.
Gefitinib compound: 1 mM and 100 μM Gefitinib stock (LC Laboratories) in DMSO .
-
11.
Roscovitine compound: 100 μM Roscovitine stock (LC Laboratories) in DMSO .
-
12.
Dasatinib compound: 100 μM Dasatinib stock (LC Laboratories) in DMSO .
-
13.
Tofacitinib compound: 100 μM Tofacitinib stock (LC Laboratories) in DMSO .
-
14.
Tozasertib compound: 100 μM Tozasertib stock (LC Laboratories) in DMSO .
-
15.
ADP-Glo™ Kinase Assay (Promega). Kit includes:
-
(a)
ADP-Glo™ Reagent.
-
(b)
Kinase detection reagent.
-
(c)
10 mM UltraPure ATP (see Note 2 ).
-
(a)
2.2 Equipment
-
1.
Low-volume 384-well white round-bottom untreated polystyrene microplate (Corning).
-
2.
Half area 96-well white untreated microplate (Corning).
-
3.
Multichannel pipette capable of dispensing 1 and 2 μL volumes.
-
4.
Luminometer capable of reading multi-well plates (GloMax Discover, Promega).
-
5.
Plate shaker.
-
6.
Centrifuge compatible with a 384-well plate.
-
7.
Incubator or plate warmer at 22–25 °C.
2.3 Data Processing
Data processed using Kinase Selectivity Profiling System Data Analysis Worksheets on Promega Tools webpage (http://www.promega.com/resources/tools/kinase-selectivity-profiling-systems-data-analysis-worksheets/).
3 Methods
3.1 Kinase Reaction Setups
3.1.1 Single-Dose Profiling
The dispensing steps described in this section are shown in Fig. 2.

Schematic representation of compound single-dose profiling setup
-
1.
Prepare compound solutions for single-dose profiling using 100 μM compound stocks in DMSO for the following compounds: gefitinib, dasatinib, SB 203580, tozasertib, tofacitinib, roscovitine, PF-477736, and enzastaurin. Mix 40 μL reaction buffer (2.5×), 5 μL 100 μM compound stock in DMSO, and 55 μL Nanopure water (see Note 3 ).
-
2.
Dilute 5 μL 10 mM UltraPure ATP with 495 μL of Nanopure water to make 100 μM ATP solution.
-
3.
Thaw one substrate/cofactor strip (TK-S1) from the kit on ice.
-
4.
Dilute the TK-S1 strip to make 2.5× ATP/substrate working stocks. Add 15 μL 100 μM ATP solution to each of the tubes in the substrate/cofactor strip. Mix by pipetting up and down several times. Keep the strip on ice until use.
-
5.
Dispense 1 μL reaction buffer (1×) with 5 % DMSO into columns 1 and 2 of the 384-well assay plate (see Note 4 ).
-
6.
Add test compounds to 384-well assay plate. Dispense 1 μL of gefitinib solution into each well of column 3. Dispense 1 μL of dasatinib solution into each well of column 4. Dispense 1 μL of SB 203580 solution into each well of column 5. Dispense 1 μL of tozasertib solution into each well of column 6. Dispense 1 μL of tofacitinib solution into each well of column 7. Dispense 1 μL of roscovitine solution into each well of column 8. Dispense 1 μL of PF-477736 solution into each well of column 9. Dispense 1 μL of enzastaurin solution into each well of column 10.
-
7.
Thaw the eight-tube strip containing kinase stocks (TK-1) on ice (see Note 5 ).
-
8.
Make 2.5× kinase working stocks by diluting the TK-1 strip. Add 95 μL 2.5× reaction buffer to each tube of the strip and mix by gently pipetting up and down several times. Perform this step immediately prior to use.
-
9.
Add 2 μL 2.5× reaction buffer into column 1 of the 384-well assay plate for no-kinase controls.
-
10.
Align the strip with kinase working stocks, so the blue dye is at the top relative to the 384-well plate (see Note 6 ).
-
11.
Using a multichannel pipette (eight channels at once), dispense 2 μL of the kinase working stocks into columns 2 through 10 of the 384-well assay plate (Fig. 2). When dispensing the kinase working stocks from the strip tubes to 384-well plate, all eight kinases are dispensed at once. The solution of the first strip tube is added to row A, the solution of the second tube is added to row C, the solution of the third tube is added to row E, ending with the solution in the eighth tube added to row O (A, C, E, G, I, K, M, O).
-
12.
Discard the tips and repeat step 11 to dispense the kinases for the duplicate measurements by using the other wells in columns 2–10 (Fig. 2). All eight kinases are again dispensed at once to every other row starting with row B and ending with row P (B, D, F, H, J, L, N, P).
-
13.
Cover and centrifuge the assay plate at a low setting for 15–30 s to ensure that solutions are at the bottom of the wells.
-
14.
Place the assay plate in an incubator set at 23 °C for 10 min to allow binding of the compounds to the kinases.
-
15.
Align the ATP/substrate working stocks in the strip, so the yellow dye is at the top relative to the 384-well plate (see Note 6 and Fig. 2).
-
16.
Dispense ATP/substrate working stocks into columns 1 through 10 of the assay plate following the same duplicate dispensing pattern setup with the kinase strip (steps 11 and 12).
-
17.
Cover and centrifuge the assay plate at a low setting for 15–30 s to ensure that solutions are at the bottom of the wells.
-
18.
Mix reaction components for 2 min on a plate shaker.
-
19.
Place plate in incubator set at 23 °C for 60 min.
-
20.
Detect the activity of the kinases using the ADP-Glo kinase assay as described in Subheading 3.2.
3.1.2 Inhibitor Dose–Response Profiling
The dispensing steps described in this section are shown in Fig. 3.

Schematic representation of compound dose–response profiling setup
-
1.
Prepare 50 μM compound solutions for both gefitinib and PF-477736 compounds. Mix 40 μL reaction buffer (2.5×), 5 μL 1 mM compound stock in DMSO , and 55 μL Nanopure water (see Note 7 ).
-
2.
Use a 96-well preparative plate to prepare compound serial dilutions. Dispense 75 μL of 1× reaction buffer with 5 % DMSO into wells A2 through A12 and B2 through B12 in 96-well preparative plate (see Note 8 ).
-
3.
Add 100 μL of the 50 μM gefitinib solution to well A1 of the 96-well preparative plate. Perform a 10-point 1:4 serial dilution of gefitinib across row A using 25 μL solution transfers. Mix well between transfers by pipetting up and down. Do not transfer compound into wells A11 and A12 (see Note 9 ).
-
4.
Add 100 μL of the 50 μM PF-477736 solution to well B1 of the 96-well preparative plate. Perform a 10-point 1:4 serial dilution of PF-477736 across row B using 25 μL solution transfers. Mix well between transfers by pipetting up and down. Do not transfer compound solution into wells B11 and B12 (see Note 9 ).
-
5.
Mix 5 μL 10 mM UltraPure ATP with 495 μL Nanopure water to make 100 μM ATP solution.
-
6.
Thaw two substrate/cofactor strips (TK-S1) from the kit on ice.
-
7.
Add 15 μL 100 μM ATP solution to each tube of both strips to make 2.5× ATP/substrate working stocks. Mix by pipetting up and down several times. Keep solutions on ice until use.
-
8.
Align the 96-well preparative plate containing the serial dilutions of the compounds with the 384-well assay plate, so column 1 of the 96-well plate corresponds to columns 1 and 2 of the 384-well plate (see Note 10 ).
-
9.
Use a multichannel pipette (12 channels at once) to add 1 μL of the gefitinib serial dilution from row A of the 96-well preparative plate to row A, and then to every other row of a 384-well assay plate (rows A, C, E, G, I, K, M, and O); see Fig. 3.
-
10.
Use a multichannel pipette (12 channels at once) to add 1 μL of the PF-477736 serial dilution from row B of the 96-well preparative plate to the alternate rows of the 384-well assay plate (rows B, D, F, H, J, L, N, and P). Keep the plate alignment the same as outlined in step 9.
-
11.
Add 2 μL of reaction buffer (2.5×) to all wells of columns 23 and 24 of the 384-well assay plate for no-enzyme control measurements.
-
12.
Thaw both kinase strips (TK-1) from the kit on ice (see Note 5 ).
-
13.
Make 2.5× kinase working stocks by adding 95 μL reaction buffer (2.5×) to each tube of both strips. Mix well by gently pipetting up and down several times. Make solutions immediately prior to use.
-
14.
Align one of the kinase strips, so the first tube containing the blue dye lines up with row A of the 384-well assay plate (see Note 6 ).
-
15.
Using a multichannel pipette (eight channels at once), add 2 μL of 2.5× kinase working stocks to wells 1 through 22 of every other row of the assay plate (row A, C, E, G, I, K, M, and O) containing the gefitinib serial dilution.
-
16.
Align the second kinase strip , so the first tube containing the blue dye lines up with row B of the 384-well assay plate.
-
17.
Using a multichannel pipette (eight channels at once), add 2 μL of 2.5× kinase working stocks to wells 1 through 22 of the alternate rows of the assay plate (rows B, D, F, H, J, L, N, and P) containing the PF-477736 serial dilution.
-
18.
Cover and centrifuge the assay plate at a low setting for 15–30 s to ensure that solutions are at the bottom of the wells.
-
19.
Place the assay plate in an incubator set at 23 °C for 10 min.
-
20.
Align one of the substrate/cofactor strips, so the first tube containing the yellow dye lines up with row A of the 384-well assay plate.
-
21.
Using a multichannel pipette (eight channels at once), add 2 μL of the 2.5× ATP/substrate working stocks to every other row of the assay plate (rows A, C, E, G, I, K, M, and O) (see Note 11 ).
-
22.
Align the second substrate/cofactor strip, so the first tube containing the yellow dye lines up with row B of the 384-well assay plate.
-
23.
Using a multichannel pipette (eight channels at once), add 2 μL of the 2.5× ATP/substrate working stocks to the alternate rows of the assay plate (rows B, D, F, H, J, L, N, and P).
-
24.
Cover and centrifuge the assay plate at a low setting for 15–30 s to ensure that solutions are at the bottom of the wells.
-
25.
Mix reaction components for 2 min on a plate shaker.
-
26.
Place plate in incubator set at 23 °C for 60 min.
-
27.
Detect the activity of the kinases using the ADP-Glo kinase assay as described in Subheading 3.2.
3.2 Bioluminescent Signal Detection
To detect the activity of all the kinases in the plate at once, the universal luminescence-based assay ADP-Glo is used [9]. The assay is performed in two steps; after the kinase reaction, equal volume of ADP-Glo Reagent is added to terminate the kinase reaction and to deplete the remaining ATP. After an incubation time, the kinase detection reagent is added to convert ADP to ATP and to measure the newly synthesized ATP using luciferase/luciferin reaction. The light generated is determined using a luminometer. The luminescent signal generated is proportional to the ADP concentration present and it is correlated with the amount of kinase activity.
-
1.
Add 5 μL of ADP-Glo™ Reagent to all the wells of assay plate that have a solution.
-
2.
Cover and centrifuge the assay plate at a low setting for 15–30 s to ensure that solutions are at the bottom of the wells.
-
3.
Mix reaction components for 2 min on a plate shaker.
-
4.
Place plate in incubator set at 23 °C for 40 min.
-
5.
Add 10 μL of kinase detection Reagent to all the wells of assay plate that have a solution.
-
6.
Cover and centrifuge the assay plate at a low setting for 15–30 s to ensure that solutions are at the bottom of the wells.
-
7.
Mix reaction components for 2 min on a plate shaker.
-
8.
Place plate in incubator set at 23 °C for 40 min.
-
9.
Measure luminescence in a luminometer using an integration time of 0.5 s per well.
3.3 Profiling Data Processing
3.3.1 Single-Dose Profiling Data Processing
-
1.
Navigate to the Kinase Selectivity Profiling System Data Analysis Worksheets on Promega Tools webpage (http://www.promega.com/resources/tools/kinase-selectivity-profiling-systems-data-analysis-worksheets/) (see Note 12 ).
-
2.
Open the Single Dose Inhibition Worksheet.
-
3.
Copy raw luminescence data into the plate data area of the worksheet.
-
4.
Click on the “Click to Analyze” button.
-
5.
Choose “Columns 1–12 only (1 Strip)” option from the plate format pop-up window.
-
6.
From the first dropdown menu select the value “8” as the “# of inhibitors tested.” From the second drop-down menu select “TK-1” as the “Kinase Profiling Strip used for the assay.” Click “OK.”
-
7.
In the next pop-up window, list the compounds in the order tested in the assay plate and click “OK.”
-
8.
Data is automatically processed and displayed in a color-coded table as values of the % kinase activity remaining after treatment with the individual compounds (Fig. 4a).
Fig. 4 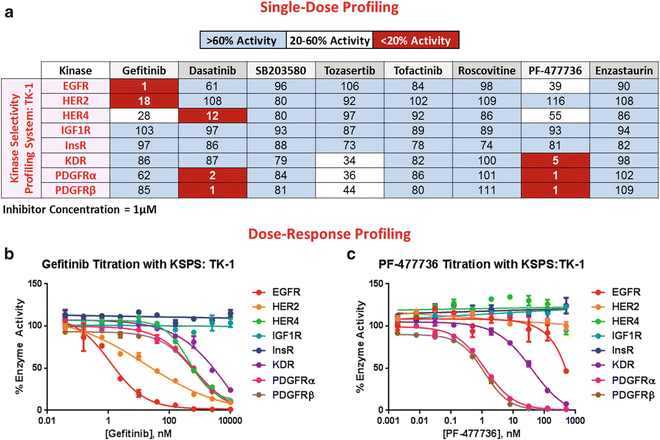
(a) Single-dose profiling results: Percent remaining kinase activity for each kinase/compound measurement is indicated. (b) Gefitinib serial dilution shows selective inhibition of EGFR and HER2 . (c) PF-477736 serial dilution shows promiscuous inhibition of kinases in the KSPS: TK-1 kit. The PF-477736 compound was identified as a CHK1 kinase inhibitor [22]

3.3.2 Dose–Response Profiling Data Processing
-
1.
Navigate to the Kinase Selectivity Profiling System Data Analysis Worksheets on Promega Tools webpage (http://www.promega.com/resources/tools/kinase-selectivity-profiling-systems-data-analysis-worksheets/) (see Note 12 ).
-
2.
Open the Inhibitor Dose Response Worksheet.
-
3.
Copy raw luminescence data into the plate data area of the worksheet.
-
4.
Click the “Click to Analyze” button.
-
5.
Choose “Full Plate (2 Strip)” option on the Plate Format pop-up window.
-
6.
Fill in the experimental information in the next pop-up window for strip 1 and strip 2.
-
(a)
Type the name of the compound tested (gefitinib for strip 1 and PF-477736 for strip 2) in the first empty field for each column under “what compound was used in the serial dilution.”
-
(b)
Fill in the highest compound concentration (10,000 nM for both strip 1 and strip 2) in the next empty field for each column.
-
(c)
Fill in dilution factor (4 for both strip 1 and strip 2) in the next empty field for each column.
-
(d)
Select the Kinase Selectivity Profiling System used for the experiment (TK-1 for both strip 1 and strip 2) in the final drop-down menus for each column.
Click “OK” at the bottom of the pop-up window.
-
(a)
-
7.
Data is automatically processed and presented as graphs of dose–response curves for each compound tested with tables indicating calculated IC50 values (Fig. 4b, c) (see Note 13 ).
4 Notes
-
1.
Other compound vehicles other than DMSO may be used. Ensure that 1× buffer contains same vehicle as compounds being tested.
-
2.
Avoid multiple freeze/thaw cycles for 10 mM UltraPure ATP stock by dispensing into smaller volumes for storage.
-
3.
Compound solutions will contain 5 % DMSO . Make 1× buffer for controls with 5 % DMSO to match reaction conditions.
-
4.
Single-dose plate format: Column 1 contains no-kinase controls, column 2 contains no-compound controls, and columns 3–10 contain compound measurements (see Fig. 2). No-kinase controls contain substrate, cofactor, and ATP in reaction buffer with 1 % DMSO . No-compound controls contain substrate, cofactor, ATP, and kinase in reaction buffer containing 1 % DMSO. Compound measurements contain substrate, cofactor, ATP, kinase, and test compound in reaction buffer with 1 % DMSO. Duplicate measurements for each kinase are in consecutive rows (Kinase 1 duplicate measurements in rows A and B, Kinase 2 duplicate measurements in rows C and D, Kinase 3 duplicate measurements in rows E and F, Kinase 4 duplicate measurements in rows G and H, Kinase 5 duplicate measurements in rows I and J, Kinase 6 duplicate measurements in rows K and L, Kinase 7 duplicate measurements in rows M and N, and Kinase 8 duplicate measurements in rows O and P).
-
5.
For optimal kinase activity, keep kinase strips in −80 °C freezer or on dry ice until immediately before use. Thaw kinase strips on ice when ready to dilute and use immediately. Do not reuse any remaining kinase solutions.
-
6.
Kinase strips contain a blue dye in one tube of the eight-tube strip. Substrate/cofactor strips contain a yellow dye in one tube of the eight-tube strip. The position of the dye indicates the identity of the kit and helps with the strip orientation when setting up profiling experiments. For KSPS: TK-1 dyes are located in the first tube on the top to indicate that these strips are the first in the tyrosine kinase family kits and the kinase/substrate pair containing the dyes is EGFR/Poly(Glu4, Tyr1) + MnCl2.
-
7.
Make compound solutions at five times the concentration required as the highest concentration in the reactions containing the serial dilution series. Since our desired concentration range in the reaction starts at 10 μM compound, a 50 μM compound stock is used to start the serial dilution series.
-
8.
To ensure complete dose–response curves, use a higher dilution factor in serial dilution series. We use a 1:4 dilution with the highest concentration of the compound in the reaction of 10 μM. Other values can be used to reach the desired concentration ranges.
-
9.
We used a ten-point compound serial dilution for each compound. Column 11 contains no compound and will represent the no-compound controls. Column 12 contains no kinase and will represent the no-kinase controls.
-
10.
Dose–response plate format: Columns 1 through 20 contain compound serial dilutions, columns 21 and 22 contain no-compound controls, and columns 23 and 24 contain no-kinase controls. Duplicate measurements are made in adjacent columns within the row of the 384-well plate. No-kinase controls contain substrate, cofactor, and ATP in reaction buffer containing 1 % DMSO . No-compound controls contain substrate, cofactor, ATP, and kinase in reaction buffer containing 1 % DMSO. Compound serial dilutions contain substrate, cofactor, ATP, kinase, and test compound in reaction buffer containing 1 % DMSO. Serial dilutions are dispensed in every other rows (rows A, C, E, G, I, K, M, and O or rows B, D, F, H, J, L, N, and P). Kinase measurements will then be located on individual rows (Kinase 1 in rows A and B, Kinase 2 in row C and D, and so on until Kinase 8 in row O and P); see Fig. 3.
-
11.
When adding 2.5× ATP/substrate working stocks, start from the right side of the plate (column 24) and move towards the left. This will eliminate detectable contamination in data measurements while allowing the user fewer tip changes.
-
12.
If plate setup matches that described in the KSPS technical manual, the KSPS Data Processing Worksheets can be used to process the generated data. The raw data output is copied into the corresponding space on the worksheet. After a few prompts to enter experimental variables, the data is processed and displayed as either a table (for single-dose profiling) or a graph (dose–response profiling). No-kinase controls are subtracted from both the no-compound controls and compound measurement values. The corrected no-compound controls are used to calculate the percentage of remaining kinase activity of the compound measurements.
-
13.
IC50 values will not be calculated if the dose–response curve is not complete.
References
Hunter T (2000) Signaling-2000 and beyond. Cell 100:113–127
Manning G, Whyte DB, Martinez R et al (2002) The protein kinase complement of the human genome. Science 298:1912–1934
Cohen P (2002) Protein kinases—the major drug targets of the twenty-first century? Nat Rev Drug Discov 1:309–315
Widakowich C, de Castro G Jr, de Azambuja E et al (2007) Review: side effects of approved molecular targeted therapies in solid cancers. Oncologist 12:1443–1455
Castoldi RE, Pennella G, Saturno GS et al (2007) Assessing and managing toxicities induced by kinase inhibitors. Curr Opin Drug Discov Devel 10:53–57
Olaharski AJ, Gonzaludo N, Bitter H et al (2009) Identification of a Kinase Profile that Predicts Chromosome Damage Induced by Small Molecule Kinase Inhibitors. PLoS Comput Biol 5, e1000446. doi:10.1371/journal.pcbi.1000446
Bain J, Plater L, Elliott M et al (2007) The selectivity of protein kinase inhibitors: a further update. Biochem J 408:297–315
Jia Y, Quinn CM, Kwak S, Talanian RV (2008) Current in vitro kinase assay technologies: The quest for a universal format. Curr Drug Discov Technol 5:59–69
Zegzouti H, Zdanovskaia M, Hsiao K, Goueli SA (2009) ADP-Glo: A Bioluminescent and homogeneous ADP monitoring assay for kinases. Assay Drug Dev Technol 7:560–572
Krishnamurty R, Maly DJ (2007) Chemical genomic and proteomic methods for determining kinase inhibitor selectivity. Comb Chem High Throughput Screen 10:652–666
Miduturu CV, Deng X, Kwiatkowski N et al (2011) High-throughput kinase profiling: a more efficient approach toward the discovery of new kinase inhibitors. Chem Biol 18:868–879
Anastassiadis T, Deacon SW, Devarajan K et al (2011) Comprehensive assay of kinase catalytic activity reveals features of kinase inhibitor selectivity. Nat Biotechnol 29:1039–1045
Fabian MA, Biggs WH 3rd, Treiber DK et al (2005) A small molecule-kinase interaction map for clinical kinase inhibitors. Nat Biotechnol 23:329–336
Karaman MW, Herrgard S, Treiber DK et al (2008) A quantitative analysis of kinase inhibitor selectivity. Nat Biotechnol 26:127–132
Card M, Caldwell C, Min H et al (2009) High-Throughput Biochemical Kinase Selectivity Assays: Panel Development and Screening Applications. J Biomol Screen 14:31–42
Larson B, Banks P, Zegzouti H, Goueli SA (2009) A simple and robust automated kinase profiling platform using luminescent ADP accumulation technology. Assay Drug Dev Technol 7:573–584
Zegzouti H, Alves J, Worzella T et al (2011) Screening and profiling kinase inhibitors with a luminescent ADP detection platform. Promega Corporation Web site. http://www.promega.com/resources/pubhub/screening-and-profiling-kinase-inhibitors-with-a-luminescent-adp-detection-platform. Accessed 21 April 2015
Tanega C, Shen M, Mott BT et al (2009) Comparison of bioluminescent kinase assays using substrate depletion and product formation. Assay Drug Dev Technol 7:606–614
Davis MI, Sasaki AT, Shen M et al (2013) A Homogeneous, High-Throughput Assay for Phosphatidylinositol 5-Phosphate 4-Kinase with a Novel, Rapid Substrate Preparation. PLoS One 8, e54127. doi:10.1371/journal.pone.0054127
Li H, Totoritis RD, Lor LA et al (2009) Evaluation of an antibody-free ADP detection assay: ADP-Glo. Assay Drug Dev Technol 7:598–605
Zegzouti H, Hennek J, Alves J, Goueli S (2015) Kinase strips for routine creation of inhibitor selectivity profiles: a novel approach to targeted profiling. SLAS Conference 2015. http://www.promega.com/resources/scientific_posters/posters/kinase-strips-forcreationinhibitorselectivityprofilesnovel-approachtargetedprofilingposter/. Accessed 30 April 2015.
Blasina A, Hallin J, Chen E et al (2008) Breaching the DNA damage checkpoint via PF-00477736, a novel small-molecule inhibitor of checkpoint kinase 1. Mol Cancer Ther 7:2394–2404
Author information
Authors and Affiliations
Corresponding authors
Editor information
Editors and Affiliations
Rights and permissions
Copyright information
© 2016 Springer Science+Business Media New York
About this protocol
Cite this protocol
Zegzouti, H., Hennek, J., Goueli, S.A. (2016). Using Bioluminescent Kinase Profiling Strips to Identify Kinase Inhibitor Selectivity and Promiscuity. In: Zegzouti, H., Goueli, S. (eds) Kinase Screening and Profiling. Methods in Molecular Biology, vol 1360. Humana Press, New York, NY. https://doi.org/10.1007/978-1-4939-3073-9_5
Download citation
DOI: https://doi.org/10.1007/978-1-4939-3073-9_5
Publisher Name: Humana Press, New York, NY
Print ISBN: 978-1-4939-3072-2
Online ISBN: 978-1-4939-3073-9
eBook Packages: Springer Protocols