
Abstract
The application of many sensor devices and complex information communication networks in a power system brings new potential threats to the electrical cyber-physical system. In this paper, a coordinated cyber-physical attack method considering false line overload is proposed. Through the combination of physical side attack and information side attack, the false data injection attack is used to cover up the physical attack and create false overload events, leading the dispatcher to make unreasonable scheduling strategies to achieve the purpose of affecting the economic operation of the system. In response to false overload events, this paper proposes a method to select the target line of false overload. At the same time, the output cost of the generator, the cost of load reduction and the number of overload lines are used as the evaluation indices to measure the damage capability of the coordinated attack, and the evaluation indices of different dimensions are normalized using fuzzy methods. Finally, the system losses caused by different attack modes are compared and analyzed through simulation calculations, and the effectiveness of the proposed model is verified.
1 Introduction
With the penetration of information and communication technologies in power systems, the information exchange between power networks and information networks is becoming more intense. Consequently, the traditional power system has gradually developed into a power cyber-physical system (CPS) [1,2,3]. To ensure the safe and stable operation of the system, a large number of sensors are installed in the CPS to obtain real-time operation data on the system. However, while sensors promote real-time analysis and scientific decision-making, security vulnerabilities in information networks pose new threats. Compared with the relatively robust power network, the security protection against information networks is relatively weak. Thus, any malicious attack on the power CPS from the cyber side is likely to cause large-scale system disturbance and failure [6, 7].
In recent years, cyber-attack is an emerging means of attack against the cyber side of the power CPS. Typical network attacks include denial of service (DOS) attacks [8], replay attacks, and false data injection (FDI) [9,10,11]. Measurement data and communication lines are selected as the targets for these attacks. They affect the economic operation of the system by means of data tampering and delayed communication. In addition to cyber-attack, the operation of CPS is also threatened by physical attacks. Although the power CPS can usually tolerate N-1 or even N-2 contingencies, if the operator cannot quickly and effectively respond to line interruptions, allowing the existence of line faults, there is a high risk of chain failures leading to significant power outages [12,13,14]. In this case, a new attack method called coordinated cyber-physical attack (CCPA) comes into being [15, 16]. Coordinated cyber-physical attacks can cover up physical attacks by constructing special fake data injection attacks. Compared with single false data injection attacks or physical attacks, coordinated cyber-physical attacks do more harm to power systems [17,18,19].
At present, coordinated cyber-physical attacks have received widespread attention. In [20], after the physical attack breaks the transmission line, the attacker tampers with the measured data in the power system by launching topology retention and load redistribution attacks in order to mask the topology change of the power system. A bi-level programming model considering physical, topology retention, and load redistribution attacks is established. Reference [21] describes how the constructed false data attack vectors can evade the false data detection mechanism while masking the physical attacks, in which the state estimation constraint is considered in the attack model to enhance the concealment of the coordinated attacks. In [22], a partial FDI attack strategy is proposed to deteriorate system performance. This strategy tampers with partial sensor measurements by injecting false signals into the feedback communication channel. This enhances the concealment of the coordinated attack. In [23], a multi-stage FDI attack game model is proposed to extend the attack scope through data tampering, policy adjustment and multi-stage attack, though it is not a coordinated attack. Considering the limitations of an attacker's capability in practical situations, reference [24] constructs a coordinated cyber-physical attack model with limited physical attack resources. It gives the optimal attack strategy for the attacker in regular operation and N-1 operation state through simulation analysis. Reference [25] states that attackers and dispatchers have conflicting optimization objectives, constructs a two-layer optimization model of coordinated cyber-physical attack with conflicting goals, analyzes the damage capability of coordinated attack on the system under different attack resources, and provides a vulnerability analysis method for the measurement units.
In the above studies on coordinated cyber-physical attacks, the attacker launches physical attacks to damage transmission lines and tampers with the measurement data of the cyber-physical system through a cyber-attack, so that the dispatcher cannot detect the existence of the physical attacks. In this case, the cyber-attack has become a means to cover up a physical attack while not causing substantial damage to the cyber-physical system. All the damage to the power system is caused by the physical attacks, and the cyber-attack is reduced to an auxiliary tool of the physical attacks. Looking at coordinated cyber-physical attacks, this paper considers the subjective misleading role of a cyber-attack. In addition to masking the physical attack, it makes the dispatcher wrongly believe that a normally operating transmission line is overloaded by modifying the measurement data, causing a false overload event. In this case, the dispatcher cannot detect the disconnection of the line caused by the physical attack, and has the wrong line operating status. Consequently, the dispatcher will formulate seriously unreasonable dispatching strategies, which will endanger the economic operation of the cyber-physical system. In this attack mode, both the physical attack part and the cyber-attack part will cause damage to the financial operation of the system, which truly realizes the coordination of physical attack and cyber-attack.
The contributions of this paper are summarized as follows.
-
(1)
In response to false overload events, a method for selecting faulty overload target lines is proposed. By comparing the increase in system operation costs caused by line overload, the line with the most significant overload hazard can be judged and selected as the target line for false overload.
-
(2)
A new quantitative representation method is proposed to measure the destructive effect of the coordinated cyber-physical attacks. In addition to the generator output cost and load cutting cost, the number of overload lines is used as a measure.
-
(3)
A bi-level programming model of coordinated cyber-physical attack is constructed considering false line overload, where false data injection attacks mask physical attacks causing false overload events.
-
(4)
Finally, the losses caused by different attack modes are compared and analyzed through simulation, and the effectiveness of the proposed model is verified. In addition, the above evaluation indices with different levels of measurements are normalized.
2 Power coordinated cyber-physical attack model
2.1 Description of coordinated cyber-physical attack
The diagram of a power coordinated cyber-physical attack is shown in Fig. 1. The real-time operation data of the system is transmitted to the SCADA system through large numbers of sensor devices and complex information communication networks. The dispatcher judges the operational state of the system according to the real-time operation data, and then makes corresponding dispatching strategies to adjust the generator outputs and load reduction values. The process of coordinated cyber-physical attacks is as follows:
-
Attackers initiate a physical attack on the physical side to destroy the transmission line.
-
At the same time, attackers initiate a false data injection attack on the cyber side to tamper with the data of the measurement units, including node active injection power, line power flow, etc.
-
Attackers create false overload events while covering up line disconnection.

Diagram of coordinated cyber-physical attacks
By launching attacks on the physical and cyber sides at the same time, the dispatcher cannot grasp the actual operational state of the system and makes wrong scheduling decisions, so the attacker’s purpose of affecting the economic operation of the system is achieved.
2.2 False data injection attacks mask physical attacks
Because of the change of measurement data, the dispatcher can easily detect the line disconnection caused by the physical attack. However, at this time, if the attacker launches a false data injection attack and tampers with the load measurement and branch power flow measurement values related to the defective line, the dispatcher will mistakenly believe that the faulty line will be in regular operation. In this way, the dispatcher will not be able to detect the line interruption, thus losing the ability to respond to the system topology change caused by line failure.
The false data injection attack model used to cover up the physical attack is shown as [19]:
where \(N_{d}\) is the number of nodes, \(\Delta P_{d,i}\) is the amount of attack injected into the load measurement value at the node \(i\), \(P_{d,i}\) is the load demand at node \(i\), and \(\tau\) is a constant used to limit the amount of injected attack in the load measurement value to avoid the discovery by the dispatcher. \(K_{D}\) and \(K_{G}\) represent the respective node-load incidence matrix and node-generator incidence matrix, while \(\Delta P_{d}\) and \(\Delta P_{F}\) represent the attack volumes in the load measurement and branch power flow measurement, respectively. \(S_{F}\) and \(S_{F}^{A}\) represent the respective transfer factor matrix before and after the attack.
In addition, Eq. (1) does not reflect the decision-making process of physical attack, but determines the attack volume on the cyber side. This realizes the masking effect of the cyber-attack after a physical attack. The specific expression of the transfer factor matrix is:
where \(A\) is the node-line incidence matrix, \(\Lambda\) is the diagonal matrix of line reactance value, \(B^{ + }\) is the Moore–Penrose pseudoinverse of the node admittance matrix \(B\). The expressions of \(\Lambda\) and \(B\) are given as:
When the system suffers from the physical attack, the disconnection of the transmission line will cause a change in line reactance and elements in the node-line incidence matrix. Therefore, \(S_{F}\) is updated to obtain the transfer factor matrix \(S_{F}^{A}\) after the physical attack.
2.3 False data injection attacks create false overload
In this section we consider the misleading subjective role of cyber side attacks. By tampering with the measured data, such as node active power injection and line power flow, the dispatcher will make an error estimation of the operational state of the transmission line, i.e., creating false overload events. The attack form used to create false overload events is still within the scope of the false data injection attack. This type of attack tampers with the measurement data to obtain economic benefits of power information equipment and SCADA system through malicious mail, virus implantation, and other channels.
After the system is subjected to the false overload attack, the dispatcher will mistakenly think that normal operating lines are overloaded, and make a wrong judgment on the system operational status. Consequently, unreasonable scheduling strategies may be made to change the system operational status which can increase the system operation cost.
For the line with the false overload target, it is selected according to the maximum overload hazard of the line. By comparing the system operation cost after line overload, the harm of line overload is ranked from high to low. The higher the system operation cost after line overload, the greater the damage. The specific process is shown in Fig. 2.

Flowchart of false overload target line selection
The solution model of system operation cost in the case of line overload is expressed as:
where \(D\), \(G\) and \(L\) represent the set of nodes, generators, and branches, while \(N_{d}\), \(N_{g}\) and \(N_{l}\) are the number of nodes, generators, and lines, respectively. \(\arg \min ( \cdot )\) represents the value of the independent variable that minimizes the objective function, while \(c_{g,j}\) and \(P_{g,j}\) represent the output cost and out value of the generator \(j\), respectively. \(c_{d,i}\) and \(P_{c,i}\) represent the load reduction cost and load reduction at node \(i\), respectively, while \(P_{F,l}\) and \(P_{F,l}^{\max }\) represent the power flow value and the capacity of the line \(l\), respectively. \(P_{g,j}^{\min }\) and \(P_{g,j}^{\max }\) represent the respective minimum and maximum output of the generator \(j\), while \(P_{g}^{*}\) and \(P_{c}^{ * }\) represent the respective generator output value and load reduction after the implementation of the dispatching strategy.
In this paper, the cost of generator output and load reduction are used as the objective function. The load reduction cost reflects the price paid by the system for dispatching measures up to a certain extent. Combined with the generator output cost, we consider the economic indicators of system operation from an overall perspective.
The selection of lines to be overloaded should traverse all transmission lines, comparing the operating costs of the systems after different lines are overloaded, and then selecting the line with the greatest overload hazard as the false overload target line, recorded as \(l^{^{\prime}}\). To ensure the concealment of the physical attack, generally, the line damaged by the physical attack is not selected as the false overload target line. If the line with the most significant overload hazard is the same as the line damaged by the physical attack, the line with the second overload hazard is selected as the false overload target line.
3 Bilevel programming model of coordinated cyber-physical attack
3.1 Objective function
By launching attacks on the physical and cyber sides at the same time, coordinated cyber-physical attack can lead dispatchers to make unreasonable scheduling strategies which will affect the economic operation of the system. This paper constructs a multi-objective function to measure the damaging effect of coordinated attack by considering the generator output cost, load reduction cost, and the number of overload lines after the scheduling strategy, as:
where \(k_{l}\) is a 0–1 variable to indicate whether line \(l\) is overloaded, \(k_{l} = 1\) means that line \(l\) is overloaded, and \(k_{l} = 0\) indicates that line \(l\) is in regular operation.
The attacker’s objective function proposed in this section includes two parts:
-
1.
The number of overloaded lines of the system after the scheduling strategy.
-
2.
System operation cost after dispatching strategy (sum of generator output cost and load reduction cost).
The system operation cost describes the impact of the coordinated attacks on the system from the economic perspective and reflects the economic cost after the implementation of the dispatching strategy. Once the dispatcher implements the dispatching policy according to the state after the system is attacked, the number of lines still in the overloaded state in the system indicates the number of overloaded lines. It describes the influence degree of the system under the coordinated attack from the perspective of the deviation degree of the system operational state.
The two objective functions have different dimensions. In this paper, we use the fuzzy solution method for the above problem, and the process is as follows:
-
(1)
Taking the maximum number of overload lines caused by the attack as the objective function for optimization calculation, the maximum benefit \(f_{1M}\) is obtained as the upper limit of the attacker's income. The obtained solution and some parameters are substituted into the objective function \(f_{2}\) to calculate the system generator output cost and load reduction cost \(f_{2m}\).
-
(2)
Taking the maximum sum of the system generator output cost and load reduction cost caused by the attack as the objective function for optimization calculation, the maximum operating cost \(f_{2M}\) is obtained, and used as the upper limit of the system operating cost. The solution and some parameters at this time are substituted into the objective function \(f_{1}\) to obtain the benefit \(f_{1m}\).
-
(3)
The two objective functions are fuzzified, and the mapping from a single objective function to membership degree is established. In this paper, the membership function of a semi-trapezoidal distribution is selected. Taking objective function 1 as an example, if \(f_{1}\) is more significant than \(f_{1M}\), the membership degree is 1, if \(f_{1}\) is less than \(f_{1m}\), the membership degree is 0, and if \(f_{1}\) is between \(f_{1M}\) and \(f_{1m}\), it is a linear distribution. The membership distribution is shown in Fig. 3.
$$\mu \left( {f_{1} } \right) = \left\{ {\begin{array}{*{20}c} {0,} & {f_{1} \le f_{1m} } \\ {\frac{{f_{1} - f_{1m} }}{{f_{1M} - f_{1m} }},} & {f_{1m} < f_{1} < f_{1M} } \\ {1,} & {f_{1} \ge f_{1M} } \\ \end{array} } \right.$$(17)$$\mu \left( {f_{2} } \right) = \left\{ {\begin{array}{*{20}c} {0,} & {f_{2} \le f_{2m} } \\ {\frac{{f_{2} - f_{2m} }}{{f_{{{2}M}} - f_{{{2}m}} }},} & {f_{2m} < f_{2} < f_{2M} } \\ {1,} & {f_{2} \ge f_{2M} } \\ \end{array} } \right.$$(18)where \(\mu \left( {f_{{1}} } \right)\) and \(\mu \left( {f_{{2}} } \right)\) are the membership degrees of the two objective functions of the maximum line overload quantity and the maximum operational cost of the system. \(\mu \left( {f_{{1}} } \right)\) indicates the closeness between the objective function \(f_{1}\) and its maximum value \(f_{1M}\), i.e., the proximity to the maximum number of line overloads caused by the attack. The closer its value to 1, the more line overloads caused by the attack. \(\mu \left( {f_{{2}} } \right)\) indicates the closeness between the objective function \(f_{2}\) and its maximum value \(f_{2M}\), i.e., the closeness of the attack to the highest running cost of the system The closer its value to 1, the higher the cost of running the system caused by the attack.
Fig. 3 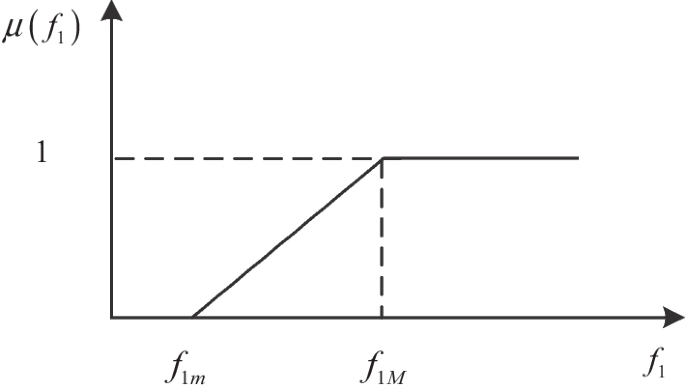
Membership distribution graph of the objective function

The membership functions of the above two objective functions are linearly weighted to obtain the fuzzy bi-objective optimization objective function, as:
where \(\alpha\) and \(\beta\) are the weight coefficients of system operation cost and the number of line overloads, and \(\alpha + \beta = 1\).
3.2 Double-layer model construction
In the process of a coordinated attack, the attacker attacks the target line and injects false data into the measurement data first. The dispatching center then makes economic dispatching according to the tampered measurement data. The targets of the attacker and dispatcher are to maximize and minimize the damaging effect of the attack, respectively. This paper constructs the following double-layer mathematical model of a coordinated cyber-physical attack, considering the conflict between the objectives of attacker and dispatcher.
The upper model describes the situation where the attacker has specific attack resources, and seeks the optimal attack strategy and brings the most significant loss to the power grid.
-
(1)
Objective function: the objective function is to maximize the number of line overloads and system operation cost, i.e.:
$$\max \left\{ {\alpha \mu \left( {f_{{1}} } \right) + \beta \mu \left( {f_{{2}} } \right)} \right\}$$(20) -
(2)
Construction and constraint of false data attack volume.
The attacker can cover up the physical attack and create false overload events by injecting false data into the measurement data. The attack volume \(\Delta P_{d}\) injected into the node load measurement value and the attack volume \(\Delta P_{F}\) injected into the line power flow measurement value should meet the following requirements:
Equations (21) and (22) represent the limit on the attack volume of node load measurement value, and (23) represents the limit on the attack volume of line power flow value. The above equations work together to achieve the cover function of cyber-attacks against physical attacks. Equation (24) represents that the power flow value of line \(l^{^{\prime}}\) exceeds its capacity after the cyber-attack, and realizes the function of creating false overload events by the cyber-attack.
-
(3)
Attack resource constraint
In reality, the attacker is limited by the attack resources, and the amount of measurement information that can be tampered with is limited. Assuming that the attacker will consume attack resources when injecting attack volume into node load and line power flow measurement, a limited attack resource constraint is established:
where \(\delta_{d,i}\) and \(\delta_{F,l}\) are 0–1 variables used to judge whether the measured data of node \(i\) and line \(l\) are attacked, and \(R_{a}\) represents the attack resources owned by the attacker. The physical meaning of the attack resources is the amount of measurement information that the attacker can alter. Tampering with the node load measurement consumes attack resources of 1, and tampering with the line power flow measurement consumes attack resources of 2. For line \(k - l\), the power flow value from node \(k\) to node \(l\) is opposite to that from node \(l\) to node \(k\), so one line will involve two power flow measurements. Therefore, the attack resources consumed by tampering with the power flow measurements are 2.
(4) Overload line constrained.
The dispatcher is misled by false data and formulates wrong dispatching strategies, which may cause an unreasonable distribution of power flow and overload of the transmission lines. According to the actual system topology after the physical attack and the generator output value and load reduction after the implementation of the dispatching strategy, the real power flow value of the line is calculated as:
where \(P_{F}^{^{\prime}}\) represents the actual power flow value of the line after implementing the dispatching strategy.
Comparing the real power flow value of the line after dispatching with the line capacity to judge the line overload, we obtain:
where \(P_{F,l}^{^{\prime}}\) represents the actual power flow value of line \(l\) after implementing the dispatching strategy.
The lower-level model describes the situation where, after a coordinated attack on the grid, the dispatcher, based on knowledge of the operating status of the grid, can minimize the damage caused by the attack while satisfying its own constraints through reasonable generator output scheduling and load reduction scheduling.
-
(1)
The objective function is to minimize the number of line overload and system operation costs, i.e.:
$$(P_{g,i}^{ * } ,P_{c,i}^{ * } ) = \arg \min \left( {\alpha \mu \left( {f_{{1}} } \right) + \beta \mu \left( {f_{{2}} } \right)} \right)$$(30) -
(2)
The power system has branch power flow constraints, as shown in (11) and (15).
-
(3)
The power system has power balance constraints, and the sum of output values of each generator should meet the load demand, as shown in (12).
-
(4)
The load reduction in the power system has upper and lower limit constraints. The maximum load reduction at each node is the sum of node load demand and load attack volume, as shown in (13).
-
(5)
The generator set in the power system has the upper and lower limit constraints of output, as shown in (14).
3.3 Solution method
The two-layer coordinated cyber-physical attack problem constructed above cannot be solved directly. Thus, the KKT (Karush–Kuhn–Tucker) condition is used to replace the lower model to obtain the equivalent constraint conditions of the lower model:
where \(c_{g}\) and \(c_{d}\) represent the output cost and load reduction cost of the generator, respectively, and \(\lambda\), \(\mu\), \(al\), \(au\), \(bl\), \(bu\), \(cl\) and \(cu\) are the Lagrange constants. The symbol \(\bot\) indicates that 0 is obtained by multiplying the two formulas and \(0 \le a \bot b \ge 0\) is equivalent to:
For the nonlinear constraints (34)–(39), the Fortuny-Amat–McCarl method is used to linearize them [20]. Finally, the model is transformed into a single-layer mixed-integer linear programming model.
4 Simulation analysis
This paper takes the IEEE 14-bus system as an example [21] to simulate and analyze a coordinated cyber-physical attack. The structure of the IEEE 14-bus system is shown in Fig. 4. The optimization algorithm solver adopts the CPLEX optimization toolbox and realizes all analysis on the MATLAB 2016a program. The hardware environment adopts an Intel Core I 3 processor and 4 GB memory.

IEEE 14-bus system topology
The system parameter settings are given as follows: the capacity of line 1–2 is 160 MW, the capacity of other branches is 60 MW, the load shedding loss is 100 USD/MWh, while the parameters of the generators are shown in Table 1. The attack costs \(R_{d,i}\) and \(R_{F,l}\) are set to 1. The objective function weight coefficients \(\alpha\) and \(\beta\) are both set to 0.5. Other parameters are from the MATPOWER power flow analysis software package.
4.1 False overload event analysis
The proportion of line power flow capacity under regular operation of the system is shown in Fig. 5, and the system operation cost under false overload is shown in Fig. 6. As shown in Fig. 6, it is unable to achieve false overload events for lines 1, 7, 8, 15, 16, 17, and 18.

Line power flow accounts for the proportion of capacity during normal operation

Operating cost under false overload conditions
From the perspective of the normal operation of the line power value, the reason for no solution is that the above line power flow value accounts for a small proportion of the line capacity when the system is in normal operation, and thus, it is difficult to forcibly tamper with the branch power flow measurement value to exceed the limit.
Comparing the system operation costs when different lines are overloaded in Fig. 6, the system operation cost is the largest when line 2 is overloaded. Thus, it is considered that the overload of line 2 has the most significant impact on the system, and therefore line 2 is described as the line with the greatest overload threat. Similarly, it is considered that line 14 is the line with the second greatest threat of overload.
In addition, based on the IEEE 14-bus system, this paper further uses the standard IEEE 57-bus system [25] to test the performance of the false overload line selection method. Figure 7 shows the system operation cost under the wrong overload of the IEEE 57-bus system. At the same time, the simulation results of the two different systems are compared, as shown in Table 2.

Operating cost under false overload conditions of the IEEE 57-bus system
It can be seen that compared with the IEEE 14-bus system, the system scale of the IEEE 57-bus system is significantly larger. The solution time increases from 1.13 s to 38.66 s, but still remains at an acceptable level. It shows that the false overload target line selection method proposed in this paper can solve the system efficiently.
4.2 Analysis of attack effects of different attack types
The following attack types are tested to compare and analyze the damage effects of different attack types based on the IEEE 14-bus system.
Attack type 1: Launch only physical attack and select other lines as physical attack targets.
Attack type 2 [26]: Launch a coordinated attack that only considers the masking effect. After the physical attack, it is masked by constructing an FDI attack.
Attack type 3: Consider the coordinated attack of false overload. After launching the physical attack, it makes the FDI attack to cover the physical attack and constructs the false overload event.
Table 3 shows the attack effects of the three attack types when the attack resource is 15. "—" indicates that there is no solution to the double-layer model, i.e., when the attack resource is 15, the attacker cannot cover up the physical attack and create false overload events through the false data injection attack. During regular operation of the system, the sum of generator output cost and load reduction cost is 11,819.76 USD/h. From Table 3, it can be seen that the operational cost of the system increases significantly after the system is subjected to the three different types of attacks. Taking attack target line 9 as an example, when the system suffers from the above three types of attacks, the system operation costs increase by 2.07%, 6.35%, and 7.67% respectively, compared with the regular operational state. When the system suffers from attack type 2 and attack type 3, in addition to increasing the operational cost of the system, the system suffers from overload lines. This is because the false data injection attack only tampers with the measured data rather than making real changes to the generator output and load demand of the system. Therefore, the generator output scheduling and load reduction scheduling formulated by the dispatcher do not conform to the real operating state of the system, and the power flow of the system may exceed the limit after the scheduling strategy.
Compared with attack type 2, the false data injection attack in attack type 3 can not only cover up the physical attack, but also create false overload events. This has a more obvious destructive effect on the system. Taking the attack on line 3 as an example, the economic losses caused by the three types of attacks on the system are 13,239.80 USD/h, 12,554.52 USD/h, and 12,656.72 USD/h, respectively. In the case of attack type 2 and attack type 3, due to the masking effect of the false data injection attack, the dispatcher makes a scheduling strategy that does not meet the actual operation of the system, and the operation cost of the system is significantly lower than that of attack type 1. However, attack type 2 and attack type 3 cause 4 overloaded lines. If the dispatcher cannot find the overload lines in time, it may further cause chain failure. Only from the perspective of system operation cost, the effect of a pure physical attack is more prominent. However, considering the system operation cost and the number of overload lines, it is considered that attacks type 2 and 3 are more destructive.
When attacking line 11, the system operation costs of attack type 2 and attack type 3 are 12,565.82 USD/h and 11,963.49 USD/h, respectively. Although the former causes apparent higher economic losses to the system, the latter causes more overload lines. Similarly, from the perspective of comprehensively considering the system operation cost and the number of overload lines, it is concluded that attack type 3 is more destructive to the system than attack type 2.
4.3 Analysis of cooperative attack effect considering false overload under different attack resources
When the attack resources are 10, 15, and 20, the system operation costs of the coordinated attack considering false overload are shown in Table 4. Clearly, the impact of the coordinated attack on the system operation cost is related to the attack resources. The more attack resources, the greater the degree of tampering with the measurement information, and the greater the impact on the economic operation of the system. Taking the attack on line 8 as an example, the system operation costs under different attack resources of 10, 15 and 20 are 12,553.32 USD/h, 12,585.77 USD/h, and 12,616.31 USD/h, respectively. It is clear that when the attack resource is 20, the coordinated attack has the most significant impact on the system operation. Moreover, when the attack resources are small, because of the limited tampers on the load measurement values and branch power flow measurement values, it may not be possible to cover the disconnected lines and initiate false overload events. For example, when the attack resources are 10, it is impossible to launch coordinated attacks on lines 3, 4, and 11. When the attack resources are 10 and 15, it is impossible to launch coordinated attacks on lines 2, 10, and 14.
When the attack resources are 10, 15, and 20, the number of line overloads caused by coordinated attacks considering false overloads is shown in Fig. 8. Taking the attack on line 8 as an example, when the attack resources are 10, 15, and 20, the number of overload lines is 4. Although the number of line overloads is the same, the system operation cost increases with the increase of attack resources, e.g., the operating costs of the system are 12,553.32 USD/h, 12,585.77 USD/h, and 12,616.31 USD/h, respectively. In the case of attacking line 4, when the attack resource is 10, the coordinated attack considering false overload cannot be launched. When the attack resource is 15 and 20, although the cost of the system operation cost decreases with the increase of the attack resource, the number of line overloads increases with the attack resource. When the attack resource is 15, 3 lines are overloaded, and when the attack resource is 20, 4 lines are overloaded.

Number of overloaded lines under different attack resources
As shown in Table 4, when the attack resource is 20, the coordinated attack considering false overload will do the greatest harm to the economic operation of the system. Therefore, taking attack resources of 20 as examples, the distribution of false data injection attack volume \(\Delta P_{d}\) and load reduction \(P_{c}\) are analyzed when physical attacks select different lines as targets, as shown in Figs. 9 and 10.

Bus injection power distribution by attacking different lines

Load reduction distribution by attacking different lines
As can be seen from Fig. 9, the attack power injected into the bus measurement unit for some lines is 0, e.g., line 10, indicating that the attacker cannot launch a physical coordinated attack on the line. However, for most lines, the attacker can modify the measurement value by injecting the corresponding power into the bus measurement unit after disconnecting the line, so that the scheduler cannot detect the disconnection of the line.
The attacker affects the load distribution of the system by injecting the attack volume into the node load measurement. The general trend is to transfer the load at node 3 to node 2, and node 5. Affected by the fake data injection attack, the scheduler believes that there is a large load demand at nodes 2 and 5, which may lead to partial overloading. The scheduler will then disconnect part of the load at the overloaded node through load reduction.
As shown in Fig. 10, the general trend of load reduction in the IEEE 14-bus system is to reduce the load values at nodes 2 and 5. When attacking line 2, for example, the amount of attack injected by the attacker into nodes 2, 3, 4, 5, 6, 9, 13 and 14 are 10.55 MW, -21.025 MW, 13.5466 MW, 27.5391 MW, -14.75 MW, -4.5 MW, -3.9107 MW, and -7.45 MW, respectively. Load reduction scheduling occurs at nodes 2, 4, and 5, with sizes of 21.1 MW, 4.0607 MW, and 30.5193 MW, respectively.
5 Conclusion
As a particular form of attack, the power coordinated cyber-physical attack can change the system topology and cover up the disconnection fault at the same time through the combination of physical attack and cyber-attack. In this paper, a new evaluation method is proposed for the damage effect of such coordinated attack. In addition to considering the generator output cost and load reduction cost, the number of overload lines is taken as one of the indicators to measure the destructive effect of the coordinated cyber-physical attack. Based on the coordinated attack considering only the masking effect, this paper fully considers the subjective misleading of the cyber-attack, and constructs the coordinated cyber-physical attack model considering false overload. While using the cyber-attack to mask the physical attack, this coordinate attack can also create false overload events. Through simulation analysis, compared with pure physical attack and coordinated cyber-physical attack considering only the masking effect, the coordinated attack proposed in this paper does more harm to the system. Its damage effect is directly proportional to the attack resources held by the attacker, and the more attack resources, the more damaging effect of the coordinated attack on the system. By analyzing the system losses under different attack resources, the coordinated attack method proposed in this paper has more vital destructive ability, though this advantage is at the cost of requiring more attack resources. When the attacker has fewer attack resources, it is generally impossible to cover up the physical attack and create false overload events through cyber-attack at the same time.
Therefore, the next research work will study coordinated cyber-physical attack methods under given finite attack resources, analyze the attack-related characteristics, and propose suitable defensive measures for coordinated cyber-physical attack.
Availability of data and materials
Not applicable.
Abbreviations
- CPS:
-
Cyber-physical system
- DOS:
-
Denial of service
- FDI:
-
False data injection
- CCPA:
-
Coordinated cyber-physical attack
References
Lau, P., Wang, L. F., Liu, Z. X., et al. (2021). A coalitional cyber-insurance design considering power system reliability and cyber vulnerability. IEEE Transactions on Power Systems, 36(6), 5512–5524.
Dong, Z. C., Tian, M., & Ding, L. (2021). A framework for modeling and structural vulnerability analysis of spatial cyber-physical power pystems from an attack–defense perspective. IEEE Systems Journal, 15(1), 1369–1380.
Mohamed, A. S., Arani, M. F. M., Jahromi, A. A., et al. (2021). False data injection attacks against synchronization systems in microgrids. IEEE Transactions on Smart Grid, 1(1), 1–13.
Al-Gburi, Q. A., & Mohd Ariff, M. A. (2019). Dynamic security assessment for power system under cyber-attack. Journal of Electrical Engineering & Technology, 14, 549–559.
Xu, Y. (2020). A review of cyber security risks of power systems: From static to dynamic false data attacks. Protection and Control of Modern Power Systems, 5, 19.
Paul, S., Ding, F., Utkarsh, K., et al. (2022). On vulnerability and resilience of cyber-physical power systems: a review. IEEE Systems Journal, 16(2), 2367-2378.
Jena, P. K., Ghosh, S., & Koley, E. (2021). A binary-optimization-based coordinated cyber-physical attack for disrupting electricity market operation. IEEE Systems Journal, 15(2), 2619–2629.
Li, P., Yun, L., & Xin, H. (2018). A robust distributed economic dispatch strategy of virtual power plant under cyber-attacks. IEEE Transactions on Industrial Informatics, 14(10), 4343–4352.
Babadi, N., & Doustmohammadi, A. (2022). A moving target defence approach for detecting deception attacks on cyber-physical systems. Computers and Electrical Engineering, 100, 107931.
Liu, X., Bao, Z., Lu, D., et al. (2015). Modeling of local false data injection attacks with reduced network information. IEEE Transactions on Smart Grid, 6(4), 1686–1696.
Chen, L. D., Ma, L., Liu, N., et al. (2022). Parameter tampering cyberattack and event-trigger detection in game-based interactive demand response. International Journal of Electrical Power & Energy Systems, 135, 107550.
Xiang, Y. M., Wang, L. F., & Liu, N. (2017). Coordinated attacks on electric power systems in a cyber-physical environment. Electric Power Systems Research, 149(8), 156–168.
Liu, Z. X., & Wang, L. F. (2020). Leveraging network topology optimization to strengthen power grid resilience against cyber-physical attacks. IEEE Transactions on Smart Grid, 12(2), 1552–1564.
He, H. H., Huang, S. J., Liu, Y. J., et al. (2021). A tri-level optimization model for power grid defense with the consideration of post-allocated DGs against coordinated cyber-physical attacks. International Journal of Electrical Power & Energy Systems, 130, 106903.
Deng, R., Peng, Z., & Hao, L. (2017). CCPA: Coordinated cyber-physical attacks and countermeasures in smart grid. IEEE Transactions on Smart Grid, 8(5), 2420–2430.
Tian, J. W., Wang, B. H., Li, T. Y., et al. (2020). Coordinated cyber-physical attacks considering DoS attacks in power systems. International Journal of Robust and Nonlinear Control, 30(11), 4345–4358.
Li, Z. Y., Shahidehpour, M., Alabdulwahab, A., et al. (2018). Analyzing locally coordinated cyber-physical attacks for undetectable line outages. IEEE Transactions on Smart Grid, 9(1), 35–47.
Lai, K., Illindala, M., & Subramaniam, K. (2019). A tri-level optimization model to mitigate coordinated attacks on electric power systems in a cyber-physical environment. Applied Energy, 235(2), 204–218.
Wang, Z. H., He, H. B., Wan, Z. Q., et al. (2021). Coordinated topology attacks in smart grid using deep reinforcement learning. IEEE Transactions on Industrial Informatics, 17(2), 1407–1415.
Li, Z. Y., Shahidehpour, M., Alabdulwahab, A., et al. (2016). Bilevel model for analyzing coordinated cyber-physical attacks on power systems. IEEE Transactions on Smart Grid, 7(5), 2260–2272.
Deng, R. L., Zhuang, P., & Liang, H. (2019). False data injection attacks against state estimation in power distribution systems. IEEE Transactions on Smart Grid, 10(3), 2871–2881.
Pang, Z. H., Fan, L. Z., Dong, Z., et al. (2022). False data injection attacks against partial sensor measurements of networked control systems. IEEE Transactions on Circuits and Systems II: Express Briefs, 69(1), 149–153.
Yi, N., Wang, Q., Yan, L. M., et al. (2021). A multi-stage game model for the false data injection attack from attacker’s perspective. Sustainable Energy, Grids and Networks, 28, 100541.
Srivastava, A. K., Ernster, T. A., Liu, R., et al. (2018). Graph-theoretic algorithms for cyber-physical vulnerability analysis of power grid with incomplete information. Journal of Modern Power Systems and Clean Energy, 6, 887–899.
Wei, Z. Y., Liu, C. H., Xie, Z. B., et al. (2021). Reliability evaluation of cyber-physical system considering integration of power and communication risk. International Conference on Power System Technology (pp. 8–9).
Tian, M., Dong, Z. C., Wang, X. P., et al. (2019). Analysis of electrical coordinated cyber physical attacks under goal conflict. Power System Technology, 43(07), 2336–2344.
Yang, J., & Su, C. Q. (2021). Robust optimization of microgrid based on renewable distributed power generation and load demand uncertainty. Energy, 223, 120043.
Acknowledgements
Not applicable.
Funding
This work was supported in part by National Key R&D Program of China under Grant 2018YFA0702200 and in part by National Natural Science Foundation of China under Grant 61773099.
Author information
Authors and Affiliations
Contributions
The paper was a collaborative effort among the authors. All authors read and approved the final manuscript.
Authors' information
Jun Yang was born in 1976. He received his B.Eng. degree in Automation from Dalian University of Technology, China in 1999 and his M.E. degree in Control Theory and Engineering from Shenyang University of Technology, China in 2004. In 2008, he received Ph.D degree in Control Theory and Control Engineering from Northeastern University, China in 2008. He is currently an associate professor and doctoral advisor in the Institute of Electrical Automation, College of Information Science and Engineering, Northeastern University, China. His major interests include new energy power generation and grid connection optimization, power system networked control, active distribution system collaborative control, energy Internet and smart energy.
Guanhang Sun was born in 1999. Since 2021, he joined Northeastern University, China to pursue for a master's degree in Electrical Engineering. His major interest is distributed detection strategy for cooperative attacks on cyber physical systems.
Jianshu Yin was born in 1995. He received his M.E. degree in Electrical Engineering from Northeastern University, China in 2021. He currently works in the Economic and Technological Research Institute, State Grid Inner Mongolia East Electric Power Co., LTD., China. His major interest is the cooperative attack and defense strategy of cyber physical systems.
Corresponding author
Ethics declarations
Competing interests
The authors declare that they have no known competing financial interests or personal relationships that could have appeared to influence the work reported in this paper.
Rights and permissions
Open Access This article is licensed under a Creative Commons Attribution 4.0 International License, which permits use, sharing, adaptation, distribution and reproduction in any medium or format, as long as you give appropriate credit to the original author(s) and the source, provide a link to the Creative Commons licence, and indicate if changes were made. The images or other third party material in this article are included in the article's Creative Commons licence, unless indicated otherwise in a credit line to the material. If material is not included in the article's Creative Commons licence and your intended use is not permitted by statutory regulation or exceeds the permitted use, you will need to obtain permission directly from the copyright holder. To view a copy of this licence, visit http://creativecommons.org/licenses/by/4.0/.
About this article

Cite this article
Yang, J., Sun, G. & Yin, J. Coordinated cyber-physical attack considering false overload of lines. Prot Control Mod Power Syst 7, 44 (2022). https://doi.org/10.1186/s41601-022-00267-6
Received:
Accepted:
Published:
DOI: https://doi.org/10.1186/s41601-022-00267-6