
Abstract
Hospitals’ daily operations have become increasingly dependent on medical devices. However, the occurrence of faults is inevitable. Therefore, it is crucial for hospitals to make timely fault diagnoses and enact the corresponding measures and improvements. This paper proposes a novel concept lattice method for the intelligent diagnosis of medical device faults. To minimize the influence of uncertain factors, fuzzy sets are used to accurately express relationships between concepts. First, the occurrence frequency and severity of each fault type are extracted based on the collected information. Then, the fuzzy formal context of occurrent faults and known faults can be constructed. Next, the corresponding fuzzy concept lattice is established and visualized using a Hasse diagram. Finally, the similarity between the concept lattices is calculated and used for fault diagnosis. Here, the weight factors are determined using the decision-making trial and evaluation laboratory (DEMATEL) method. A comparative analysis is performed to show that the proposed method uses simple calculations and is highly accurate.
1 Introduction
In modern medicine, medical devices generally include instruments, devices, appliances, materials, software and other items that can be used individually or in combination, such as ventilators, monitors, syringe pumps, infusion pumps, computed tomography (CT) scans, magnetic resonance imaging, colour Doppler ultrasounds and blood dialyzers. These devices have become indispensable parts of modern hospitals and essential tools for hospitals’ normal work, such as medical treatments, scientific research, teaching, and ensuring the necessary conditions for survival. The economic benefits that are created by such devices also bring about a great proportion of hospitals’ overall benefits [1], which affect the diagnostic abilities and technical development of hospitals [2]. The installation, maintenance, repair and disposal of medical devices are the main tasks of hospitals and are all directly related to the effectiveness of testing, collaboration and the continuity of the hospitals’ overall medical work [3]. In daily applications, most medical devices utilize advanced technology and are highly precise instruments that can present multiple faults [4]. That is, in the process of long-term storage and protection, the performance of these devices will attenuate as a result of the influence of various factors [5]. There will be inevitable mechanical and electrical component faults that result in errors in the output data. In less severe cases, a patient’s treatment may be stopped before it is complete. In serious cases, misdiagnoses may occur, which may even threaten the life and safety of patients and cause greater difficulties for the hospitals’ overall medical work [6]. In previous studies, some medical errors were found to be caused by device failures, resulting in the insufficient medication of patients [7]. The health of patients has deteriorated in numerous instances due to malfunctioning or misused medical devices [8]. In medical applications, the stability, safety and reliability of medical devices are subject to high demands [9]. Therefore, fault diagnosis plays an important role in ensuring the reliability of medical diagnoses [10].
In current studies, the accurate detection and assessment of faults have gradually become important parts of medical engineering. These tasks also require hospitals to scientifically manage medical devices, ensure their safe use, strengthen fault diagnosis technology and improve the quality of their device inspection and maintenance. All these measures are implemented to effectively reduce the failure rate of medical devices. In general, faulty medical devices can be replaced or fixed through professional maintenance. However, in practical applications, the costs of such measures are high. The corresponding causes of the faults are often not clear, and the maintenance methods are not systematic, which also leads to increased economic costs, wasted time, wasted resources and other problems that are not in line with green development [11]. Moreover, the development of technology means that the original information management system cannot fully meet the needs of medical work, especially the needs of managing medical device fault diagnosis and maintenance. Traditional fault diagnosis methods based on observations, opinions and experience have involve more human factors, which create some problems, such as the lack of effective quantitative information. Therefore, the comprehensive analysis, diagnosis and prediction of device faults by intelligent methods have become popular research topics in recent years [12]. As shown in Fig. 1, when a device is in good condition, standard samples are collected. Preprocessing and extracting feature parameters are conducted to establish a standard database. Then, the relevant information of the device can be input using a human–machine interface (HMI) to establish the knowledge base. When the device experiences faults, the information is collected by the sensor and processed by the HMI. Next, state recognition is conducted to obtain the fault diagnosis result. Finally, maintenance downtime, key monitoring, circuit monitoring and other measures are carried out to maintain and protect the device.

The overall technical process of device fault diagnosis
In the overall technical process of device fault diagnosis, obtaining diagnosis results more accurately and faster is the research emphasis. In this paper, fuzzy sets, concept lattices, and the decision-making trial and evaluation laboratory (DEMATEL) are integrated to study the intelligent diagnosis of occurrent faults in medical devices. A concept lattice is a partially ordered set with conceptual elements [13]. The structured model is derived from the theory of formal concept analysis (FCA) and has gradually become a core data analysis tool. In conceptual thinking, the denotation of a concept refers to all objects with the common essential attributes of the concept, and the connotation refers to the common essential attributes of all the conceptual objects [14]. The essence of the concept lattice describes the relation between objects (samples) and attributes (features) and is used to study the deterministic relation between denotations and connotations. The process of generating a concept lattice from a dataset, which is called the formal context in the concept lattice, is essentially a concept clustering process. However, in a realistic research process, the concept description is always expressed using uncertain words and language that is fuzzy. Therefore, this paper improves traditional concept lattices and makes the following two contributions. First, the elements of fuzzy sets are introduced into concept lattices to solve the problem of uncertainty. A device fault is regarded as a concept and the corresponding concept lattice is established by describing the uncertain relationship between its denotation and connotation. In previous calculation processes, the final weight factor was usually determined by only one expert, which was relatively subjective. In addition, in the real world, the relationship between device failures is complex, and sometimes there will be a “complication”, that is, a failure caused by another failure. In fuzzy decision methods, DEMATEL is more effective in solving a system with uncertain relationships between factors. This illustrates the second contribution proposed in this paper: the weight factor is determined using DEMATEL to reduce the subjectivity and maximize the accuracy of the conceptual expression.
The rest of this paper is as follows: Sect. 2 provides a literature review. Some concepts, operations and specific steps of the proposed method are introduced in Sect. 3. Section 4 uses a case to explain the model. Comparative analysis is conducted in Sect. 5. Section 6 provides the managerial insights. Conclusions are drawn in Sect. 7.
2 Literature Review
In this section, the literature will be briefly reviewed from two perspectives: one is the domestic and foreign studies on medical device faults; the other is the fault diagnosis method.
As early as 1985, the United States launched a representative device management system called the Hospital Device Information System (HEIS), the functional design of which included device management components such as preventive maintenance. Mashkoor and Biro thought that some of the reasons for the increased failure rate of modern medical devices were the increasing functionality and complexity of the embedded software that was used [15]. Yang et al. proposed using a health diagnosis to determine the causes of device faults that played important roles in failure analysis and reliability analysis [16]. After collecting these signals, Lei believed that as a mechanical big data processing tool, the process of intelligent fault diagnosis was faster and more efficient than other diagnosis methods, and the results were more accurate [17]. Kohani and Pecht analysed the electrostatic discharge (ESD) faults of medical devices in their database according to five characteristics: device types, failure types, failure modes, user activities and environmental conditions [18]. Simultaneously, they proposed relevant suggestions to reduce the risk of failure. Domestic scholars Li and Zhu stated that intelligent fault diagnoses for medical devices, including fault detection, identification and isolation, should be automatically completed by the systems [19]. The fault diagnosis model should be oriented towards prediction. The establishment of a fault information database also had a certain guiding role in medical research. Li et al. developed a medical device maintenance management system based on enterprise resource planning (ERP), which enabled hospitals to determine device faults and carry out maintenance more effectively and rapidly [20].
When faults occurred, the traditional diagnosis method mainly depended on prior knowledge and diagnosis expertise [16]. In specific, a maintenance engineer analysed and assessed a medical device system based on its composition and working principles using maintenance tools, such as a multimeter or maintenance tester, according to the fault [21]. In addition, the maintenance engineer’s maintenance experience was also used to comprehensively analyse the fault and obtain the fault diagnosis results. In this way, human factors always significantly affected the diagnosis results. There were also problems of low accuracy and high time consumption. In response to these problems, in the era of big data, researchers began to use intelligent methods to detect and diagnose device faults. Zhang et al. proposed a sensor fault detection scheme based on the Bayesian network model to optimize medical body sensor networks (BSNs) and minimize their error rates [6]. Kaspi et al. used existing bike-sharing system data that were collected to estimate the probability of the availability of bicycles and used an equivalent model to detect locker faults [22]. Genetic algorithms (GAs), machine learning (ML) and other intelligent methods have been widely used in various fault diagnoses [23]. Faults in photovoltaic systems are generally divided into open circuit (OC) and short circuit (SC) systems. For these two faults, Hazra et al. proposed meta-heuristic optimization techniques based on tabu search (TS) and GAs to locate and monitor the faults more effectively [24]. Yang et al. accurately classified SC faults in lithium ion batteries by integrating GA and random forest (RF) [25]. Kaid et al. used adaptive neural fuzzy reasoning for the fault diagnosis of photovoltaic modules to monitor solar power plants [26]. Ahmad et al. demonstrated the importance of predictive modelling in fault detection and diagnosis by comparing and studying three models, i.e., integrated machine learning models based on trees, decision trees (DTs) and support vector regression (SVR) [27]. Yang et al. put forward a set of system fault automatic diagnosis methods based on the fuzzy failure mode and effect analysis (FMEA), which combined fuzzy theory and grey correlation theory [28]. However, in practical applications, not all possible faults could be represented by the training sample when dealing with a mechanical system. Therefore, researchers proposed simulation methods for fault diagnosis [29]. Torkaman et al. conducted the numerical analysis and simulation of switched reluctance motor (SRM) faults using the three-dimensional time-step finite element method (3D-TSFEM) [30]. They conducted an in-depth study on the influences of different failures on the change of the power loss of SRMs. Rehman et al. used dynamic simulation and multi-objective optimization to study the effects of ten different technical faults on solar central heating systems [31]. Ates et al. proposed an adaptive protection scheme that was suitable for distributed generation [32]. They showed the effectiveness of the scheme under various failure conditions using the Institute of Electrical and Electronics Engineers’ improved 4-node distribution system for the simulation. In the research and development process of data analysis, Wille first proposed the concept lattice in 1982 [33], which is also known as the Cralois lattice and formal concept analysis. After that, Hao et al. proposed a K-clique group detection algorithm based on formal concept analysis for community detection in social networks [34]. Singh et al. extended formal concept analysis (FCA) to methods such as granular computing, fuzzy settings and interval values and explained the novelty of each extension through its application [35]. At present, the concept lattice has been applied in information retrieval [36], digital library [37], software engineering [38], knowledge discovery [39] and so on. In the description of the concepts, fuzzy sets were usually applied due to the existing uncertainty. Hence, the establishment and research of fuzzy relations between concepts had become a hot topic. Singh et al. proposed an interval-value fuzzy formal concept lattice algorithm to simplify the corresponding fuzzy concept lattice structure [40]. They pointed out that the purpose of extending formal concept analysis from simple settings to fuzzy environments was to deal with uncertain and fuzzy information. De et al. found the hidden correlations amongst heterogeneous elements such as traffic and weather in smart cities using fuzzy time concept analysis based on a distributed real-time computing system [41]. The weights in the calculation process are generally determined using the fuzzy multi-attribute decision-making (MADM) method. Wang et al. proposed the fuzzy best–worst method (BWM) to determine the weights based on the mutual dependence and interaction between the evaluation criteria [42]. Chatterjee et al. obtained the corresponding criteria weights by establishing the network relation map and implementing the rough analytical network process (R’ANP) [43]. Tian et al. combined the fuzzy analytic hierarchy process (FAHP) with fuzzy G-TOPSIS (combining grey base analysis and the technique for order of preference by similarity to ideal solution) method to determine the influencing criteria weights [44]. However, these methods do not minimize the complexity in simplifying the problem. DEMATEL was proposed by American scholars Fontela and Andre in 1974, which is an effective method for factor analysis and identification [45]. It can simplify the composition of and relationships between criteria. Wang et al. considered independent relationships between criteria by combining interval-valued fuzzy group decision tracking and the DEMATEL method to determine weights [46]. Buyukozkan et al. proposed the fuzzy decision-making trial and evaluation laboratory (IF-DEMATEL) method to manage uncertainty and identify relationships between criteria [47]. Zhou et al. integrated the subjective weights that were determined by the fuzzy DEMATEL method and the objective weights that were determined by the anti-entropy weight (AEW) to determine the final weights [48]. In the medical field, Si et al. used the DEMATEL method to build an interactive network to identify the key performance indicators (KPIs) of overall hospital management [49]. Liou et al. combined the AHP, DEMATEL and the improved Visekriterijumska Optimizacija i Kompromisno Resenje (VIKOR) method to find the optimal way to improve electronic health record (EHR) technology [50].
However, in the previous literature, the application of the fuzzy concept lattice to medical research is rare. Furthermore, studies on fault diagnosis using the concept lattice are also very few. In addition to the subjectivity existing in the previous methods, the three points embody the innovations of this paper, which proposes a novel DEMATEL-fuzzy concept lattice model for medical device fault diagnosis. The proposed model can better resolve the uncertainty in data analysis and the results that are obtained are more accurate.
3 Methodology
3.1 Materials and Methods
In actual scenarios, the relationship between the connotation and extension of concepts is mostly fuzzy and uncertain. For example, in the concept of “young people with a high level of consumption”, “young people” is the denotation (object), and the people of the age to which youth refers form a fuzzy set. In addition, a “high level of consumption” is a connotation (attribute), which involves income, clothing, food, housing, transportation, entertainment and other factors. It can only be expressed by a degree of membership. Therefore, it is necessary to extend the concept lattice using fuzzy sets. The relevant definitions are as follows [40, 51,52,53]:
Definition 1
A formal context is a triple \(K(U,A,I)\). \(U = \left\{ {x_{1} ,x_{2} , \ldots ,x_{n} } \right\}\) is an object set, and each \(x_{i} (i \le n)\) represents an object. \(A = \left\{ {a_{1} ,a_{2} , \ldots ,a_{m} } \right\}\) is an attribute set, and each \(a_{i} (i \le m)\) represents an attribute. \(I\) is the binary relationship between \(U\) and \(A\), where \(I \subseteq U \times A\). If \((x,a) \in I\), it means that object \(x\) possesses attribute \(a\), i.e., \(xIa\).
If 1 represents \((x,a) \in I\) and 0 represents \((x,a) \notin I\), the formal context can be expressed as a table in which all the entries are either 0 and or 1.
Definition 2
Let \(K(U,A,I)\) be a formal context. The operations on the object set \(X \subseteq U\) and attribute set \(B \subseteq A\) can be defined as follows:
If a binary group \((X,B)\) satisfies \(X^{ * } = B\) and \(B^{ * } = X\), then \((X,B)\) is a formal concept, or simply a concept. The extension and connotation are denoted by \(X\) and \(B\), respectively.
Definition 3
Let \(K(U,A,I)\) be the formal context, and \((X_{1} ,B_{1} )\) and \((X_{2} ,B_{2} )\) be two concepts.
In this case, the relationship between \((X_{2} ,B_{2} )\) and \((X_{1} ,B_{1} )\) is that between a super-concept and sub-concept. The partially ordered set of all concepts of \((U,A,I)\) is denoted as \(L(U,A,I)\) and is called the concept lattice.
Definition 4
Each finite partially ordered set \((S, \le )\) can be represented by a Hasse diagram (partially ordered set diagram). The Hasse diagram can make the conceptual structure of a given data context clear and easy to understand by realizing the visual representation of lattices.
A circle “\(\circ\)“ in a Hasse diagram represents a node, and each node represents an element (concept). If \(x,y \in M\) satisfies \(x < y\), then the corresponding circle of element \(y\) should be drawn on the corresponding circle of element \(x\). If \(x < y\) and there is no z that satisfies \(x < z < y\), then \(y\) overrides \(x\) and a line segment can be used to connect the two circles. In addition, non-comparable elements can be drawn on the same layer.
Theorem 1
The binary relation \(I\) describes a fuzzy relation between objects and attributes, which can be expressed by a membership function.
The weight factor of an event is calculated using DEMATEL [54].
-
Step 1: Determine the set of the system’s influencing factors \(F = \left( {F_{1} ,F_{2} , \ldots ,F_{n} } \right)\).
-
Step 2: Establish the direct-relation matrix \(Y\).
According to the relationship between the influencing factors, integer numbers from 0 to 4 are used by decision-makers to score the factors. Within these integers, 0 represents no influence between two factors, 1 represents a low influence, 2 represents a moderate influence, 3 represents a high influence, and 4 represents an extremely high influence. In this way, an \(n \times n\) direct-relation matrix \(Y\) can be obtained:
$$Y = \left[ {\begin{array}{*{20}c} 0 & {y_{12} } & \cdots & {y_{1j} } & \cdots & {y_{1n} } \\ {y_{21} } & 0 & \cdots & {y_{2j} } & \cdots & {y_{2n} } \\ \cdots & \cdots & \cdots & \cdots & \cdots & \cdots \\ {y_{i1} } & {y_{i2} } & \cdots & 0 & \cdots & {y_{in} } \\ \cdots & \cdots & \cdots & \cdots & \cdots & \cdots \\ {y_{n1} } & {y_{n1} } & \cdots & {y_{nj} } & \cdots & 0 \\ \end{array} } \right]$$(4)where \(y_{ij}\) represents the influence of the ith criterion on the jth criterion.
-
Step 3: Establish the normalized direct-relation matrix \(X\).
The normalized matrix \(X\) with a value range from 0 to 1 for each element can be obtained by Eq. (5):
$$X = k \cdot Y,$$(5)where \(k = \frac{1}{{\mathop {\hbox{max} }\limits_{1 \le i \le n} \left( {\sum\nolimits_{j = 1}^{n} {y_{ij} } } \right)}},i,j = 1,2, \ldots ,n.\)
-
Step 4: Establish the total-relational matrix \(T\).
The total-relational matrix \(T\) can be obtained by Eq. (6).
$$T = \left[ {t_{ij} } \right]_{n \times n} = X + X^{2} + X^{3} + \ldots + X^{k} \left( {i,j = 1,2, \ldots ,n} \right)$$(6)where \(t_{ij}\) represents the indirect influence of the ith criterion on the jth criterion.
After the reduction operation, we obtain the following:
$$\begin{aligned} T = X + X^{2} + X^{3} + \cdots + X^{k} \hfill \\ { = }X\left( {E + X + X^{2} + X^{3} + \cdots + X^{k - 1} } \right)\left[ {\left( {E - X} \right)\left( {E - X} \right)^{ - 1} } \right] \hfill \\ { = }X\left( {E - X^{k} } \right)\left( {E - X} \right)^{ - 1} . \hfill \\ \end{aligned}$$Then,\(T = X\left( {E - X} \right)^{ - 1} E\), when \(k \to \infty ,X^{k} = \left[ 0 \right]_{n \times n}\).
Hence, \(T\) can be represented as Eq. (7):
$$T = X\left( {E - X} \right)^{ - 1}$$(7)where \(E\) is the unit matrix.
-
Step 5: Calculate the respective sums of the rows and columns of \(T\).
The row sum is calculated by Eq. (8):
$$D_{i} = \left[ {\sum\limits_{j = 1}^{n} {t_{ij} } } \right]_{n \times 1} = \left[ {t_{i} } \right]_{n \times 1} ,i = 1,2, \ldots ,n$$(8)The column sum is calculated by Eq. (9):
$$R_{j} = \left[ {\sum\limits_{i = 1}^{n} {t_{ij} } } \right]_{1 \times n} = \left[ {t_{j} } \right]_{1 \times n} ,j = 1,2, \ldots ,n.$$(9) -
Step 6: Construct the causal diagram.
The interactions of criteria can be viewed as a causal diagram, which takes \(\left( {D + R} \right)\) as the horizontal axis and \(\left( {D - R} \right)\) as the vertical axis. The data in the diagram above the horizontal axis are classified as the causal group, and those below are the effect group.
-
Step 7: Calculate the criteria weights.
The criteria weights can be calculated using \(\left( {D + R} \right)\) in Eq. (10), as follows:
$$\omega_{p} = \frac{{\left( {D + R} \right)_{p} }}{{\sum\nolimits_{p = 1}^{n} {\left( {D + R} \right)_{p} } }}.$$(10)
3.2 Proposed Method
With a set of known events, the specific steps to diagnose what happened are as follows:
-
Step 1: Collect information to construct the fuzzy formal context \(K_{1} (U,A,I)\) of a known event and present the data in tables.
-
Step 2: Process the data before establishing the fuzzy concept lattice using Eq. (11):
$$I_{\theta } \left( {u,a} \right) = \left\{ {\begin{array}{ll} {I\left( {u,a} \right), \, if \, I\left( {u,a} \right) \ge \theta \varphi_{ai} } \\ {0, \, if \, I\left( {u,a} \right) < \theta \varphi_{ai} } \\ \end{array} } \right\}$$(11)where \(\theta\) is a constant between 0 and 1. Let \(\varphi_{ai}\) denote the average value of the attributes in each column [59].
-
Step 3: Establish the fuzzy concept lattice \(L_{1}\) of a known event.
In each column of the fuzzy formal context table, attributes with values greater than \(\theta \varphi_{\text{ai}}\) keep their original values, indicated in bold; otherwise, they are changed to 0. Next, by selecting the attribute values greater than \(\theta \varphi_{\text{ai}}\), a fuzzy concept lattice \(L_{1}\) composed of the corresponding objects can be constructed, and the Hasse diagram is drawn.
-
Step 4: Construct the fuzzy formal context \(K_{2} (U,A,I)\) of the occurrent events and process the data using Eq. (4). The fuzzy concept lattice \(L_{2}\) of the occurrent events can be obtained.
-
Step 5: Calculate the weight factor of the events using DEMATEL [54] with Eqs. (4)–(10).
-
Step 6: Calculate the similarity between \(C_{i}\) of \(L_{1}\) and the concepts in each layer of \(L_{2}\).
\(C_{1} \left( {U_{1} ,A_{1} } \right)\) and \(C_{2} \left( {U_{2} ,A_{2} } \right)\) are two concepts in the different fuzzy formal contexts of known and occurrent events, respectively. Next, use the following:
$$r = \hbox{max} \left( {\left| {U_{1} } \right|,\left| {U_{2} } \right|} \right),$$(12)$$m = \hbox{max} \left( {\left| {A_{1} } \right|,\left| {A_{2} } \right|} \right).$$(13)Then, the similarity between them can be calculated by Eq. (14) [53]:
$${\text{Sim}}\left( {C_{1} ,C_{2} } \right) = \left\{ {\begin{array}{*{20}c} {\frac{{\left| {U_{1} \cap U_{2} } \right|}}{r} \times \omega + \frac{{\left| {U_{1} \cap U_{2} } \right|}}{r} \times \frac{{\left| {A_{1} \cap A_{2} } \right|}}{m} \times \left( {1 - 2\omega } \right) + \frac{{\left| {A_{1} \cap A_{2} } \right|}}{m} \times \omega , \, U_{1} \cap U_{2} \ne \emptyset } \\ {0, \, U_{1} \cap U_{2} = \emptyset } \\ \end{array} } \right..$$(14) -
Step 7: Calculate the similarity between concepts and the concept lattice.
The concept with the maximum similarity in the layer is selected to be a set \(R\). The similarity between concepts \(C_{i}\) and concept lattice \(L_{2}\) is calculated by Eq. (15):
$${\text{Sim}}\left( {C_{i} ,L_{2} } \right) = \frac{{\sum\limits_{{C_{k} \in R}} {{\text{Sim}}\left( {C_{i} ,C_{k} } \right)} }}{{n_{1} }}$$(15)where \(n_{1}\) is the number of concepts in \(R\).
-
Step 8: Calculate the similarity between concept lattices.
The similarity between \(L_{1}\) and \(L_{2}\) is calculated by Eq. (16):
$$Sim\left( {L_{1} ,L_{2} } \right) = \frac{{\sum\limits_{{C_{i} \in L_{1} }} {Sim\left( {C_{i} ,L_{2} } \right)} }}{{n_{2} }}$$(16)where \(n_{2}\) is the number of concepts in \(L_{1}\).
-
Step 9: Diagnose the occurrent event.
In the calculation results, the event whose concept lattice has the greatest similarity to the concept lattice of occurrent events is selected for making a diagnosis.
The structure for the proposed model is shown in Fig. 2.
Fig. 2 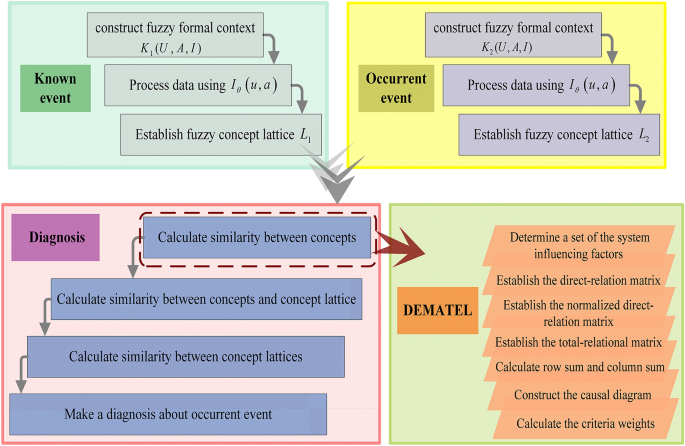
The structure of the proposed model

4 Numerical Study
In this section, the ventilators in each of the departments of a hospital in Xi’an are used as an example to analyse the proposed method. Four parts are considered: the transmissions (\(F_{1}\)), device components (\(F_{2}\)), connectors (\(F_{3}\)) and devices (\(F_{4}\)). After collecting the first 3 years of historical records and relevant information about the ventilator faults, the known fault types can be roughly divided into two categories: mechanical faults and electrical circuit faults. The specific types are shown in Table 1.
4.1 Illustrative Example
When the formal context of fault diagnosis \(K(U,A,I)\) is constructed, the object set \(U\) is used to represent the set of specific fault types, and the attribute set \(A\) is used to represent the extent of the faults, such as their frequency and severity. The binary relationship \(I\) is the membership function of both (Figs. 3, 4).

The fuzzy concept lattice \(L_{1} (U,A,I)\) of mechanical faults

The fuzzy concept lattice \(L_{2} (U,A,I)\) of electrical circuit faults
-
Step 1: According to the historical repair records, the fuzzy formal contexts of the two fault types are constructed as shown in Tables 2 and 3.
Table 2 Fuzzy formal context \(K_{1} (U,A,I)\) of mechanical faults Table 3 Fuzzy formal context \(K_{2} (U,A,I)\) of electrical circuit faults -
Step 2: Process the data using Eq. (4). The results are shown in Tables 2 and 3.
-
Step 3: Establish the fuzzy concept lattices to draw the Hasse diagrams as follows:
-
Step 4: Construct the fuzzy formal context \(K_{3} (U,A,I)\) and fuzzy concept lattice \(L_{3} (U,A,I)\) of the occurrent faults.
Taking the ventilators with no response and alarm sound, as an example \(K_{3} (U,A,I)\) is constructed according to the occurrent performance and is shown in Table 4.
Table 4 Fuzzy formal context \(K_{3} (U,A,I)\) of occurrent faults Then, the Hasse diagram can be drawn as in Figs. 5 and 6.
Fig. 5 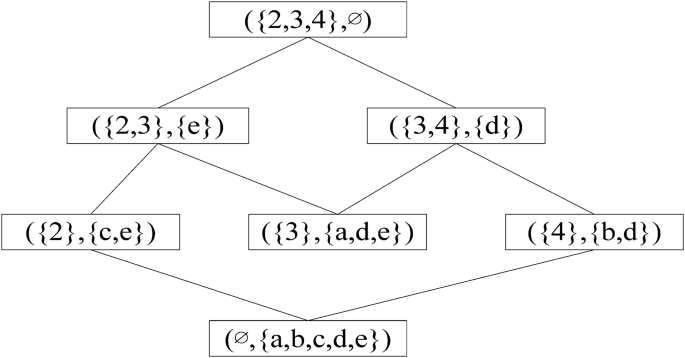
The fuzzy concept lattice \(L_{3} (U,A,I)\) of occurrent faults
Fig. 6 
Causal diagram of faults
-
Step 5: Establish the direct-relation matrix \(Y\).
The scores of the four faults that are given by the decision-makers are as follows.
$$Y = \left[ {\begin{array}{*{20}c} 0 & 3 & 3 & 2 \\ 2 & 0 & 2 & 1 \\ 4 & 4 & 0 & 3 \\ 3 & 0 & 2 & 0 \\ \end{array} } \right]$$ -
Step 6: Establish the normalized direct-relation matrix \(X\) using Eq. (5).
$$k = 0.091$$$$X = \left[ {\begin{array}{*{20}c} 0 & {0.273} & {0.273} & {0.182} \\ {0.182} & 0 & {0.182} & {0.091} \\ {0.364} & {0.364} & 0 & {0.273} \\ {0.273} & {0.273} & {0.182} & 0 \\ \end{array} } \right]$$ -
Step 7: Establish the total-relational matrix \(T\) using Eqs. (6)–(7).
$$T = \left[ {\begin{array}{*{20}c} {0.464} & {0.618} & {0.600} & {0.486} \\ {0.473} & {0.282} & {0.420} & {0.317} \\ {0.856} & {0.776} & {0.490} & {0.633} \\ {0.555} & {0.310} & {0.435} & {0.248} \\ \end{array} } \right]$$ -
Step 8: Calculate the \(D_{i}\) and \(R_{j}\) of \(T\), respectively.
The results that are calculated using Eq. (8) and Eq. (9) are shown in Tables 5 and 6, respectively.
Table 5 Computations of the row sum and column sum Table 6 The causal relationships of faults -
Step 9: Construct the causal diagram.
-
Step 10: Calculate the weight of each fault using Eq. (10) (Tables 7, 8, 9).
Table 7 The weight of each fault Table 8 The similarity between the concepts of \(L_{3} (U,A,I)\) and the concepts of \(L_{1} (U,A,I)\) Table 9 The similarity between the concepts of \(L_{3} (U,A,I)\) and the concepts of \(L_{2} (U,A,I)\) -
Step 11: Calculate the similarity between the concepts of \(L_{3} (U,A,I)\) and the concepts of \(L_{1} (U,A,I)\) and \(L_{2} (U,A,I)\) using Eq. (14).
As seen from Eq. (14), if the intersection of the object sets is empty, the similarity is 0. Therefore, the case in which the object sets do not intersect will not be shown in the following table. The corresponding weight \(\omega_{p}\) depends on the intersection of the object sets.
-
Step 12: Calculate the similarity between the concepts of \(L_{3} (U,A,I)\) and the concepts of \(L_{1} (U,A,I)\) and \(L_{2} (U,A,I)\) using Eq. (15). The results are shown in Tables 10 and 11, respectively.
Table 10 The similarity between the concepts of \(L_{3} (U,A,I)\) and \(L_{1} (U,A,I)\) Table 11 The similarity between the concepts of \(L_{3} (U,A,I)\) and \(L_{2} (U,A,I)\) -
Step 13: Calculate the similarity between the concepts of \(L_{3} (U,A,I)\) and the concepts of \(L_{1} (U,A,I)\) and \(L_{2} (U,A,I)\) using Eq. (16).
$$Sim\left( {L_{1} ,L_{3} } \right) = \frac{0.2023 + 0.4809 + 0.327 + 0.5396 + 0.1523}{5} = 0.3404$$$$Sim\left( {L_{2} ,L_{3} } \right) = \frac{0.7038 + 0.2329 + 0.4146 + 0.2346 + 0.6758}{5} = 0.4523$$ -
Step 14: Diagnose the occurrent ventilator faults.
\({\text{Sim}}\left( {L_{1} ,L_{3} } \right) < {\text{Sim}}\left( {L_{2} ,L_{3} } \right)\) can be obtained based on the above results. Therefore, the occurrent faults of the ventilators are electrical circuit faults.


In the above calculation process, the fault with the greatest similarity is the recommended result of intelligent diagnosis. The clear comparison result (0.4523 > 0.3404) obtained by the fuzzy concept lattice accelerates the process of diagnosis. In the real world, experts have the advantage of rich experience and distinctive creative thinking. However, the application of intelligent diagnosis can improve the accuracy of the whole process.
4.2 Numerical Evaluation
The historical records of ventilator faults collected in the first 3 years of the hospital are evaluated as case data, including 112 cases of mechanical faults and 87 cases of electrical circuit faults. The fault data of each case contain the specific representations needed to construct the fuzzy concept lattice. The above calculation steps are used to calculate the sample data. In practice, there will second round of diagnosis and maintenance if the first diagnosis is not accurate. Therefore, the accuracy of the first diagnosis and the average running time are taken as the criteria to compare the experimental results with the actual diagnosis results. Table 12 shows the diagnosis results of the actual and proposed methods.
There is a difference of 0.9% and 4.6% in the diagnosis rate between the two methods. Although the difference is small, the diagnosis rate of the proposed method is higher than that of the actual method. In addition, it is obvious that the proposed method has a shorter running time than the actual diagnosis method. In real applications, this saves time in diagnosis, improves the timeless of maintenance and can also reduce the phenomenon of service faults due to device faults.
5 Comparative Analysis
In this section, the advantages are highlighted by comparing the results of the proposed method, a typical three-layer back propagation neural network (BPNN) and fuzzy fault tree analysis. The fault data of ventilators in the hospital in the first half of 2019 are analysed and the results are shown in Tables 13 and 14.
The structure of the BPNN used for comparison is set as follows:
-
Setting 1: The number of neurons used for input is set to 8 because there are 8 specific fault types that are mentioned in Sect. 4.
-
Setting 2: According to Kolmogorov’s theorem, if there are \(n\) neurons in the input layer, then there are \(2n + 1\) neurons in the hidden layer [55]. Therefore, this paper sets 17 neurons in the hidden layer.
-
Setting 3: The output result is a mechanical fault or electrical circuit fault, so there are 2 neurons in the output layer.
-
Setting 4: The training data are from the first 3 years of historical records and the relevant information about the ventilator faults of the abovementioned hospital in Xi’an.
As seen from Table 13, the results obtained by the three methods are very similar, which proves that the proposed method is feasible and reasonable. The differences in Table 14 are as follows:
-
(1)
Compared with the BPNN, the proposed method has certain advantages in terms of diagnosis rate and running time. The structure of the BPNN will be more complicated if there is too much input information. The training time and costs will also greatly increase and may even reduce the performance of the network. Nevertheless, the proposed method based on the fuzzy concept lattice in this paper has powerful classification and analysis functions that can obtain results more accurately and rapidly; thus, preventative measures can be quickly taken in response to the faults that occurred.
-
(2)
The evaluation of the performance of the fuzzy fault tree and the proposed method shows that they are basically similar. However, in real scenarios, the high accuracy of the fuzzy fault mechanism required by fault tree cannot be achieved. In addition, fuzzy fault tree generally does not describe the fault degree. However, the numerical values are all represented in this paper. With the whole fault diagnosis system, the information obtained by the proposed method can be more comprehensive than that obtained by the fuzzy fault tree and the results can be more accurate.
In addition, it is necessary to compare the existing methods of medical device fault diagnosis to further demonstrate the improvement from the proposed method. The two models are chosen from two papers of Zhang et al., and they effectively diagnosed faults using a hidden Markov model (HMM) in 2016 [10] and a Bayesian network model in 2018 [6]. However, the two models do not fully consider the correlation between the observed objects due to independence. The proposed model in this paper can more accurately describe the relationship between objects, but there are still some limitations. There are many ways to construct a concept lattice, and the results of different methods may be different. Therefore, the results in this paper only represent the proposed method, which means that they are not comprehensive.
6 Managerial Insights
-
(1)
Maintain medical devices regularly on a planned schedule
The operating state of a device should be tested periodically. If the device is found to have potential problems, the hospital must immediately take measures to address it. This also sets higher requirements for engineers, who need to be proficient in the structure and working principle of the device. They should have rich experience and proficient operation skills.
-
(2)
Establish a fault information database of medical devices
Fault information resource databases can strengthen the collection, classification, analysis and utilization of medical device fault information so that device maintenance is carried out more smoothly and has a greater effect. A database can not only quickly train excellent maintenance engineers, but also improve digital construction and promote medical device maintenance communication, resource sharing, feedback and so on.
-
(3)
Ensure detailed device management
Informationization is widely used in the medical industry. In current medical device maintenance management, maintenance personnel not only need to have comprehensive technology maintenance skills but should also keep a record of related device maintenance management work. Maintenance files can be established to better grasp the situation of devices and solve the fault in a timely manner. Maintenance records require technicians to register the work on each device in detail and to classify and manage medical devices.
-
(4)
Increase the capital investment in medical devices and improve maintenance quality
The maintenance of medical devices is strongly technical work, and the means of maintenance are complex. The personnel of the device management department can express the latest ideas to hospital management to increase the capital investment in medical devices and improve management ability. The comprehensive quality of maintenance personnel should also be increased to ensure the quality of device maintenance.
-
(5)
Improve the quality of medical device management personnel
The relevant departments need to build a team of high-quality talent and hire managers with higher professional quality who are required to have maintenance and management experience with medical devices and to master advanced work skills. At the same time, it is necessary to conduct periodic training for staff so that they can master all kinds of advanced technologies and find faults and problems in medical devices in a timely manner.
7 Conclusions
In the context of the rapid development of modern medical devices, the maintenance, control and testing of medical devices have become increasingly crucial. These measures are also of great significance for clinical diagnosis and treatment. Improving the efficiency and accuracy of medical device fault diagnosis can improve the ability of technical personnel to address faults and promote the overall performance of the whole hospital. This paper provides a scientific and effective method for medical device fault diagnosis that uses a novel decision-making method based on the DEMATEL-fuzzy concept lattice. The conclusions of this study are as follows:
-
(1)
The concept lattice clearly describes the association between objects and attributes. The fault types are considered as the objects, and the frequency and severity of faults are considered as the attributes for the research in this paper.
-
(2)
The generated Hasse diagram directly reflects the reasoning process. The construction and application of the concept lattice based on medical device fault diagnosis are more intuitive and concise than general diagnosis decision-making.
-
(3)
In an uncertain environment, adding fuzzy set elements in the research can better address the problem of uncertainty in the concept description.
-
(4)
In fuzzy decision-making methods, DEMATEL is more suitable for a system with uncertain relations amongst its factors. Using the DEMATEL method to determine the weight factor can eliminate the subjectivity problem in the calculation process and make the result more accurate.
-
(5)
The ventilator is taken as an example to explain the specific operation of the proposed model in a case study.
-
(6)
The proposed method in this paper is compared with a BPNN, a fuzzy fault tree and other existing methods of medical device fault diagnosis. The results verify the effectiveness of the proposed method. Moreover, the differences between the different methods are illustrated through a process comparison to highlight the advantages of the proposed method.
As a future research direction, the proposed method can be further extended to establish a concept lattice of more specific faults to analyse and diagnose occurrent faults in a more specific and detailed way. In addition, in a case in which the data scale is large and there are many core attributes, the layout optimization of the Hasse diagram becomes a major point to be solved in the study. In the existing research on concept lattices, attribute reduction is also widely used. When attribute reduction is applied in the fault diagnosis of medical devices, it can delete redundant attributes and simplify diagnostic rules, which can be used for more test samples.
References
Wang, Y., Kung, L., Byrd, T.A.: Big data analytics: understanding its capabilities and potential benefits for healthcare organizations. Technol. Forecast. Soc. Chang. 126, 3–13 (2018)
Agha, R.A., Fowler, A.J., Saeta, A., Barai, I., Rajmohan, S., Orgill, D.P., Aronson, J., et al.: The SCARE statement: consensus-based surgical case report guidelines. Int. J. Surg. 34, 180–186 (2016)
Tiryakioglu, B., Kayakutlu, G., Duzdar, I. Medical device tracking via QR code and efficiency analyze. Portland International Conference on Management of Engineering and Technology. IEEE, 2016, 3115-3128
Zeng, X.N., Shao, L., Xue, H.: Study on the fast locating technology of telemedicine device fault. China Med. Dev. 32(5), 64–67 (2017)
Wang, X., Wang, J., Privault, M.: Artificial intelligent fault diagnosis system of complex electronic device. J. Intel. Fuzzy Syst. 1, 1–11 (2018)
Zhang, H., Liu, J., Kato, N.: Threshold tuning-based wearable sensor fault detection for reliable medical monitoring using Bayesian network model. IEEE Syst. J. 12(2), 1886–1896 (2018)
Lyons, I., Blandford, A.: Safer healthcare at home: detecting, correcting and learning from incidents involving infusion devices. Appl. Ergon. 67, 104–114 (2018)
Firouzi, F., Rahmani, A.M., Mankodiya, K., Badaroglu, M., Farahani, B.: Internet-of-things and big data for smarter healthcare: from device to architecture, applications and analytics. Fut. Gen. Comput. Syst. 2017(78), 583–586 (2018)
Resnic, F.S., Majithia, A., Marinac-Dabic, D., Robbins, S., Ssemaganda, H., Hewitt, K., Normand, S.L.: Registry-based prospective, active surveillance of medical-device safety. N. Engl. J. Med. 376(6), 526–535 (2017)
Zhang, H., Liu, J., Li, R., Le, H.: Fault diagnosis of body sensor networks using hidden Markov model. Peer-to-Peer Netw. Appl. 10(6), 1285–1298 (2016)
AbdElfattah, E., Elkawkagy, M., El-Sisi, A. A reactive fault tolerance approach for cloud computing. International Computer Engineering Conference (ICENCO), IEEE. 2017, 13, 190-194
Tang, Y., Wang, C., Wang, M., Hao, H., Zhao, J. Based on self-learning dictionary circuit board fault diagnosis device. Advanced Information Technology, Electronic and Automation Control Conference (IAEAC), IEEE. 2017, 2, 2653-2657
Jansen, C., Schollmeyer, G., Augustin, T.: Concepts for decision making under severe uncertainty with partial ordinal and partial cardinal preferences. Int. J. Approx. Reason. 98, 112–131 (2018)
Spruyt, B., van Noll, J., van Bossche, L.: Meaning matters. An empirical analysis into public denotations of the label ‘strangers’ and their relationship with general ethnic prejudice. Int. J. Intercult. Relat. 51, 41–53 (2016)
Mashkoor, A., Biro, M.: Towards the trustworthy development of active medical devices: a hemodialysis case study. IEEE Embed. Syst. Lett. 8(1), 14–17 (2015)
Yang, H.C., See, K.Y., Simanjorang, R., Li, K.R.: Offline health diagnosis of power device based on non-intrusive inductively coupled approach. IEEE Journal of Emerging and Selected Topics in Power Electronics 6(4), 2053–2059 (2018)
Lei, Y., Jia, F., Lin, J., Xing, S., Ding, S.: An intelligent fault diagnosis method using unsupervised feature learning towards mechanical big data. IEEE Trans. Industr. Electron. 63(5), 3137–3147 (2016)
Kohani, M., Pecht, M.: Malfunctions of medical devices due to electrostatic occurrences big data analysis of 10 years of the FDA’s reports. IEEE Access 6, 5805–5811 (2018)
Li, W.H., Zhu, C.J.: Research on development trend of data analysis and decision making for hospital facility operation and maintenance. Chin. Hosp. Manag. 38(5), 78–80 (2018)
Li, K.L., Gao, H., Xu, Y.X., Qi, D., Zhang, H., Qian, Y.: Design and application of medical device maintenance management system based on ERP. China Med. Dev. 33(1), 120–122 (2018)
Yang, S.S., Lam, B. H., Ng, C. M. Digital Sampling Technique in the Calibration of Medical Testing Device with Arbitrary Waveforms. IEEE International Symposium on Medical Measurements and Applications (MeMeA), 2018, 1-6
Kaspi, M., Raviv, T., Tzur, M.: Detection of unusable bicycles in bike-sharing systems. Omega 65, 10–16 (2015)
Xiang, J., Zhong, Y.: A novel personalized diagnosis methodology using numerical simulation and an intelligent method to detect faults in a shaft. Appl. Sci. 6(12), 1–19 (2016)
Hazra, A., Das, S., Basu, M.: An efficient fault diagnosis method for PV systems following string current. J. Clean. Prod. 154, 220–232 (2017)
Yang, R., Xiong, R., He, H., Chen, Z.: A fractional-order model-based battery external short circuit fault diagnosis approach for all-climate electric vehicles application. J. Clean. Prod. 187, 950–959 (2018)
Kaid, I.E., Hafaifa, A., Guemana, M., Hadroug, N., Kouzou, A., Mazouz, L.: Photovoltaic system failure diagnosis based on adaptive neuro fuzzy inference approach: South Algeria solar power plant. J. Clean. Prod. 204, 169–182 (2018)
Waseem, A.M., Jonathan, R., Yacine, R.: Predictive modelling for solar thermal energy systems: a comparison of support vector regression, random forest, extra trees and regression trees. J. Clean. Prod. 203, 810–821 (2018)
Yang, Z., Chen, J., Tang, L.T., Wei, X.Q.: System automatic fault diagnosis method based on fuzzy FMEA analysis. Power Syst. Prot. Control 12, 148–153 (2017)
Qiao, Z., Lei, Y., Lin, J., Jia, F.: An adaptive unsaturated bistable stochastic resonance method and its application in mechanical fault diagnosis. Mech. Syst. Sign. Process. 84, 731–746 (2017)
Torkaman, H., Moradi, R., Hajihosseinlu, A., Toulabi, M.S.: A comprehensive power loss evaluation for switched reluctance motor in presence of rotor asymmetry rotation: theory, numerical analysis and experiments. Energy Convers. Manage. 77, 773–783 (2014)
Rehman, H.U., Hirvonen, J., Sirén, K.: Influence of technical failures on the performance of an optimized community-size solar heating system in Nordic conditions. J. Clean. Prod. 175, 624–640 (2018)
Ates, Y., Uzunoglu, M., Karakas, A., Boynuegri, A.R., Nadar, A., Dag, B.: Implementation of adaptive relay coordination in distribution systems including distributed generation. J. Clean. Prod. 112, 2697–2705 (2016)
Wille, R.: Restructuring lattice theory: an approach based on hierarchies of concepts. Orderd Sets D Reidel 83, 314–339 (1982)
Hao, F., Min, G., Pei, Z., Park, D.S., Yang, L.T.: K-clique community detection in social networks based on formal concept analysis. IEEE Syst. J. 11(1), 250–259 (2017)
Singh, P.K., Kumar, C.A., Gani, A.: A comprehensive survey on formal concept analysis, its research trends and applications. Int. J. Appl. Math. Comput. Sci. 26(2), 495–516 (2016)
Fkih, F., Omri, M.N.: IRAFCA: an O(n) information retrieval algorithm based on formal concept analysis. Knowl. Inf. Syst. 48(2), 465–491 (2016)
Jenett, B., Calisch, S., Cellucci, D., Cramer, N., Gershenfeld, N., Swei, S., Cheung, K.C.: Digital morphing wing: active wing shaping concept using composite lattice-based cellular structures. Soft Robot. 4(1), 33–48 (2017)
Sun, X., Liu, X., Li, B., Duan, Y., Yang, H., Hu, J. Exploring topic models in software engineering data analysis: A survey. ACIS International Conference on Software Engineering, Artificial Intelligence, Networking and Parallel/Distributed Computing (SNPD). IEEE, 2016, 357-362
Valverde-Albacete, F.J., González-Calabozo, J.M., Penas, A., Pelaez-Moreno, C.: Supporting scientific knowledge discovery with extended, generalized Formal Concept Analysis. Expert Syst. Appl. 44, 198–216 (2016)
Singh, P.K., Aswani Kumar, C., Li, J.: Knowledge representation using interval-valued fuzzy formal concept lattice. Soft. Comput. 20(4), 1485–1502 (2016)
De Maio, C., Fenza, G., Loia, V., Orciuoli, F.: Distributed online temporal fuzzy concept analysis for stream processing in smart cities. J. Paral. Distrib. Comput. 110, 31–41 (2017)
Wang, Z., Xu, G., Ren, J., Li, Z., Zhang, B., Ren, X.: Polygeneration system and sustainability: multi-attribute decision-support framework for comprehensive assessment under uncertainties. J. Clean. Prod. 167, 1122–1137 (2017)
Chatterjee, K., Pamucar, D., Zavadskas, E.K.: Evaluating the performance of suppliers based on using the R'AMATEL-MAIRCA method for green supply chain implementation in electronics industry. J. Clean. Prod. 184, 101–129 (2018)
Tian, G., Zhang, H., Feng, Y., Jia, H., Zhang, C., Jiang, Z., et al.: Operation patterns analysis of automotive components remanufacturing industry development in china. J. Clean. Prod. 164, 1363–1375 (2017)
Fontela, E., André, G.: DEMATEL: progress achieved. Futures 6(4), 361–363 (1974)
Wang, Z., Ren, J., Goodsite, M.E., Xu, G.: Waste-to-energy, municipal solid waste treatment, and best available technology: comprehensive evaluation by an interval-valued fuzzy multi-criteria decision-making method. J. Clean. Prod. 172, 887–899 (2018)
Büyüközkan, G., Güleryüz, S., Karpak, B.: A new combined IF-DEMATEL and IF-ANP approach for CRM partner evaluation. Int. J. Prod. Econ. 191, 194–206 (2017)
Zhou, F., Wang, X., Lim, M.K., He, Y., Li, L.: Sustainable recycling partner selection using fuzzy DEMATEL-AEW-FVIKOR: a case study in small-and-medium enterprises (SMEs). J. Clean. Prod. 196, 489–504 (2018)
Si, S.L., You, X.Y., Liu, H.C., Huang, J.: Identifying key performance indicators for holistic hospital management with a modified DEMATEL approach. Int. J. Environ. Res. Public Health 14(8), 1–17 (2017)
Liou, J., Lu, M.T., Hu, S.K., Cheng, C.H., Chuang, Y.C.: A hybrid MCDM model for improving the electronic health record to better serve client needs. Sustainability 9(10), 1–13 (2017)
Shen, X.T., Ye, M.M., Gan, T., Han, D.J., Han, D.J.: Information retrieval based on concept lattice and its tree visualization. Comput. Eng. Appl. 53(3), 95–99 (2017)
Dias, S.M., Vieira, N.J.: A methodology for analysis of concept lattice reduction. Inf. Sci. 396, 202–217 (2017)
Zou, C., Deng, H.: Using fuzzy concept lattice for intelligent disease diagnosis. IEEE Access 5, 236–242 (2017)
Yazdani, M., Chatterjee, P., Zavadskas, E.K., Zolfani, S.H.: Integrated QFD-MCDM framework for green supplier selection. J. Clean. Prod. 142, 3728–3740 (2017)
Xiang, Z.H., Li, Z., Li, J.: Diagnosis model and primary and secondary element analysis of nephritis based on BP neural network. Softw. Guide 15(2), 126–129 (2016)
Acknowledgements
The study was supported by “Shaanxi Natural Science Foundation Project” (2017JM7004), “Fundamental Research Funds for the Central Universities” (JB190606), “The discipline promotion project of the First Affiliated Hospital of Air Force Medical University” (XJZT18MJ49), “Major Theoretical and Practical Research Projects of Social Science in Shaanxi province” (2019C068).
Author information
Authors and Affiliations
Corresponding author
Ethics declarations
Conflicts of interest
The authors declare no conflict of interest.
Rights and permissions
About this article

Cite this article
Guo, X., Liu, A., Li, X. et al. Research on the Intelligent Fault Diagnosis of Medical Devices Based on a DEMATEL-Fuzzy Concept Lattice. Int. J. Fuzzy Syst. 22, 2369–2384 (2020). https://doi.org/10.1007/s40815-020-00859-0
Received:
Revised:
Accepted:
Published:
Issue Date:
DOI: https://doi.org/10.1007/s40815-020-00859-0