
Abstract
Due to deficient water resources in the Loess Plateau, watershed management plays a very important role, not only for ecological and environmental protection but also for the social development of the region. To better understand the hydrological and water resource variations in the typical watershed of the Loess Plateau and the Qinghe River Basin, the influences of land cover and climate change were analysed, and a SWAT model was built to simulate the response of the hydrological situation to land cover changes that have occurred over the past 30 years. The results demonstrated that the main land cover change occurring in the Qinghe River Basin was the conversion of land cover from grassland to woodland and farmland from the late 1980s to 2010. Woodland and farmland took 87.36 and 10.55%, respectively, from the overall area transferred over 20 years and more than 18% of the total watershed area. Hydrological simulation results indicated that land cover played a predominant role in the hydrological variation of the Qinghe River Basin, although the effects of climate change should not be discounted. The significant changes in land cover could be superimposed by policy orientation and economic requirements. Although it is hard to evaluate the land cover changes and the corresponding hydrological responses in a simple language, related analyses have demonstrated an increasing trend of runoff in the dry season, while there is a somewhat decreasing trend during the flood season in the river basin. There results could be significant and provide a positive influence on both future flood control and the conservation of water and soil.
Introduction
The Loess Plateau is located in north central China, covering a total area of more than 640,000 km2, with crisscrossing ravines and gullies. The ecological environment in the Loess Plateau is relatively fragile with serious soil and water loss problems. It is estimated that more than 70% of the area suffers from serious soil erosion (Tang 2004). The Loess Tableland Area lies on the south margin of the Loess Plateau, adjacent to the Central Shaanxi Plain in the south. According to historical data, there once was a vast loess terrace here, covered with thick vegetation. Unfortunately, due to the adverse effect of an unconscionable mode of production over the past hundreds of years coupled with the disadvantages of the semiarid climate conditions, the ecosystem and environment have gradually been impaired over time (Li 2016; Li et al. 2014a; Rakhmatullaev et al. 2013; Wang et al. 2015). As a result, a brittle ecotope, serious soil quality deterioration and water resource pollution have developed into significant problems in the loess area and have attracted worldwide attention and concern (Li et al. 2011, 2013a, b, 2014b, c, d, 2016a, b, c; Qian et al. 2012, 2013; Wu et al. 2014a; Wu and Sun 2016).
The regional economy and development have also been severely restricted by sharp contradictions between water resources, the challenges of the ecological environment and the requirements of production. All these problems described in Loess Plateau are primarily water-related and water resource issues (Li 2016; Li et al. 2014e, 2017). During most of the year, it is dry and rainless in the Loess Plateau, with the majority of the annual rainfall occurring as intense rainstorms, unevenly distributed during the flood season (Wu et al. 2014b). Consequently, the soil and water loss is very heavy in the flood season, while the predominant droughts that frequently occur perplex the local residents and government authorities. Furthermore, due to the ongoing global climate change in the past few decades as a result of increasing human activities, both the hydrological and the ecological situations in some areas of the Loess Plateau have deteriorated, triggering additional climate concerns.
Land use and land cover change (LUCC), as a result of human activity, are among the main causes of hydrological and water resource variation, and its effects now extend to whole environment and ecosystem of the watershed (Han et al. 2015). Most of the hydrological elements, including runoff, peak discharge, and flood duration, vary in direct response to changes in the land cover over time. It has been proven that runoff is increased when forest land is converted into farmland or grassland, such that flood volume and peak flow of a storm will cause a flood (DeRoo et al. 2001). However, due to afforestation on Loess Plateau during the last decade, the massive silt loads discharged into the Yellow River have been reduced by approximately one per cent since the turn of the century (World Bank 2006). Some researchers have noted that decreasing crop land and a more rational rearrangement of land use are key elements in reducing soil and water loss on a watershed scale (Tian et al. 2004), while others suggest that a rational land use plan, controlling landscape fragmentation, and increasing the proportion of forest area will help to achieve a healthier river ecosystem (Huang et al. 2016).
As this region is a typical arid and semiarid area, the available surface water is invaluable to local residents and the local economy in the Loess Tableland Area (Li et al. 2017). Therefore, watershed management has been emphasized by the local governments for a long time. As independent geomorphic units, medium and small watersheds are the basic constituent units of a large watershed. The hydrologic situation of a large watershed is also dependent upon, and subject to, any changes in the small watershed because it originates therein. In other words, small watersheds have direct effects on the local natural landscape, and the hydrology and water resource conditions present in a small watershed undergird not only the ecological and the environmental protection of the whole watershed but also the regional social development within that watershed. Due to climate changes and the deleterious effects of human activities, more and more scholars are focusing their attention on small-to-medium river basin management, and especially, hydrological changes and the corresponding ecological responses (Pumo et al. 2016; Carvalho-Santos et al. 2016; Li et al. 2014b, c, 2016b; Wu et al. 2014b; Stumbaugh and Hamlet 2016). Many scientific studies are focused on integrated watershed management to understand the impacts of water management on the water cycle of a small watershed (Dai et al. 2016; Xie et al. 2011; Yan et al. 2012). In addition, clear local statutes, strong enforcement and practical protocols are crucial to the success of small river basin organization (Wang et al. 2015).
As relatively independent hydrological units in the Loess Tableland Area, small watersheds may reflect fundamental hydrologic characteristics associated closely with big watersheds. With its numbers of distributed gullies and ditches, the small watershed is not only the initial source of the runoff yield and confluence, but it is also the provenance of sediment and loess erosion. Therefore, from a hydro-ecological perspective, it is very important to study the relationship between land cover and hydrological characteristics from their origin in the small watershed of the loess hilly region. There are some difficulties in conducting this research on small watersheds; for instance, observation is challenging, and there is a deficiency of measured data. The aims of the present study are: (1) to find out runoff variations of small ungagged watersheds in the Loess Plateau during the past decades, (2) to better understand the underlying hydrological and ecological laws of the loess hilly region. The Qinghe River Basin, a typical small watershed, was selected for a case study in this paper, and an ArcGIS-based SWAT model was built to simulate the response of some hydrologic factors to land cover changes that have occurred over the past decades.
Study area
With a total area of 1550 km2, the Qinghe River Basin is located on the southeast brink of the Loess Plateau. The Qinghe River is an inflow component of the Weihe River, and it is one of the second-order tributaries of the Yellow River. It arises from the Xiezizhang Mountain, northwest of Yaoxian County, Shaanxi Province, flows through Jingyang County, Sanyuan County, and Xi’an, and finally, finds its destination into Weihe River; the largest tributary of the Yellow River. With a total length of 147.4 km, there are two branches of the Qinghe River: the Qingyuhe River and the Yeyuhe River. It is the largest river passing through Sanyuan County, and the average annual runoff of the Qinghe River is approximately 63 million m3. The general view of the Qinghe River Basin is shown in Fig. 1.

The general view of the Qinghe River Basin
A temperate, continental climate prevails in the Qinghe River Basin, with four distinctive seasons, including a cold, dry, and windy winter and a hot summer with frequent flooding. The average temperature is 9.8 °C, with the highest air temperature at 39.4 °C and the lowest at −3.3 °C. More than half the annual average precipitation is concentrated in July, August and September. The average sun exposure time is 2200 h per year, and the average frost-free season lasts approximately 213 days. The distribution of precipitation and air temperature of Qinghe River Basin are shown in Figs. 2 and 3.

The precipitation distribution of the Qinghe River Basin

The air temperature distribution of the Qinghe River Basin
Land use and its change in past 30 years
Land use data analysis
The changes in land use in the watershed are reflected on the land use map for different time periods. Land use maps reflecting the prevailing conditions for 1990 (Fig. 4), 2000 (Fig. 5) and 2009 (Fig. 6) were selected as typical years based upon the available land use data that have been collected over the past three decades. The statistical results on land use changes are shown in Table 1. It should also be noted that an effort known as the Loess Plateau Watershed Rehabilitation Project was launched to mitigate desertification at the end of the last century, during which numerous trees were planted, and nature is now reclaiming a portion of the Loess Plateau (Laflen 2000).

The land use map of the Qinghe River Basin in 1990

The land use map of the Qinghe River Basin in 2000

The land use map of the Qinghe River Basin in 2009
The prevailing land use types in the Qinghe River Basin are woodland, farmland and grassland from the years 1990 to 2009, and these three types of land use prevail in more than 95% of the total area of the watershed. Of the minor land use types, urban land accounted for approximately 1% of the total river basin, and the water area is the smallest type, taking up no more than 0.2%. The area proportion of farmland, woodland, grassland, urban land and water, listed in decreasing proper order, covers the total area of the watershed.
Land use changed substantially over the period studied from 1990 to 2000, with a growth rate of 19.03%, and the woodland area increased rapidly to 199.79 km2. The grassland area decreased significantly by approximately 20.67% and fell to 217.00 km2. The farmland areas and urban areas showed no noticeable change. The land use changes for the period from 2000 to 2009 were more modest; the forest land decreased to an area of 41.61 km2, falling no more than 4%. All the other land use types increased slightly over the same period.
The character of land use transfer
The variation of the land use types and their transition can clearly be presented with the land use transfer matrix. By overlaying the land use maps from different periods through the spatial analysis function of the ArcGIS software, the area of different land use types in different periods and the corresponding value of roll-in and roll-out of the land use types over those periods were acquired, and the transfer matrix of land use types in different periods could then be calculated, as shown in Table 2.
According to this analysis, the other 3 land use types remained relatively stable except for the grassland and forest land areas. The forest land was the largest roll-in type, and the grassland was the main roll-out type. More than 94% of the roll-out forest land was transferred into farmland, although that total amount was very small. The main roll-in type of forest land was grass land, which accounted for more than 98% of all roll-in, proportionally. As the major roll-out type, most of the grassland transferred into forest land, which accounting for more than 87% of the summation, followed by farmland, taking approximately 10% of the roll-out area. Farmland increased slightly, and water and urban areas kept the balance as a whole. The land use changes are calculated as percentages and shown in Table 3.
The most significant land use changes occurred between grassland and forest land, as shown in the table. The largest change, accounting for approximately 18.91% of the total area in the basin, is related to grassland changes, followed by woodland and arable land, accounting for changes of 17.93 and 3.60% of the total area in the watershed, respectively.
Hydrologic modelling
DEM
As a digital model or 3D representation of a terrain’s surface, DEM is the basis of discretizing and parameterizing the image data in distributed hydrological modelling. Subcatchment partition, vectorizing a watershed boundary and a hydrographic net are easily carried out with DEM in ArcGIS. The 90-metre-resolution DEM is used in this research with Shuttle Radar Topography Mission (SRTM) data available at http://srtm.csi.cgiar.org/. The DEM of the Qinghe River Basin after preprocessing is shown in Fig. 7.

The DEM of the Qinghe River Basin
Soil data
As important input data, soil data includes both spatial distribution maps and soil attribution data. The 1:1 million soil data used in this research, with a resolution of 1 km, was obtained from the Harmonized World Soil Database version 1.1 (HWSD) established by United Nations Food and Agriculture Organization (FAO) and the International Institute for Applied Systems Analysis (IIASA). The soil classification system adopted is FAO-90 (Fischer et al. 2008). The data set was provided by the Cold and Arid Regions Sciences Data Center at Lanzhou (http://westdc.westgis.ac.cn).
-
1.
Soil spatial distribution maps: based on the actual situation, the spatial distribution map was reclassified as calcic cambisol, accumulated anthrosols, gleyic cambisol, etc., as shown in Fig. 8. The agrotype and corresponding area proportion are listed in Table 4. The codes in the table are the codes used in SWAT modelling.
Fig. 8 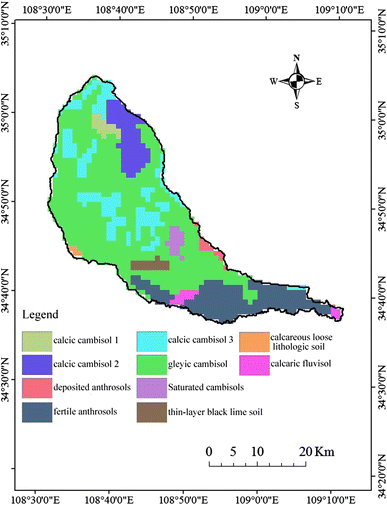
Soil type and spatial distribution map of the Qinghe River Basin
Table 4 Soil type in the Qinghe River Basin -
2.
Soil attributes data: there are two types of attributes: physical attributes and chemical attributes. The former are indispensable in building a hydrological model based on SWAT. Due to the movement of both water and air, the complete process of water circulation in the hydrological response units (HRUs) was influenced greatly by the physical attributes of the soil.

Simulation and calibration
For hydrological simulation of an ungauged basin, both the Parameter Transplanting Method and the Hydrological Analogy Method were combined to build SWAT modelling. The Parameter Transplanting Method is an effective method for building a hydrological model for streamflow simulation or prediction methodology for ungauged basins. Based on the runoff data of a gauged basin, the streamflow in the ungauged catchments is simulated through a disaggregation procedure that utilizes the measured streamflow data from a larger gauged catchment in which the ungauged catchment nested. Ideal accuracy of the results can thus be provided for any given time step (Schreider et al. 2002).
To obtain the necessary parameters for an ungauged catchment, a referenced catchment is required according to the principle of similarity. The similarity of the two catchments is the key precondition for determining the precision of the simulation. The similarity can be evaluated by distance similitude and attribute similitude. The former refers to the fact that the closer the referenced catchment is to the designated catchment, the better will be the results obtained from the modelling. The latter refers to the similar attributes such as topography, climate, land cover, etc., that are given priority in considering the hydrological modelling and parameters transplanting.
The Jingcun-Zhangjiashan interval catchment, a downstream subcatchment of the Jinghe River, bordering the Qinghe River Basin on the west, is considered to be the ideal referenced catchment for the Qinghe River Basin. The hydrological similarity of the two catchments for topographic index, drainage area, vegetation coverage and air temperature were analysed separately according to formula (1).
In this calculation, S(I) is the hydrological similarity on an index I, I d is the value of the index for the designated target catchment, and I r is the value of the index for the catchment referenced. The topographic index ln(α/tanβ) reflects the trend of runoff accumulation at a certain point in the river basin and its motion tendency because of gravity (Beven and Kirkby 1979; Quinn et al. 1991). α is the ratio of the catchment area to the length of the contour of a cell grid, namely the unit catchment area along the length contour at the given point, tanβ is the ratio of elevation difference of two adjacent cell grids Δh to the distance of their centre Δl, say, the slope at the point, tanβ = Δh/Δl.
Due to the lack of observed data, the hydrological analogy method was also applied to acquire the daily runoff at the outlet of the Qinghe River. The stream flow data is necessary for validating the correction and precision of the hydrological model built.
Based on parameter sensitivity analysis, the Runoff Curve Number (Cn2), the Coefficient of Base Flow (Alpha_Bf) and another 4 parameters that were considered sensitive to the modelling results that had been calibrated before the simulation, were conducted on a monthly basis.
All the elements constituting the hydrologic balance of the Qinghe Catchment are presented for each year from 1975 to 2015 in Fig. 9. Therein, ∆W refers to the water storage variation in the watershed and this was determined using the following expression (2).
where P is precipitation, R Q denotes the surface runoff, while R G denotes the base flow, E T is the evapotranspiration.

Surface runoff, base flow, evapotranspiration and their trends over the past 30 years according to the results of the simulation
The average annual evapotranspiration of 307.41 mm takes almost 60 per cent of the average annual precipitation 521.59 mm in the watershed according to the simulation results. The average annual surface runoff 102.99 mm holds approximately 20 per cent of that total, while the base flow of 51.39 mm shares another approximately 10 per cent. It is clear that the main process of water output in the basin is evapotranspiration. The available water resources take only approximately 30 per cent of the annual precipitation, and these percentages are necessary for any general understanding of the Loess Tableland Area.
As the trend lines in Fig. 9 indicate both the evapotranspiration and the surface runoff sequence demonstrate decreasing tendencies, while the evapotranspiration also descends in an apparent contrast to the surface runoff to some degree. Nevertheless, there is no distinct change in the base flow, and it can thus be inferred that the main decrease in the available water resources in the region is due to the decrease in the surface runoff. Meanwhile, a rather stable precipitation and base flow may indicate that the main hydrological situation changes in the watershed were not caused by climate change.
The contribution of land use and climate changes on the hydrologic situation
To understand the influence of land use and climate changes on the hydrologic elements in the Qinghe River Basin over the past 30 years, the simulation period was divided into two stages as “1980 to 1995” and “1996 to 2010”. Four scenarios, shown in Table 5, were then established by combining the land uses and climate conditions into different stages in order to simulate the hydrologic differences. Since the land use has changed gradually over time, the known land use in 1990 was considered as the land use of the first stage, and the latest land use for 2009 was chosen as the representative for the second stage. Scenario 1 was set as the reference scenario, and it simulates the actual hydrologic situation of the 80 and 90 s. Scenario 4 was designed to simulate the latest situation for the watershed in stage 2. Thus, both scenario 1 and scenario 4, simulating coincident land use and climate conditions, reflect actual conditions. Thus, the hydrological changes for those two scenarios reflect the composite effects of land cover and climate change. The simulation results of surface runoff are shown in Table 6.
Scenarios 2 and 3 are strictly theoretical because they do not match the known and observed land use and climate data. Scenario 2, which keeps land use unchanged, in contrast to scenario 1, was designed to simulate the effects of climate change on hydrology. Scenario 3, which keeps climate unchanged in contrast to scenario 1, was designed to reflect the hydrological effects of land cover.
The simulation results show that the average annual surface runoff for scenario 2 is 1.58 mm less than that for scenario 1, indicating that the runoff tends to decrease slightly under the climate change. That conclusion necessarily follows because the two scenarios entail the same land cover. However, the average annual surface runoff for scenario 3, in which land cover was taken into account, was only 6.04 mm more than the surface runoff in scenario 1. That indicates that the runoff tends to increase as a result of the effects of land cover changes caused primarily by human activity. A difference of 4.76 mm between scenario 4 and scenario 1 indicates a tendency for increasing annual runoff as a result of the composite effects of both land cover and climate change according to Table 6. It is clear that the average annual surface runoff increased from stage 1 to stage 2. Land cover, which holds a rate of contribution of 79.27% for the hydrological variation, contributes more than climate change, which amounts to only about a one-fifth of the variation.
The hydrologic situation analyses with different land cover
It has been proven that surface runoff would increase as a result of the rise of additional woodland areas in a watershed. Generally, woodland areas can mitigate the accumulation of the rainwater in the rainfall-runoff process due to their heavy canopies and humus layer effectively retarding the concentration time of flow on the one hand, while increasing the annual runoff on the other hand. The base flow in particular could be increased after the precipitation period if the retained water in the woodland was released slowly over a relatively long period of time as a part of subsurface runoff. However, the total runoff cannot be increased with more woodland cover because the amount of evapotranspiration will also rise substantially. Although both farmland and grassland can mitigate the accumulation of rainwater in the rainfall-runoff process, they also reduce the annual runoff as a whole due to greater evaporation as well as greater water consumption used for the growth of crops (Huang et al. 2005). The rainfall-runoff process on urban land is usually fast because urban runoff is quickly concentrated in a rather direct way in a short period of time due to the presence of so many impermeable ground surfaces in urban areas. As a result, the annual runoff is increased in comparison with woodland or farmland in equal conditions, although the base flow could be fairly small and much more stable.
As one of the most significant contributors to the hydrological changes of Qinghe River Basin over the past 30 years, the land use data in different time periods was applied to simulate the rainfall-runoff process from 1975 to 2015 to better understand how and why it affects the hydrological situation. The results are shown in Table 7. There were 3 simulations, and the only difference between them is the land cover mode adopted; the first simulation adopted the land cover of 1990, the second adopted the land cover of 2000, and the third simulation adopted the land cover of 2009.
The simulation results show the average annual total runoff and the base flow in descending order from simulation 1 to simulation 3. The maximum annual surface runoff appears in simulation 2, and the maximum annual evapotranspiration is shown in simulation 3. Contrasting these figures with simulation 1, the average annual surface runoff increased 3.9 mm, the base flow decreased to 9.18 mm, while the evapotranspiration increased more than 70 mm in simulation 2. Combining the land cover analyses revealed previously, that the reduced surface runoff might be partly caused by the reduction in grassland and the increase in woodland in the watershed. At the same time, evapotranspiration increases greatly because of the water consumption of the expansive woodland. Nonetheless, the decrease in base flow may also be caused by the increase in farmland and urban land.
The difference between simulation 2 and simulation 3 is not significant. The total runoff, surface runoff, and base flow decreased slightly while the evapotranspiration rose slightly due to the expansion of farmland and grassland, which are in line with the differences of the land cover during the two periods.
It is undeniable that the annual runoff tends to decline over the period regardless of which land cover was used in the simulations. This demonstrates that the runoff would continue to decrease with the implementation of measures such as converting grassland to forest or returning cropland to forest, not on the Qinghe River Basin only but also on a similar medium or small semiarid watershed in the Loess Plateau. These runoff distributions within a year were also analysed in the three simulations as shown in Table 8.
The runoff in the dry season reaches its maximum in simulation 2 and its minimum in simulation 1. The surface runoff in the flood season reaches its maximum in simulation 1 and its minimum in simulation 3. This proved that water resource conditions could be more profitable with a higher coverage of forest land in the watershed as in simulation 2. Furthermore, from the perspective of water resource utilization, additional water is most desirable in the dry season as opposed to the flood season in an arid and semiarid area such as the Loess Plateau. Thus, the water deficiency could be alleviated in the dry season, on the one hand, while water and soil loss and flood disasters could on the other hand be mitigated to some extent.
Conclusions
As historically highly fertile and easy to farm soil, the Loess Plateau contributed to the development of the early Chinese civilization around it. However, due to its highly erodible soil, new efforts focusing on both the conservation of water and soil and water resource management are a major focus of Chinese agriculture for the future. There are hundreds of small watersheds in the Loess Tableland Area that merges and forms a big watershed. The hydrological and ecological situations that are involved in these small watersheds determine function for the watershed as a whole. Taking the Qinghe River Basin as a typical watershed, this research was conducted in order to better understand both the current status of the hydrological situation and the changes that have occurred in the Loess Tableland Area, including measurements of surface runoff, existing vegetation and the hydrological cycle.
These analyses demonstrate that land cover changed significantly at end of last century in the Qinghe River Basin. On the one hand, with a growth rate of 19.03%, the woodland area increased 199.79 km2. On the other hand, the grassland area decreased 20.67% to an area of approximately 217.00 km2. To understand the influence of land use and climate changes on the hydrologic elements in the Qinghe River Basin, 4 scenarios were established, combining land uses and climate conditions in different stages to simulate the hydrological differences. Further analysis indicated that the land cover changes played a predominant role in the hydrological variation of the Qinghe River Basin, although it still showed the influences of Climate Change. Applying different simulations of the rainfall-runoff process based on the land use data in different ages also revealed the significant benefits to the local conservation of water and soil as well as flood control brought by higher forest land cover, specifically manifested as the tendency of increased runoff in the dry season and decreased runoff in the flood season.
References
Beven K, Kirkby MJ (1979) A physically based variable contributing area model of basin hydrology. Hydrol Sci Bull 24(1):43–69
Carvalho-Santos C, Nunes J, Monteiro A et al (2016) Assessing the effects of land cover and future climate conditions on the provision of hydrological services in a medium-sized watershed of Portugal. Hydrol Process 30(5):720–738
Dai J, Cui Y, Cai X et al (2016) Influence of water management on the water cycle in a small watershed irrigation system based on a distributed hydrologic model. Agric Water Manag Si 174:52–60
DeRoo APJ, Ddijk M, Schmuck G et al (2001) Assessing the effects of land use changes on floods in the Meuse and Oder catchment. Phys Chem Earth B 26:593–599
Fischer G, Nachtergaele F, Prieler S, van Velthuizen HT, Verelst L, Wiberg D (2008) Global Agro-ecological Zones Assessment for Agriculture (GAEZ 2008). IIASA, Laxenburg, Austria and FAO, Rome
Han YN, Niu JZ, Wu FZ (2015) Land-use changes in the small watershed of the Loess Plateau, hilly-gully region, China. J For Res 26(1):91–99
Huang Y, Chen L, Fu B (2005) Assessment on vegetation ecological water consumption in gully catchment of Loess Plateau, China. J Soil Water Conserv 19(2):152–155 (in Chinese)
Huang ZL, Han LY, Zeng LX et al (2016) Effects of land use patterns on stream water quality: a case study of a small-scale watershed in the Three Gorges Reservoir Area, China. Environ Sci Pollut Res 23(4):3943–3955
Laflen JM (2000) Soil erosion and dryland farming. CRC Press, pp 7–36. ISBN 0-8493-2349-5
Li P (2016) Groundwater quality in western china: challenges and paths forward for groundwater quality research in western China. Expo Health 8(3):305–310. doi:10.1007/s12403-016-0210-1
Li P, Qian H, Wu J (2011) Hydrochemical formation mechanisms and quality assessment of groundwater with improved TOPSIS method in Pengyang County Northwest China. E-J Chem 8(3):1164–1173. doi:10.1155/2011/251918
Li P, Qian H, Wu J, Zhang Y, Zhang H (2013a) Major ion chemistry of shallow groundwater in the Dongsheng Coalfield, Ordos Basin, China. Mine Water Environ 32(3):195–206. doi:10.1007/s10230-013-0234-8
Li P, Wu J, Qian H (2013b) Assessment of groundwater quality for irrigation purposes and identification of hydrogeochemical evolution mechanisms in Pengyang County, China. Environ Earth Sci 69(7):2211–2225. doi:10.1007/s12665-012-2049-5
Li P, Qian H, Wu J (2014a) Accelerate research on land creation. Nature 510(7503):29–31. doi:10.1038/510029a
Li P, Wu J, Qian H (2014b) Hydrogeochemistry and quality assessment of shallow groundwater in the southern part of the yellow river Alluvial Plain (Zhongwei Section), China. Earth Sci Res J 18(1):27–38. doi:10.15446/esrj.v18n1.34048
Li P, Qian H, Wu J, Chen J, Zhang Y, Zhang H (2014c) Occurrence and hydrogeochemistry of fluoride in shallow alluvial aquifer of Weihe River, China. Environ Earth Sci 71(7):3133–3145. doi:10.1007/s12665-013-2691-6
Li P, Qian H, Howard KWF, Wu J, Lyu X (2014d) Anthropogenic pollution and variability of manganese in alluvial sediments of the Yellow River, Ningxia, northwest China. Environ Monit Assess 186(3):1385–1398. doi:10.1007/s10661-013-3461-3
Li P, Wu J, Qian H (2014e) Origin and assessment of groundwater pollution and associated health risk: a case study in an industrial park, northwest China. Environ Geochem Health 36(4):693–712. doi:10.1007/s10653-013-9590-3
Li P, Wu J, Qian H (2016a) Hydrochemical appraisal of groundwater quality for drinking and irrigation purposes and the major influencing factors: a case study in and around Hua County, China. Arab J Geosci 9(1):15. doi:10.1007/s12517-015-2059-1
Li P, Wu J, Qian H, Zhang Y, Yang N, Jing L, Yu P (2016b) Hydrogeochemical characterization of groundwater in and around a wastewater irrigated forest in the southeastern edge of the Tengger Desert, Northwest China. Expos Health 8(3):331–348. doi:10.1007/s12403-016-0193-y
Li P, Li X, Meng X, Li M, Zhang Y (2016c) Appraising groundwater quality and health risks from contamination in a semiarid region of northwest China. Expo Health 8(3):361–379. doi:10.1007/s12403-016-0205-y
Li P, Tian R, Xue C, Wu J (2017) Progress, opportunities and key fields for groundwater quality research under the impacts of human activities in China with a special focus on western China. Environ Sci Pollut Res. doi:10.1007/s11356-017-8753-7
Pumo D, Caracciolo D, Viola F, Noto LV (2016) Climate change effects on the hydrological regime of small non-perennial river basins. Sci Total Environ 542:76–92
Qian H, Li P, Howard KWF, Yang C, Zhang X (2012) Assessment of groundwater vulnerability in the Yinchuan plain, northwest China using oreadic. Environ Monit Assess 184(6):3613–3628. doi:10.1007/s10661-011-2211-7
Qian H, Li P, Wu J, Zhou Y (2013) Isotopic characteristics of precipitation, surface and ground waters in the Yinchuan plain, Northwest China. Environ Earth Sci 70(1):57–70. doi:10.1007/s12665-012-2103-3
Quinn P, Beven KJ, Planchion O (1991) The prediction of hillslope flow paths for distributed hydrological modelling using digital terrain models. Hydrol Process 5(1):59–79
Rakhmatullaev S, Huneau F, Celle-Jeanton H et al (2013) Water reservoirs, irrigation and sedimentation in Central Asia: a first-cut assessment for Uzbekistan. Environ Earth Sci 68(4):985–998
Schreider SY, Jakeman AJ, Gallant J, Merritt WS (2002) Prediction of monthly discharge in ungauged catchments under agricultural land use in the Upper Ping basin northern Thailand. Math Comput Simul 1–3:19–33
Stumbaugh M, Hamlet A (2016) Effects of climate change on extreme low-flows in small lowland tributaries in the Skagit River Basin. Northwest Sci 90(1):44–56
Tang K (2004) Soil and water conservation in China. Science Press, Beijing, pp 6–15
Tian JL, Liu PL, Shimizu H, Inanaga S (2004) A case study on combating desertification at a small watershed in the hills-gully area of Loess Plateau, China. In: 6th international symposium on plant responses to air pollution and global changes, Tsukuba, Japan, pp 277–284. doi:10.1007/4-431-31014-2_31
Wang S, Li W, Zhou Y (2015) Space–time evolution of historical drought hazards in eastern China. Nat Hazards 77(3):2027–2047
World Bank (2006) Reengaging in agricultural water management: challenges and options, 2-18, ISBN 0-8213-6498-7
Wu J, Sun Z (2016) Evaluation of shallow groundwater contamination and associated human health risk in an alluvial plain impacted by agricultural and industrial activities, mid-west China. Expo Health 8(3):311–329. doi:10.1007/s12403-015-0170-x
Wu J, Li P, Qian H, Fang Y (2014a) Assessment of soil salinization based on a low-cost method and its influencing factors in a semi-arid agricultural area, northwest China. Environ Earth Sci 71(8):3465–3475. doi:10.1007/s12665-013-2736-x
Wu J, Qian H, Li P, Song Y (2014b) A system-theory-based model for monthly river runoff forecasting: model calibration and optimization. J Hydrol Hydromech 62(1):82–88. doi:10.2478/johh-2014-0006
Xie T, Liu X, Sun T (2011) The effects of groundwater table and flood irrigation strategies on soil water and salt dynamics and reed water use in the Yellow River Delta, China. Ecol Model 222(2):241–252
Yan DH, Wang G, Wang H, Qin TL (2012) Assessing ecological land use and water demand of river systems: a case study in Luanhe River, North China. Hydrol Earth Syst Sci 16:2469–2483. doi:10.5194/hess-16-2469-2012
Acknowledgements
The authors acknowledge the financial support granted by the National Natural Science Foundation of China (41471452 and 41273104), the Natural Science Basic Research Plan in Shaanxi Province of China (2015JM5256), the Fundamental Research Funds for the Central Universities (No. 310829161003), the Special Fund for Basic Scientific Research of Central Colleges (Program 310829163405) and the Special Fund for Scientific Research on Public Interest of the Ministry of Water Resources (201301084). Additionally, the data set is provided by Cold and Arid Regions Sciences Data Center at Lanzhou (http://westdc.westgis.ac.cn).
Author information
Authors and Affiliations
Corresponding author
Additional information
This article is a part of a Topical Collection in Environmental Earth Sciences on Water resources development and protection in loess areas of the world, edited by Drs. Peiyue Li and Hui Qian.
Rights and permissions
About this article

Cite this article
Liu, Z., Li, L., Wang, L. et al. Hydrological situation of a typical watershed in the Loess Tableland Area of China over the past 30 years. Environ Earth Sci 76, 577 (2017). https://doi.org/10.1007/s12665-017-6915-z
Received:
Accepted:
Published:
DOI: https://doi.org/10.1007/s12665-017-6915-z