
Abstract
As groundwater activity develops in a landslide system, the water–rock (soil) interaction increasingly influences the development of the landslide hazard. In this paper, Huangtupo landsli de was chosen as the subject of our research, which is located beside the Three Gorges Reservoir and the deformation continued for a long time. First, based on a comprehensive field survey, ten types of bad geological elements which probably induce the deformation were collected from different parts of landslide. These include a soft rock layer, the sliding soil, a weak intercalation and the typical rock close to the slip zone. Then, to trace the internal relationships among these samples, the microstructure, chemical composition of minerals, the migration and evolution of clay minerals, also the particle size distribution characteristics of all the samples were analyzed separately. Comparison of the result shows, that the evolutionary paths are very obvious among these samples. With the activities of water–rock (soil) interaction, the formation and evolution of main bad geological elements can be summarized. Afterwards, the detailed mechanism of interaction is revealed by focusing on four samples which compose one of these three paths, using additional data from physical and mechanical tests, the study shows how water–rock (soil) interaction affects the microstructure and weakens the mechanical properties of rock and soil. The presented detailed research probes the water–rock (soil) interaction mechanism specifically for Huangtupo riverside landslide as a case study. Furthermore, the applied multi-sample dynamic tracing method is verified as a means to discover and illustrate the deformation mechanism of landslides.
Introduction
Generally, in a landslide system with developed groundwater activity, the water–rock (soil) interaction will facilitate the formation of bad geological elements, including the landslide slip zone, weakened zone and so on. They play a controlling role in the stability of a landslide and will greatly affect the development of slope failure (Wang et al. 2007). So, to research the deformation mechanism and trend in detail, more attention should be paid on the water–rock (soil) interaction (Shen and Wang 2002).
From the aspect of physical and chemical processes of water–soil, Xu et al. (2005a, b) shows the lubrication effect of clay minerals when the soil is saturated or of high water content, which can be considered as a key factor in slope failure. Shuzui (2001) suggest that the groundwater activities will promote the formation and enrichment of clay minerals, and thereby reduce the soil strength. Wen and Aydin (2005) and Wen and Chen (2007) compared the differences and changes of sliding soil, and the mineral composition of its surrounding rock–soil. They consider that the slip zone, which is rich in clay minerals, and the weak muddy zone are easily destabilized under the action of water. Li et al. (2006, 2007) regard the evolution of slip zone as a process from native soft rock to shear zone, and finally to slip zone, study the relationship between water–soil interaction and evolution of slip zone. Yan et al. (2002) suggest that the stability of the landslide should be threatened once strongly water-sensitive minerals like montmorillonite and vermiculite are rich in soil mineral composition of slip zone. Therefore, the strength of sliding soil is closely related to the clay mineral content (Jian et al. 2009). Tang et al. (2003) studied the influences of the clay mineral content on the strength of sliding soil, and consider that clay mineral content over 30 % could control the integrated strength of sliding soil, so the chemical water–rock interaction could cause great damage to the strength of rock mass. Analysis of the dynamic chemical mechanism shows that clay minerals play an important role in stability of marly soil (Mohamed 2000). Sequential reactions between percolating groundwater and rock-forming minerals will change the mineralogy, geochemistry and physical and mechanical properties of weathered rocks (Chigira and Oyama 1999). In addition, long-term chemical water–rock (soil) interactions can cause even greater damage to the rock mass strength (Liu et al. 2008). In summary, the impact of water–rock (soil) interaction on slope stability and how it influences the deformation of a landslide have been the focus of studies by many investigators.
Generally, water–rock (soil) interaction is a long evolutionary process. To understand the transformation mechanism of a method comparing multiple samples dynamically was used, and has become popular in the field of Earth Sciences in recent years. Based on tracing the fluctuation of clay minerals, Zhu and Lu (2009) treated the whole transformation process as a “batch system”, and made a detailed analysis of the alkali feldspar dissolution and the secondary mineral precipitation. The dissolution and precipitation of clay minerals is significant, because geologic CO2 sequestration conditions caused by the interactions among CO2, brine, and phlogopite will strongly change the internal microstructure of the rock mass (Shao et al. 2010). This kind of dynamic tracing method was also used by Lucas et al. (2010) for researching the water–rock interactions during salinization of alluvial groundwater. The influence of underground water runoff (Locsey et al. 2012; Fitz-Diaz et al. 2011) and the groundwater characterization (Beaucaire et al. 2008) have been shown to be very important in changing the original structure and characteristics of rock and soil.
In the authors’ opinion, the formation of the slip zone in the landslide is, in fact, also an integral evolution process. In an attempt to determine the dominant bad geological elements (such as sliding soil, weak intercalation), the relationship among multiple samples obtained from our site of investigation is a key factor in researching the deformation mechanism of a landslide. Most of prior research in this field has paid attention to sliding soil, weak intercalation or the soft rock layer individually, but the formation and strength deterioration of potential slip zones are ignored.
The focus of this study was the Badong Huangtupo riverside landslide in the Three Gorges Reservoir (TGR). At this site, the first special test tunnel in China that crosses an active landslide has been constructed. Based on the multi-samples dynamic tracing method, combined with a comprehensive field survey on landslide surface, and a consequent geological record accompanied by the construction of test tunnel, ten types of rock and soil samples, which are logically related with water–rock (soil) interaction, were collected from different parts of landslide. According to the mineral and chemical compositions, microstructure features and soil particle size distribution characteristics, the evolution process of landslide was determined and used to assess the deformation trend of landslides.
Introduction to Huangtupo riverside landslide
The study area
Huangtupo Landslide (N31°02′30″ E110°23′00″) which locates in Badong Town (Fig. 1), is one of the top three landslides in TGR. It is situated on the right bank of the Yangtze River, about 69 km upstream of the Three Gorges Dam (TGD). Due to the construction of TGD and the water stored in the TGR, compared with former water level, the water level in study area has increased by more than 100 m, which has changed the original geological and hydrological conditions greatly (Jiang et al. 2011a). According to monitoring data, the deformation of Huangtupo landslide is still continuing, especially for the forepart which is close to the Yangtze River. Therefore, this part is called “Huangtupo riverside landslide” in this research.

Location of Huangtupo landslide
The 3D image of Huangtupo riverside landslide (Fig. 2) shows two landslide tacks that are separated by Sandaogou gully. At the #1 riverside landslide, which is a little further upstream on the Yangtze River, the altitude of the main scarp ranges from 250 to 290 m a.s.l; and the landslide toe extends to the Yangtze River, with an elevation ranging from 70 to 90 m. It covers an area of about 32.5 ha, with an average thickness of 70 m and a volume of about 2,250 × 104 m3. For the #2 riverside landslide, the elevation of the main scarp ranges from 210 to 250 m, the landslide toe also extends to the Yangtze River; and its elevation ranges from 50 to 80 m a.s.l. It covers an area of about 32 ha, with an average thickness of 60 m, and the volume is about 2,000 × 104 m3. The landslide body for both parts is mainly composed of fragmented rock mixed with clay.

3D image of Huangtupo riverside landslide (water level is about 156 m in this figure)
Geological setting of Huangtupo riverside landslide
The stratum on which Huangtupo landslide locates is the Badong group, Triassic system (T2b). This stratum, as well as the Guandukou synclinorium, which has been developed in study area, is typical of landslide settings in TGR. Deng (2000) and Deng et al. (2000) made a detailed monographic study of Huangtupo landslide, and described it as creep that developed along the deep soft rock in loose rocks.
According to a comprehensive field survey on landslide, and consequent geological records, accompanied by the construction of the test tunnel, a typical geological profile of Huangtupo riverside landslide (Fig. 3) has been compiled.

Typical geological profile of Huangtupo riverside landslide
A brief introduction to the geological structure follows: the bedrock covered by the landslide consists of marlite with limestone in the second–third section of Badong group, Triassic system (T2b2−3), and showing soft and hard lithological features. Meanwhile, the landslide is located near the core of Guandukou synclinorium. This results in well-developed cleavages in rock mass, tending to deform towards the free face under the unloading condition.
Moreover, in one year, the water level will fluctuate at the range of 145–175 m in TGR; it also makes the groundwater circulation in landslide very complex. The water flow in gravel is the strongest, in crack rock block it is weaker, and the marlite in the deep part is the most impermeable layer. Therefore the boundaries between adjacent groups play the role of drainage channels.
Sample collection and principles
A key factor in our investigation is that all research samples should be related to slip zone. The authors compiled a long-term geological record during the construction of test tunnel, conducted a comprehensive field survey of the landslide surface, and were able to trace the slip zone from the deep part to the ground surface.
The investigation described here in research includes three main parts: (1) The dynamic change of internal structure of rock mass close to slip zone, such as microstructural characteristics of the samples under condition of water–rock interaction; (2) the regular migration of minerals under long-term water–rock (soil) interaction, i.e. mineral compositions of samples that are collected from different parts of the landslide, and thereby especially the clay mineral contents; and (3) particle size distribution characteristics of the soil samples.
If the slip zone is formed in a long period, all status of slip zone will keep the trace in landslide; so, here treating the landslide as an intact system, the collected samples should represent the different types of bad geological elements as completely as possible.
Referring to drilling catalogue data and typical geological profiles, layer tracking method is taken into account. Along the extension direction of some soft rock layers in Fig. 3, ten types of rock and soil samples close to slip zone were collected, and the locality of each sample, as well as related photos, is labelled in Fig. 4. These samples, which include soft rock layer, sliding soil, weak argillization intercalation and some typical rock blocks, were collected from surface outcrops, the test adit and the test tunnel. A brief introduction for each sample is listed in Table 1, and the detailed description of each sample is as follows:

Sampling sites and photos of corresponding samples
Samples #1 and #2 were collected from the test adit (refer Fig. 4); they compose the main part of the sliding soil, and are colored greyish-green and yellow, respectively. This part of landslide has undergone the most intensive deformation compared with the adjacent layers. As stated in the analysis above, the slip zone is an important drainage channel. Figure 5 shows that the undisturbed sliding soil is saturated and very soft. The runoff of groundwater close to the slip zone is also very intensive (Fig. 6).

Undisturbed sliding soil (samples #1 and #2)

Runoff of groundwater near the slip zone
Samples #3 and #4 were collected from the test tunnel (70–85 m below ground surface), and their horizons are a little bit above the main slip zone, where samples #1 and #2 were collected. Sample #3 is yellow marlite and the intensive underground water runoff makes the structure of this sample very loose. Sample #4 is a weak interlayer, with a greyish-green color.
Based on layer tracing method, samples #5 and #6 were collected from the rear part of landslide. They should be located in a similar rock layer to samples #1–#4. Sample #5 is a weak layer transformed from marlite with a greyish-green color and high water content, so it can be collected using a shovel (as shown in Fig. 4, the sub-graph of 5# sample). Sample #6 and sample #5 revealed in the same layer, and they also have the same color, but the status of sample #6 is dry crumby soil with a greyish-green color, because it is closer to the ground surface.
Sample #7 is crack filling soil, which is distributed in structural fractures in front part of landslide (Fig. 4). This group of structural fractures formed under the combined influences of syncline structural forces and the down-cutting of Yangtze River, so the fractured joints are developed. Additionally, based on the color of sample #7 (purplish-red), it is probably the weathered and corroded product of eroded pelitic sandstone of the fourth section, Badong group (T2b4).
Sample #8 was also collected from the test adit, but in slip zone it is not as common as samples #1 and #2. Samples #7 and #8 are of a similar color and, if their evolution path is demonstrated, we can then conclude that the group of structural fractures in the photo of sample #7 extends from the surface to deep slip zone.
To provide a more complete analysis clue, samples #9 and #10 were collected from the test tunnel. Sample #9 is soft interlayer with a yellow color, and its internal structure is very homogeneous. Its location layer is also close to slip zone, so the authors make a preliminary judgment that sample #9 is probably related to the sliding soil. Finally, #10 has characteristics of typical pelitic limestone and was obtained from a site near the slip zone. The lithologic characters of samples #10 and #3 are similar, but because sample #10 is not as close to the slip zone as #3, the dissolution of #10 is not intensive, and its rock mass structure remains relatively complete.
Having collected research samples, then, in our investigation was to determine and probe the association among these samples, and to interpret the dynamic transformation based on water and rock (soil) interaction.
Evolution paths analyses based on dynamic tracing method
Based on the above sampling and field interpretations, we infer that the generation and evolution of slip zone experienced approximately three stages: native soft rock, clay interbedded shear zone and slip zone (Li et al. 2006, 2007). These three stages essentially reflect different transformation status or structure characteristics of rock and soil in landslide. With the ten types of samples shown in Fig. 4, the authors will find these different from the aspects of mineral type and content, chemical composition and particle size distribution.
Mineral content and chemical composition tests
Mineral content of research samples was analyzed using X-ray diffraction (XRD). To improve the precision of the research, two testing scales were chosen for XRD:
-
1.
The powder sample (particle sizes < 0.075 mm) was used to test the whole mineral content of each sample. Rock samples are roughly crushed with a glass rod, then carefully milled to a fine powder using a rubber stick, and are finally sieved to obtain particles < 0.075 mm.
-
2.
The orientated flake sample (particle sizes < 2 μm) was specifically used for clay mineral composition analysis. To distinguish clay minerals with partly overlapping diffraction peaks (such as montmorillonite and chlorite), the final testing samples were obtained using glycerol steam saturation. The XRD test results for each sample are listed in Table 2. Chemical composition analysis (based on chemical titration) is carried out for samples #1–#8 and the test results are listed in Table 3.
Table 2 Mineral content of each research sample obtained by X-ray diffraction test Table 3 Chemical composition of each research sample (unit: wt%)
Preliminary search for evolution paths
Based on the mineral content and chemical composition presented above, combined with the color and sampling layer of each sample, the following three evolutionary paths maybe experienced in Huangtupo landslide:
First evolutionary path: samples #5, #6, #4 and #1
This group has the similar color (grey–green) in all four samples, and was obtained at a similar layer (Fig. 4). As shown in Table 2, the clay content for all these four samples is above 35 %. Xu et al. (2005a, b) show if clay content is beyond a certain threshold, the lubrication effect of the clay minerals will be obvious and it will control the stability of the slope, such as a landslide beside TGR, the clay content of sliding soil is about 40 %; and the lubrication effect is obvious and it will control the stability of the slope. Figure 7 shows the spectrum of orientated flake diffraction for samples #5, #6, #4 and #1. The diffraction maximums of these samples are very similar, and the main clay mineral is illite (apart from the calcite, this is the main ingredient of marlite). Looking also at Fig. 4, for samples that are located near slip zone, the content of clay minerals is gradually increasing from the top of landslide to the bottom (#5 → #4 → #1). The content of smectite increases rapidly, yet the calcite content gradually decreases and other minerals are relatively stable. In addition, compared with sample #5, the weathering degree of sample #6 is more intense, and its structural integrity is apparently poorer. This shows a different evolution style for samples #4 and #1, a detailed analysis will be carried out in the follows.

XRD spectrum of oriented flake sample for samples #5, #6, #4 and #1
Second evolutionary path: samples #10, #3, #9 and #2
This group includes two rock samples: #10 and #3. Sample #10 is the representative marlite in T2b3; it contains many calcite veins, and the calcite content is nearly 80 %; sample #3 has been intensively dissolved and has a very loose structure. Both samples have very similar mineral composition.
Based on Fig. 4 and Table 3, these samples have common characters of color and mineral composition, but the states are different, compared with sample #3, sample #9 is soft interlayer, and sample #2 has undergone intensity deformation and became a part of sliding soil. It possibly represents an evolution process. In the process of #3 → #9 → #2, the calcite content gradually decreases, this change also shows the strong dissolution in landslide, and the clay mineral content gradually increases.
Third evolutionary path: samples #7 and #8
The relationship between these two samples is simpler and more direct than other two paths. Sample #7 is representative of the completely weathered product of purplish-red rock mass in T2b4. According to the survey in test tunnel, the group of fractures in photo of sample #7 (Fig. 4) extend to the slip zone. Figure 8 was taken in test tunnel, it shows the rock mass structure close to slip zone, and the group of fractures is very clearly distinguishable and the sliding surface is marked by red oval. The mineral contents and chemical compositions of samples #7 and #8 are very similar, which we interpret as providing direct proof of soil migration towards the deeper part along fractures.

Photo of critically oriented fractures and the sliding surface taken in the test tunnel (indicate by red oval)
Evolution and migration pattern analyses of clay minerals
Within all the samples that we obtained at the Huangtupo riverside landslide, illite is the main component of the clay minerals. Illite (\([ {\text{K}}_{{ 2 { - }x}} {\text{Al}}_{ 4} ( {\text{Al}}_{{ 2 { - }x}} {\text{Si}}_{{ 6 { + }x}} {\text{O}}_{ 2 0} ( {\text{OH)}}_{ 4} ) ]\)) is a relatively stable product of K-feldspar which has experienced a relatively low degree of physical weathering and weak leaching under the conditions of an alkaline environment and dry climate (Xu et al. 2005a). The reaction is shown as Eq. 1:
As marlite and calcareous claystone are relatively impermeable layers, the leaching and permeability were low in the landslide during the early period when the structure of rock layer is intact, therefore triggering the reaction of Eq. 1.
According to the test results from underground water in the study, the pH values of groundwater range from 8.05 to 8.5, slightly alkaline, with the main cations of Ca2+ (75.2 %) and K+ (18.2 %), and the anions of \({\text{HCO}}_{ 3}^{ - }\)(60.3 %) and \({\text{SO}}_{ 4}^{ 2- }\)(27.9 %), making the groundwater HCO3–Ca type water. In recent research, there are two viewpoints about the evolution of illite: (1) As a long-term effect of the slightly alkaline water, the structure of illite gradually changes, forming an expansion interlayer, during which the illite transforms to smectite with depotassication occurring (Seodon and Eberl 1989) (or “type 1” in short). (2) In HCO3–Ca type water, as an effect of the interlying illite/smectite (I/S) and cation exchange adsorption, Ca2+ cations, with stronger exchange capacity replace the K+ cations which have already exited into the interlayers, causing illite to transform to smectite (Li et al. 2006) (or “type 2” in short). Both types of evolution will cause a decrease of the K+ cation content, but with different Ca2+ cation content adsorbed in the clay minerals.
To carry out a quantitative analysis, some indexes were defined. Based on the chemical compositions of the clay minerals, K cations mainly stem from illite (including interlying I/S); and Al is generally the main metal element contained in clay minerals. Therefore, if the clay minerals acquired at the Huangtupo Landslide were transformed, the Al2O3/K2O ratio would reflect the variation of the illite content. The relationship between the CaO equivalent in calcite and the total CaO equivalent can be used to determine whether obvious cation exchange adsorptions occurred. Although the chemical composition of feldspar is complex, the content is lower than 5 % in all samples, which is negligible in this study. The authors abstracted data from Tables 2 and 3, as listed in Table 4 that assists in analyzing the migration and evolution of clay minerals.
A case study on the first evolution path was carried out (samples #5, #6, #4 and #1). Samples #5 and #6 were collected from the rear part of the riverside landslide, where groundwater activity was not developed. From samples #5 to #6, the smectite content increased rapidly, as did the Al2O3/K2O ratios, with decreasing illite content, which is to be expected in the evolution of illite → smectite. Comparing the CaO equivalent in calcite and total CaO, the calcite percentage did not change, but the total CaO in sample #6 shows an increase compared with sample #5, indicating vigorous activities of cation exchange adsorption. This in turn supports type 2 of the evolution model of #5 → #6.
Samples #4 and #1 were located near the main slip zone but at different elevation (refer Fig. 4). For the evolutionary path of #5 → #4 → #1, the clay mineral content gradually increased, especially the contents of smectite, which can be seen in Table 4 to rise from 4 to 14 %, while the content of illite fluctuated and slightly increased, with the changing of Al2O3/K2O and (S + C + K)/I in Table 4; it indicates the migration and enrichment of clay minerals. The change rates of the CaO equivalent in calcite and total CaO are very close.
For the transformation of #3 → #2 can be determined in the same way. In summary, the migration and enrichment of clay minerals is apparent in this landslide, and are closely related to the formation and development of bad geological elements, such as weak layer and sliding soil.
The similar characteristics from the aspect of particle structure
For sliding soil collected from the main slip zone and weak intercalation, they experienced intensity deformation; and the particle size distribution (PSD) of these spatial geological elements retains certain characteristics of the source materials.
Samples #5, #4 and #1 represent the PSD characteristics of bad geological elements located in the upper, middle and lower parts of the landslide, respectively, at the time that the investigation was conducted. The PSD curves resulting from analysis of samples #5, #4 and #1 are shown in Fig. 9. High contents of coarse grains and gravels in samples #1 and #4, 20.3 and 12.8 kg, respectively, were weighed to analyze the PDS to minimize the human interference factors. After complete softening, 1.3 kg of sample #5, strongly-weathered soft marlite, was weighed, and soaked in water, to analyze the PDS.

Particle size distribution curves of samples #1, #4 and #5
-
1.
From the upper part to the lower part (#5 → #4 → #1) of the landslide, content of coarse grains and gravels increases gradually. It means during the intensity deformation process, the neighbouring crack rock mixed into main slip zone, in the middle; and in the lower parts of the landslide, content of gravels is higher, which indicates stronger dynamic activates.
-
2.
It is obvious in samples #1 (sliding soil) and #4 (saturated weak interlayer) that the grains of 2 mm in diameter show significant threshold characteristics and there are only very few particles between 1 and 2 mm. Compared with the PSD curve of sample #5, the grain diameters of nearly all particles in the soft grey–green marlite were less than 2 mm, with 99.42 % of the grain diameters less than 1 mm. From this viewpoint, the range of 1–2 mm seems to be the common threshold particle size for these three samples. This is the common feature of these 3 samples. To verify whether the particles smaller than 2 mm in samples #1 and #4 were from grey–green marlite, the PSD curves for the particles smaller than 2 mm are spatially shown in Fig. 10. The common characteristics of PSD for samples #1, #4 and #5 are distinct. Spatial distributions for samples #1 (sliding soil) and #4 (saturated weak interlayer) lie in the middle and the lower parts, due to the more thorough weathering and water–rock (soil) interaction process, as mentioned above. Therefore, the PSD curves of the particles smaller than 2 mm are more appropriate.
Fig. 10 
Particle size distribution curves of samples #1, #4 and #5 (for particles < 2 mm)
-
3.
The content of the clay particles (< 0.002 mm) within the particles smaller than 0.075 mm of samples #1, #4 and #5 was 43.6, 37.5 and 28.9 %, respectively. Compared with the XRD results of samples #1, #4 and #5 in Table 2, the content of the clay minerals is consistent with the percentage of clay particles, which verifies the evolution order of #5 → #4 → #1.

According to the analyses in this section, the main bad geological elements in Huangtupo riverside landslide have undergone water–rock (soil) interaction, with obvious migration and enrichment of clay minerals. Based on the analyses of mineral content, chemical composition and grain size distribution features for the ten samples, three evolution clues have been found, verifying the homology hypothesis and analysis of sample data.
Water–rock (soil) interaction mechanisms in the landslide
The effect of groundwater on the structure of rock–soil
The pH values of groundwater samples were 8.05–8.50, i.e. slightly alkaline, with main cations of Ca2+ (75.2 %) and K+ (18.2 %), and anions of \({\text{HCO}}_{ 3}^{ - }\) (60.3 %) and \({\text{SO}}_{ 4}^{ 2- }\) (27.9 %), which made the groundwater HCO3–Ca type water, containing erosive CO2, with total salinity of 349.4 mg/L. The calcium carbonate contents of all samples shown in Table 2 range from 20 to 80 %. According to the research carried out by Hseung and Hsu (1964), when the content of calcium carbonate is high, the pH value of groundwater is dominated by hydrolysis of calcium carbonate. As the pH values of groundwater were about 8.05–8.50, slightly alkaline, the hydrolysis of calcium carbonate is shown as Eq. 2 below.
Researches on the groundwater of Huangtupo landslide have already been carried out by Wen and Aydin (2005) and Wen and Chen (2007), showing that the Ca2+ in groundwater did not reach saturation. Therefore, the slow runoff of the groundwater combined with the erosive CO2 would presumably have strongly dissolved the pelitic limestone and marlite of T2b3, which can be summarized as Eq. 3.
Equations 2 and 3 reflect the chemical reaction processes of CaCO3 under good drainage conditions and in the shallow part of the landslide, respectively. In environments with good drainage channels, such as continuous rock fractures and the vicinity of the slip zone, the positive reaction of Eq. 2 is dominant. In the upper part of the landslide, where groundwater activities are not strong, and in the pelitic limestone and marlite of T2b3 which have high content of clay minerals and are relatively impermeable layers, the water–rock (soil) interaction takes a long time and the process should be very complete. So the positive reaction of Eq. 3 is dominant. If the groundwater flow is blocked, with the increasing concentration of CaCO3 in the region, the reverse reaction of Eq. 3 would occur.
The second evolution path (samples #10 → #3 → #9 → #2) was selected to make a case study on water–rock (soil) interaction mechanisms. Detailed photos for slightly dissolved marlite (sample #10) are shown in Fig. 11. Pictures A and B show the normal state of sample #10, in which the structure of primary calcite veins and marlite particles is integral and compact. Pictures C, D and E spatially show the water–rock interaction mechanism in sample #10. In the analysis of the calcite veins in C and D, the group of calcite veins which is nearly vertical was a secondary one. The nearly horizontal group of calcite veins was cut by the nearly vertical group, with consistent fault distances from the left to the right (picture D). These phenomena suggest that the vertical group are rock fissures which developed right after the water–rock interaction, with the calcite being dissolved from the rock mass and then deposited in the rock fissures (the reverse reaction of Eq. 3). Furthermore, compared with the secondary calcite vein (picture E), the primary calcite vein (picture B) was better crystallized.

The slightly dissolved marlite and calcite veins in rock mass
Figure 12 presents in detail the photos of intensely dissolved marlite (sample #3), which is located in a place with strong groundwater activities. Pictures A and B show the normal state of sample #3, suggesting that it has been strongly dissolved, as the eroded micro-cavities are spread all over the rock mass (the black dots in picture B). According to the analyses of the calcite veins in the rock mass in pictures B, C and D, we find that in the interface between the calcite vein and the marlite, which is a relatively permeable interface, the well-crystallized primary calcite was completely dissolved, while the primary calcite crystals in the center were less dissolved. In some parts, the calcite veins have been completely dissolved, forming continuous interstices which finally became the seepage paths in the rock mass (the positive reaction of Eq. 2). The former interface between calcite vein and marlite was attached again by the precipitated CaCo3 (pictures C and D), during which the reverse reaction of Eqs. 2 and 3 occurred.

The intensely dissolved marlite and the calcite crystal veins in the rock mass
This process and mechanism of dynamic dissolution can be simplified as the model of the laminar water flow in a pipe. Marlite layers on both sides of the calcite crystal veins are relatively impermeable in that their permeability nearly equals zero. The groundwater was abundant in Ca2+ and HCO3, and if the permeability was less than a certain value with a slow seepage supply of a high concentration of dissolved liquid stemming from marlite, the reverse reaction of Eqs. 2 and 3 would cause CaCo3 to precipitate and attach to the interfaces of the calcite veins and marlite. In the central part of a calcite vein, where the permeability is higher, dissolution plays the dominant role, making the calcite gradually dissolve. Figure 13 shows a sketch map of the water–rock interaction mechanism in a calcite vein.

Sketch map of water–rock interaction in calcite vein in marlite
These kinds of water–rock interaction are harmful to the stability of the landslide, because the original structure of rock mass is destroyed and the mechanical strength will decrease. Figure 14 shows the SEM (scanning electron microscope) images of the intensive dissolved marlite (sample #3). As shown in Fig. 14a, the structure of marlite in the upper part was loose, similar to the vesicular structure in eruptive rocks, resulting from long-term slow dissolution under the positive reaction of Eq. 3. In the lower right corner was the precipitated CaCo3 along the interface of a calcite vein and marlite. As shown in the magnification of the structure of marlite in Fig. 14b, the calcium skeleton in the rock mass was almost dissolved, forming many eroded micro-cavities. Although some calcite crystals still remained, suspended in the eroded micro-cavities, they basically lost the supporting role for the structure of rock. During the construction process of the test tunnel, some more typical phenomena of water–rock interaction were revealed, as Fig. 15 shows. Figure 15a shows many small solution cavities along the rock fractures. The rock layer on the left side is sample #10 and on the right side is sample #3, and they clearly reveal this evolution process. In addition, as Fig. 15b shows, some bigger solution cavities have also developed in a similar layer.

SEM images for the intensely dissolved marlite

The intense dissolution phenomenon in the marlite layer (in test tunnel)
Changes in the physical and mechanical properties of rocks and soils will directly affect the stability of a landslide Xu et al. (2005a, b). Samples #10, #3, #9 and #2, which had the same evolution characteristics, were selected to make a dynamic comparison. A number of physical and mechanical tests were then carried out, including basic physical property tests, acoustic wave measurements and uniaxial compressive strength tests for rock samples. The test results are listed in Table 5.
According to the test results, the tendency of the mechanical properties towards deterioration:
-
1.
After experiencing the intensive water–rock (soil) interaction, the dry densities of #10 → #3 → #9 were reduced from 2.47 g/cm3 (slightly dissolved marlite) to about 1.68 g/cm3 (soft argillization interlayer),which means a loss of about 30 % density compared with slightly dissolved marlite (sample #10).
-
2.
Compared with the slightly dissolved marlite, the uniaxial compressive strength of the intensely dissolved marlite decreased to around 85 %, and its wave velocity also dropped significantly, indicating the gradual loss of cementation.
-
3.
Figure 16 is the SEM image of the soft argillization interlayer (sample #9). Compared with Fig. 14b, there was nearly no calcite crystal in sample #9, in which the re-distribution of internal stress made the structural arrangement of the clay minerals closer. During the deformation process of the landslide, gravels mixed into the soft argillization interlayer to form sliding soil. So the density of sliding soil (sample #2) is higher than that of sample #9.
Fig. 16 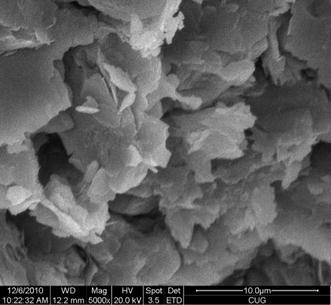
SEM image of soft argillization interlayer (magnification: 5000)

The effect of clay minerals on landslide under the conditions of water–rock (soil) interaction
The influence of groundwater processes on the rock mass destroyed the rock structure and reduced the strength of the rock and soil. On the other hand, after dissolving a large number of calcite crystals in the rock mass, the structure of rock mass become looser, the relative clay mineral content increased rapidly, meanwhile, it also create more smooth paths for groundwater flow and accelerating the migration and accumulation of clay minerals.
According to Tang et al. (2003), clay particles determine the total strength of soils if the clay particle (grain diameters <0.005 m) content reaches 30 %.
The clay particle content of sliding soil (samples #1 and #2), soft argillization with grey–green interlayers (sample #4) and soft argillization with yellow interlayers (sample #9) is 12.18, 13.60 and 24.10 %, respectively. Referring to the standard mentioned above, the strength of sample #9 is determined by clay minerals.
The researches of Xu et al. (2009) and Jiang et al. (2011b) revealed that, for soil–rock mixture such as sliding soil, the mechanical strength is dominated by the strength of fine granules if the coarse granule (grain diameters >2 mm) content less than 30 %. As shown in Fig. 9, the gradation of samples #4 and #1 was poor. The coarse granule content of sample #4 is 30.40 %, which means its strength is determined by fine granules (grain diameters <1 mm). Although the coarse granule content of the sliding soil was about 45.50 %, a very few big blocks of gravel are contained in it as “hanging rocks”, according to the actual situation of particle size distribution tests for about 12 % of all the samples (about 2.5 kg). Figure 17 shows (A the section map of the slip zone and B) the CT (computational tomography) scanning image of the inner structure of intact sliding soil with distinct “hanging rocks” inside of which the effect on the total strength of the sliding soil was limited. The actual effective content of the coarse granules is about 35 %, and the strength of the sliding soil is mainly determined by the fine granules.

The “hanging rocks” in the slip zone
In the fine granule part (grain diameter <1 mm), the clay particles content of the sliding soil and soft argillization with grey–green interlayers is 20.20 and 17.40 %, respectively. According to Table 2, the content of smectite and illite, which are more harmful to the soil strength (Yan et al. 2002), is very high. Therefore, the effect of clay minerals on the development of the landslide should not be ignored.
Concerning the migration and enrichment of the clay minerals along the slip zone, Shuzui (2001) suggested that the more severe the deformation of the slip zone experienced, the higher the clay mineral content would be in the slip zone. In this research, the clay mineral content in the front part of Huangtupo riverside landslide was much higher than that of the rear part. According to the monitoring data, the deformation in the front part was also more severe than in the latter, indicating the close relationship between landslide deformation and clay mineral content.
Conclusions
According to the dynamic tracing research with ten typical samples, the water–rock (soil) interaction in Huangtupo riverside landslide definitely developed during the geologic evolution. The following main conclusions can be summarized by analyzing the mechanism of water–rock (soil) interaction influencing the dissolution of the rock structure, the relationship between clay minerals, and the development trend of the landslide as the effect of water–rock (soil) interaction.
-
1.
Based on the analyses of the mineral content, chemical composition and grain size distribution features for the ten samples, the evolution paths of chemical weathering (dynamical water–rock (soil) interaction) within the landslide were determined, three evolution paths were found, which reveal the formation process of sliding soil and how the weathering soil reaches to the deeper parts.
-
2.
The intensive dissolved marlite, which was caused by groundwater flow, reflects significant water–rock (soil) interaction. Take an example for the yellow marlite, the evolution process can be divided into four stages by the changing of rock structures: (1) slight dissolving, (2) intense dissolving, (3) soft argillization interlayer, and (4) sliding soil.
-
3.
Water–rock (soil) interaction destroyed the original compact structure of rockmass and accelerated the migration and accumulation of clay minerals. In the bad geological elements, the clay mineral content was much higher in the front part of Huangtupo riverside landslide than in the rear part. Therefore, the effect of clay minerals on the development trend of landslide should not be ignored.
This research systematically probed the water–rock (soil) interaction mechanism in the Huangtupo riverside landslide, which can provide some references for the exploration of potential sliding surfaces and the formation process of this landslide. Furthermore, it is also a good way to explain the monitoring data of landslide deformation rationally.
In fact, this research method is not only limited to Huangtupo landslide. As the most famous sliding stratum in TGR, many large-scale landslides are located on Badong group, Triassic system (T2b), such as Zhaoshuli landslide (Liu et al. 2001) or Hongshibao landslide (Luo et al. 2008). In addition, not only for T2b but also for other landslides, the underlying stratum is easily dissolved by ground water (marlite, calcareous marl and so on), and if the groundwater runoff is intensive enough, the research method presented in this paper can be applied to determine the deformation mechanism and the trend of a landslide.
References
Beaucaire C, Michelot JL, Savoye S, Cabrera J (2008) Groundwater characterisation and modelling of water–rock interaction in an argillaceous formation (Tournemire, France). Appl Geochem 23(8):2182–2197
Chigira M, Oyama T (1999) Mechanism and effect of chemical weathering of sedimentary rocks. Eng Geol 55:3–14
Deng QL (2000) Slope deformation structure. China University of Geosciences Press, Wuhan (in Chinese with English abstract)
Deng QL, Zhu ZY, Cui ZQ, Wang XP (2000) Mass rock creep and landsliding on the Huangtupo slope in the reservoir area of the Three Gorges Project, Yangtze River, China. Eng Geol 58:67–83
Fitz-Diaz E, Hudleston P, Siebenaller L, Kirschner D, Camprubi A, Tolson G, Puig TP (2011) Insights into fluid flow and water-rock interaction during deformation of carbonate sequences in the Mexican fold-thrust belt. J Struct Geol 33(8):1237–1253
Hseung Y, Hsu CC (1964) Frequency distribution of clay minerals in the soils of China. Acta Pedol Sin 12:266–274 (in Chinese with English abstract)
Jian WX, Wang ZJ, Yin KL (2009) Mechanism of the Anlesi landslide in the Three Gorges Reservoir, China. Eng Geol 108:86–95
Jiang JW, Ehret D, Xiang W, Rohn J, Huang L, Yan SJ, Bi RN (2011a) Numerical simulation of Qiaotou Landslide deformation caused by drawdown of the Three Gorges Reservoir, China. Environ Earth Sci 62:411–419
Jiang JW, Xiang W, Zhang XY (2011b) Research on mechanical parameters of intact sliding zone soils of Huangtupo landslide based on CT scanning and simulation tests. Chin J Rock Mech Eng 30:1025–1033 (in Chinese with English abstract)
Li SD, Li X, Zhang NX, Liu YH (2006) Water-rock interaction of clay gouged intercalation sludging process of Baota landslides in Three Gorges Reservoir area. Rock Soil Mech 27:1841–1846 (in Chinese with English abstract)
Li SD, Li X, Wu J, Liu YH (2007) Evolution process and pattern of sliding zone in large consequent bedding rock landslide. Chin J Rock Mech Eng 26:2373–2480 (in Chinese with English abstract)
Liu S, Zhang SX, Li JF (2001) Investigation of a landslide in the new site of Badong County by integrated geophysical survey. Sci China Series D-Earth Sci 44(5):426–436
Liu XR, Fu Y, Wang YX, Huang LW, Qin XY (2008) Deterioration rules of shear strength of sand rock under water–rock interaction of reservoir. Chin J Geotech Eng 30:1298–1302 (in Chinese with English abstract)
Locsey KL, Grigorescu M, Cox ME (2012) Water-rock interactions: an investigation of the relationships between mineralogy and groundwater composition and flow in a subtropical basalt aquifer. Aquat Geochem 18(1):45–75
Lucas Y, Schmitt AD, Chabaux F, Clement A, Fritz B, Elsass P, Durand S (2010) Geochemical tracing and hydrogeochemical modelling of water-rock interactions during salinization of alluvial groundwater (Upper Rhine Valley, France). Appl Geochem 25(11):1644–1663
Luo HM, Tang HM, Zhang GC, Xu WY (2008) The influence of water level fluctuation on the bank landslide stability. Earth Sci J China Univ Geosci 33:687–692 (in Chinese with English abstract)
Mohamed AMO (2000) The role of clay minerals in marly soils on its stability. Eng Geol 57:193–203
Seodon J, Eberl DD (1989) Illite. Rev Mineral 13:495–544
Shao HB, Ray JR, Jun YS (2010) Dissolution and precipitation of clay minerals under geologic CO(2) sequestration conditions: CO(2)-brine-phlogopite interactions. Environ Sci Technol 44(15):5999–6005
Shen ZL, Wang YX (2002) Review and outlook of water–rock interaction studies. Earth Sci J China Univ Geosci 27:127–133 (in Chinese with English abstract)
Shuzui H (2001) Process of slip-surface development and formation of slip-surface clay in landslides in Tertiary volcanic rocks, Japan. Eng Geol 61:199–219
Tang LQ, Nie DX, Ren GM (2003) The relational analysis between the clay grain content and strength characteristics of weak intercalated layer. Chin J Geol Hazard Control 14:56–60 (in Chinese with English abstract)
Wang GX, Xu JL, Liu GD, Li CZ (2007) Landslidology and landslide control technique. China Railway Publishing House, Beijing, pp 140–152 (in Chinese with English abstract)
Wen BP, Aydin A (2005) Mechanism of a rainfall-induced slide-debris flow: constraints from microstructure of its slip zone. Eng Geol 78:69–88
Wen BP, Chen HY (2007) Mineral compositions and elements concentrations as indicators for the role of groundwater in the development of landslide slip zones: a case study of large-scale landslides in the Three Gorges area in China. Earth Sci Front 14:98–106 (in Chinese with English abstract)
Xu ZM, Huang RQ, Fan ZG (2005a) Water-rock interaction in process of landslide preparing and triggering. J Nat Disasters 14:1–9 (in Chinese with English abstract)
Xu ZM, Huang RQ, Tang ZG, Wang SD (2005b) Clay minerals and failure of slopes. Chin J Rock Mech Eng 24:729–740 (in Chinese with English abstract)
Xu WJ, Hu RL, Yue ZQ (2009) Development of random mesostructure generating system of soil-rock mixture and study of its mesostructural mechanics based on numerical test. Chin J Rock Mech Eng 28:1652–1665 (in Chinese with English abstract)
Yan CJ, Tang HM, Chen JY, Sun YZ (2002) Studies of soil in microstructures and compositions slipping zone in reservoir district of Three Gorges Project. Rock Soil Mech 23(supp):23–26 (in Chinese with English abstract)
Zhu C, Lu P (2009) Alkali feldspar dissolution and secondary mineral precipitation in batch systems: 3. Saturation states of product minerals and reaction paths. Geochim Cosmochim Acta 73(11):3171–3200
Acknowledgments
This study was carried out in the framework of the bilateral cooperative project of China University of Geosciences (Wuhan) and Friedrich-Alexander-University Erlangen-Nuremberg (Germany). The authors gratefully acknowledge the financial support of the German Centre for Aviation and Space Travel (DLR), the International Bureau of the German Federal Ministry of Education and Research (BMBF) and the Three Gorges Research Center for Geo-hazard, Ministry of Education.
Author information
Authors and Affiliations
Corresponding author
Rights and permissions
About this article

Cite this article
Jiang, Jw., Xiang, W., Rohn, J. et al. Research on water–rock (soil) interaction by dynamic tracing method for Huangtupo landslide, Three Gorges Reservoir, PR China. Environ Earth Sci 74, 557–571 (2015). https://doi.org/10.1007/s12665-015-4068-5
Received:
Accepted:
Published:
Issue Date:
DOI: https://doi.org/10.1007/s12665-015-4068-5