
Abstract
Traditional situational awareness services in disaster management are mainly focused on the institutional warning response and not fully exploit the active participation of citizens involved. This paper presents an advanced system for emergency management (ASyEM) which fuses the potentiality offered by mobile social data and bottom-up communication with smart sensors. The proposed architecture model is organized into four different layers: (1) sensor, (2) local transmission, (3) network and (4) management. ASyEM is able to capture and aggregate two different kind of data: (a) user generated content produced by citizens during or immediately after the disaster and shared online through socio-mobile applications and (b) data acquired by smart sensors distributed on the environment (i.e., intelligent cameras, microphones, acoustic arrays, etc.). Data are selected, analysed, processed and integrated in order to increase the reliability and the efficiency of whole situational awareness services, localize the critical areas and obtain in this way some relevant information for emergency response and completion of search and rescue operations.
1 Introduction
In disaster studies the majority of the existing communication-oriented research is focused on the institutional warning response process and, above all, on the idea that catastrophes “are the affairs of the public authorities rather than the affairs of citizens” (Gilbert 1998). In case of disaster citizens have usually been considered as people to be rescued rather than active participants, but nowadays the widespread adoption of digital media and the production of content by ordinary people have marked a significant change in the study of disaster context and allowed analysis of the tragedy from a completely new perspective: that of citizens involved. Thanks to the use of blogs, social networking sites, and video/photo-sharing applications, a large number of citizens are able to produce, upload and share content related to the impact of the disaster, the emergency response, the search and rescue operations, the restoration phase, etc. User generated content (UGC) modifies the coverage of crisis events and helps to obtain more timely reporting and up-to-date information than traditional media (Conklin and Dietrich 2010; Goolsby 2010). The bottom-up communication practices related to their adoption accelerate information flows and contribute to communities empowerment, even if the content produced and shared online sometimes could be incorrect and need accuracy and validation.
If in ordinary contexts the web 2.0 applications allow people to participate in social and political life, challenging traditional hierarchies in media systems and changing how access to information is regulated, in extraordinary contexts they allow to spread and get real-time information, supporting in this way the emergency response (Bruns et al. 2012; Earle et al. 2010; Sweetser and Metzgar 2007; Meier 2013) and contributing to self-organize, recover and strength public resilience to catastrophe (Guy et al. 2010; Farinosi and Micalizzi 2013). Furthermore, the grassroots information generated by ordinary people can accelerate impact evaluations and needs assessments at the hyper local level (Baudry 2008; Kinsella et al. 2011) so it is pivotal to exploit the online material and to develop a geo-accurate system, based on situational awareness collaboration (Pringle 2009; Neuvel et al. 2012), that embeds social media in traditional emergency services (Heinzelman and Waters 2010).
In this paper, an advanced system for emergency management (ASyEM) is presented. It is based on an innovative two-way communication architecture that combines content produced by citizens involved in the disaster with data generated from sensors located in a specific area.
The architecture of ASyEM is built mainly to address the following functional requirements:
-
To collect geo-referenced multimedia data from multiple sensors, such as infrastructure sensors (e.g. video cameras, microphones, etc.) or from social media applications (e.g.: Twitter, Facebook, etc.).
-
To process locally rough data acquired by infrastructure sensors and fuse them through the JDL fusion model (see Sect. 6);
-
To communicate data on detected events via a high-speed wireless communication network to a unified operative centre (UOC);
-
To integrate different multimedia data into the UOC;
-
To collect on demand additional data (e.g. short video and audio sequences) using unmanned aerial vehicles (UAVs);
-
To share targeted information among different executive monitoring units.
The paper is structured as follow: Sect. 2 reviews the state-of-art; Sect. 3 presents the architecture of the proposed system. In Sects. 4, 5 and 6 the management of the sensors and the use of UGC are illustrated. In Sect. 7, the applied data fusion techniques are presented. Finally, in Sect. 8 experimental results are discussed.
2 Emergency management at the time of socio-mobile media
The last few years have seen an explosive growth in the adoption of social media in all kind of catastrophic events, from the 2010 Haiti earthquake to the 2012 Sandy hurricane. Large scale use of web 2.0 platforms and, in particular, of socio-mobile applications by ordinary people and access to timely and consistent information and content generated by citizens in inaccessible areas represent a great opportunity for emergency management stakeholders and agencies (Meier 2013). To valorise and exploit grassroots data, it is crucial to design an advanced architecture able to collect, select, process and integrate data produced by citizens with data acquired by sensors already present on the environment in order to support institutions when responding to a specific event. Nevertheless, it is required to combine multimodal real-time big data into actionable situation specifically to model and recognize emergency events (Singh et al. 2012).
While traditional media facilitate one-way dissemination, social media offer opportunities for two-way dialogue and interaction between citizens and emergency organizations (Bortree and Seltzer 2009). Furthermore, especially when official sources provide relevant information too slowly (Spiro et al. 2012), people turned to social media in order to obtain time-sensitive and unique information (Kavanaugh et al. 2011; Kodrich and Laituri 2011; Sutton et al. 2008; Caplan et al. 2007; Stephens and Malone 2009). As explained by Fraustino et al. (2013) “oftentimes, individuals experiencing the event first-hand are on the scene of the disaster and can provide updates more quickly than traditional news sources and disaster response organization”. In this sense some scholars used the definition “citizens as sensors” (Goodchild 2007; Schade et al. 2010), as non-specialists creators of geo-referenced information that contribute to crisis situations awareness. Previous studies have shown that socio-mobile applications in emergency contexts can be useful not only to facilitate the search for information, but also to maintain a sense of community and human contact (Farinosi and Micalizzi 2013). Moreover this kind of applications can help people to organize emergency relief and self-mobilize from both near and afar (Starbird and Palen 2010, 2011, 2012; Farinosi and Treré 2010).
Recent progress in low cost, high performance computing networks and in the possibility of digital communications on heterogeneous, mobile and fixed broadband networks (Abad et al. 2012; Kim 2009; Hofstee 2005; Pande et al. 2005) have allowed both an easy digital interaction between citizens and infrastructures and the availability of large amount of multimedia data coming from multiple heterogeneous sensors deployed on the environment or managed by non-professional users directly involved in the disaster. In literature there are several multimedia systems for collaborative emergency response operations in disaster-affected areas but in the majority of cases they focused only on the “top-down” communication and do not take into account the new possibilities offered by socio-mobile media and “bottom-up” communication (Kanchanasut et al. 2007; Jang et al. 2009).
In Kanchanasut et al. (2007), for example, it is presented an emergency communication network platform, called DUMBONET, based on a hybrid combination of mobile ad hoc networking (MANET) and a satellite IP network operating with conventional terrestrial internet. It is designed for collaborative simultaneous emergency response operations deployed in a number of disaster-affected areas. In Jang et al. (2009), a MANET based communication platform and a rescue information system for earthquake disasters that can support a large number of rescue under catastrophic natural disasters is described. The aim of the system is to overcome the infrastructure network problems that can paralyze the entire communication systems as occurred in Jiji/Taiwan earthquake.
The artificial emergency-logistics-planning system (AELPS) has been designed to help government and disaster relief organizations prepare for and manage severe disasters (Li and Tang 2008). AELPS can form the basis of a complex computational platform that generates logistics phenomena during disaster relief and gives intuitive results that can be used in emergency-logistics planning.
The SoKNOS system (Paulheim et al. 2009) allows operation with various and heterogeneous information sources and enables emergency organizations to collaborate in an efficient way, putting special emphasis on usability. It combines different methods for visual analysis, aggregation, and generalization that work on an entirely consistent information basis and address a large range of tasks relevant for emergency management, such as information integration, visualization and interaction. In Brunner et al. (2009) it is illustrated a way to collect geospatial feature data from distributed sources and integrate them in visualization and image processing in order to support collaborative and rapid emergency response. The system enables rapid collaborative mapping and supports customized on-demand image processing, and geospatial data queries.
As emerged from this brief prospectus, the systems presented in literature have at least two main limitations: (1) they are addressed only to professional users and, also when they are based on a collaborative platform, usually the collaboration is between the different institutions that manage the emergency response and not between institutions and population involved in the disaster; (2) they do not take into account the grassroots participation by the citizens and, above all, they are not based on a system for two-way communication. All the systems developed so far are in fact mainly based on one-way communication, where the government institutions play a central role in the emergency response. There are no systems able to collect data created from the bottom and aggregate them in different ways for automatic interpretation of events. ASyEM aims to overcome these limitations, combining data generated through socio-mobile applications with data generated by infrastructure sensors and creating in this way an innovative system for emergency response. Thanks to ASyEM citizens will be actively involved in disaster management and social media and personal devices become an integral part of emergency response.
3 ASyEM: an advanced system for emergency management
This section presents ASyEM, an advanced system for emergency management based on big multimedia data. The main innovation of ASyEM is its ability to capture and aggregate two different kind of data: (1) user generated content (UGC) produced by citizens during or immediately after the disaster and shared online through social platforms and (2) data acquired by smart sensors (i.e., intelligent cameras, microphones, acoustic arrays, etc.) distributed on the environment. These data are collected, analysed, processed and integrated in order to obtain relevant information for emergency response and completion of search and rescue operations. The final goal is to provide “full digital” solutions to the functioning of emergency management systems, starting from the sensor level, to the presentation of integrated big multimedia information to the operators at the control centre.
The logical architecture of ASyEM (Fig. 1) is constituted by four layers: (1) sensor, (2) local transmission, (3) network and (4) management. In particular, at the sensor layer, input data are acquired from different kind of sensors and, at the local transmission layer, data are pre-processed (e.g., compressed, etc.), collected and passed to the network layer who is in charge of sending them to a remote control centre (Martinel et al. 2013). Finally, at the management layer, all sensor data are processed, fused and used to generate a situational awareness and suggest to the operators a planning of the emergency responses to be activated. Although the whole architecture has not been fully developed, a simplified model has been implemented and tested using real data acquired from past disaster events (for an in-depth description of the “high level data fusion” process, please see Sect. 6).

Logical architecture of the ASyEM system
The sensor layer is composed of three kind of different sensors: (1) environment sensors, distributed permanently on the environment; (2) mobile personal devices (smartphones, tablets, netbooks, etc.), which not only provide data that allow user’ localization, but can be used directly by individuals to produce and spread online grassroots information; (3) mobile system sensors, placed on-board to unmanned aerial vehicles (UAV) useful to inspect specific areas during or just after the disaster. At the sensor layer, multimedia data are acquired by distributed heterogeneous sources (Martinel et al. 2012). Data coming from distributed sensors are pre-processed and coded to save bandwidth resources at the local processing layer and routed at network level. The communication medium is normally represented by wireless LANs (e.g., IEEE 802.11g, IEEE 802.11n, etc.) or mobile digital devices (e.g. HDPSA for mobile phones) as well as broadband media such as optical fibres, coax cables or IEEE 802.16 WiMAX, which extends over 30 miles and allows a bandwidth of 50 Mbps (Foresti et al. 2001; Rinner and Wolf 2008). Data are finally sent to a unified operative centre (UOC) where an advanced support decision system can handle both emergencies and prevention to improve citizens’ safety (Snidaro and Foresti 2007) (Fig. 2).

Possible services provided by the UOC (Snidaro and Foresti 2007)
An active user-friendly interface is used to display multimedia data in an efficient way. This interface assists the operator by focusing his attention to a subset of interesting events. Data acquired from both environment and personal sensors are normally transmitted over open networks with multi-user access characteristics (Park et al. 1999).
Information and data generated at the control centre (e.g., sensor control parameters such as pan or tilt positions of a video camera, zoom-in or zoom-out commands, microphones sensitivity, etc.) must be also transferred to the sensor layer to produce a positive feedback on the acquisition process and to increase the quality of acquired data.
3.1 Environment and mobile system data
Environment sensors, e.g., optical and infrared cameras, microphones and/or acoustic arrays, etc. represent the most common sensors previously installed on the environment that can be used to acquire information from the area of the disaster. A subset of these sensors should be selected during the start-up phase from the whole set of available sensors on the environment (e.g., a city area, an airport area, etc.). Video sensors are the most common and allow to acquire large amount of data. These sensors are normally placed on street corners or on the front of a building, and they are generally static or with pan-tilt-zoom (PTZ) capabilities.
Mobile personal sensors are represented by smartphones, tablets or portable PC. The data produced by these devices are directly generated by people involved in the disaster and, thanks to the possibility embedded in the majority of these media, usually they are geo-located and give the position of the user in a quite accurate way.
Data sent over social mobile applications stay queued until delivered, unlike cell phone calls which often fail to go through especially when connections are overloaded. In state of emergency the adoption of applications based on web 2.0 principles allows to obtain distributed and detailed information, exploiting the so called “collective intelligence”. This information is related to the specific event, such as the current state of the affected area, the presence of dead, wounded or collapsed buildings, etc. Mobile system sensors are generally colour or infrared PTZ cameras placed on board to UAVs. These sensors acquire images or video of interesting areas from an orthogonal point of view that can be used for helping human operators in rescue operations (Waharte and Trigoni 2010). In Fig. 3a and b, an example of the deployment of different sensors and an example of cooperative UAVs for rescue operations are given.

Examples of a the deployment of environmental sensors and of b the use of UAVs for rescue operations
3.2 Grassroots data
Web 2.0 technologies offer people several ways to create and share online digital content. According to their features and characteristics it is possible to identify at least 5 categories of different applications, which provide practical benefits during the response phase and in the majority of cases include also location-referencing:
-
1.
Social networking sites (SNS): they represent the most popular category and include sites like Facebook or Google+. They allow people to construct a public or semi-public profile (Boyd and Ellison 2007) and share information, photos and/or videos to others in their networks. They represent a two-way communication system, where it is easy for the “public” to forward the content and to build a relationship with other members. They can be used not only for disseminating information but also for gathering or requesting specific things.
-
2.
Photo and video sharing platforms: this kind of web 2.0 applications allow not only to share rich multimedia information but also to create a sort of collective live streaming of the event based on the point of view of people directly involved in the tragedy. Among the most used sites are Instagram and YouTube.
-
3.
Blogs: they represent a way to disseminate more in-deep information and allow users to write articles on any subject and permit visitors to comment posts. They can embed rich content like photos or videos and have no text character limit but require a lot of effort, especially during the very early phase of the disaster and when people update them via mobile phone.
-
4.
Wikis: they allow the creation of online collaborative space where anyone can add, delete or modify content that has been placed on the website, including the work of previous authors. During emergencies this kind of platforms can be used in a variety of ways for content management and can be set up for specific topics, but is particularly useful to collect logistic information about needs and resource requirements, accommodations for people involved in the catastrophe and/or reports regarding a specific local situation (Fig. 4).
Fig. 4 
A screenshot from the wiki “disaster relief”—disasterreliefaustralia.wikispaces.com
-
5.
Mashup/mapping software: they allow information collection, visualization and interactive mapping. Usually this kind of applications make use of “social GIS data” and provide greater understanding of locations for people unfamiliar with the area, giving (at the same time) a good oversight of information. They are based on the concept of “crowdsourcing” and are fast and simple to update and easier to understand for non-professional users than traditional GIS maps. The richness offered by geospatial information enables to design and manage solutions through the application of geographic knowledge and to obtain effective geospatial and temporal data visualization (Fig. 5).
Fig. 5 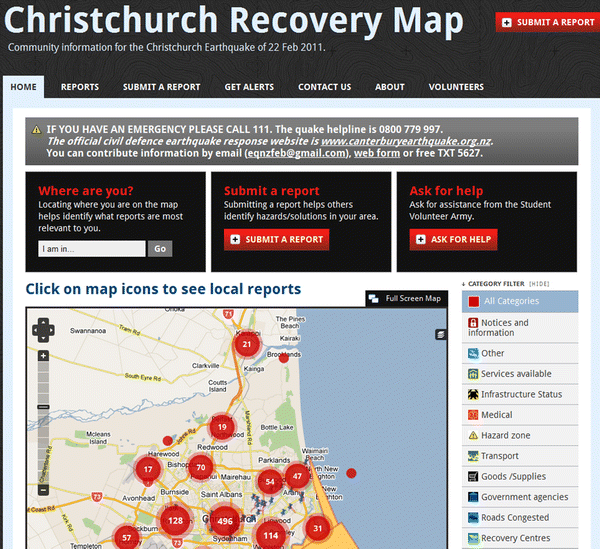
A screenshot of a recovery map from eq.org.nz, a web site realized after the 2011 Christchurch (New Zealand) earthquake


Recent disasters, such as 2010 Haiti earthquake, 2011 Japan tsunami or 2012 hurricane Sandy, have shown that due to their broad reach social media have become a go-to tool in emergency situations. In extraordinary contexts for people is easier to adopt applications they already know and use every day (such as Facebook, Twitter, etc.) rather than learn how to use new tools or specific social platform created ad-hoc for emergency management. In recent months, on the basis of this consideration, some systems that exploit the enormous flow of grassroots information have been developed. Among the most popular ones there are Twitcident, a filtering system that analyses Twitter messages in real time and extracts reliable updates and information for police, local authorities, emergency services and operators (Abel et al. 2012).
4 Analysis of data from environment sensors
Environmental sensors are physically organized in peripheral intelligent sensor networks, e.g., advanced networks with the capability to analyse and process the content of the acquired data, learn normal patterns of activity, do some simple reasoning and take some local decisions about anomalous events. The automatic capability to learn and adapt to changing scene conditions and the learning of statistical models of normal event patterns are emerging issues (Micheloni et al. 2010). Learning systems provide a mechanism to flag potentially anomalous events by discovering of the normal patterns of activity and flagging the least probable ones.
Data coming from environmental sensors (mainly video and audio signals) are locally processed in order to detect anomalous events (Fig. 6). Two levels of potential risks are associated to each anomalous event: high (e.g., an earthquake, a flood, a fire, etc.) and low risk (e.g. a collapsed building, a person to be rescued, etc.). The use of multiple heterogeneous sensors on the same monitored environment (e.g., a street, a square, etc.), but in different spatial locations (e.g., different corners) can increase the robustness and improve the performance of the whole system in terms of faster and more accurate event detection (Ferrin et al. 2011).

Data coming from environmental sensors are locally processed at sensor layer to detect anomalous events
Audio flows are processed in order to recognise unusual audio events in continuous audio recordings of public places (Cai et al. 2003). The applied algorithm is able to detect anomalous audio events when the distance of the current audio (built from acoustic data of a given environment) to a given model exceeds a predefined threshold. Environmental noise is subtracted from the audio during the acquisition process. First, different audio features such as short time energy, the first eight Mel-frequency Cepstral coefficients and the first two spectral statistical moments are extracted from short time [about 20 (msec)] audio frames with some overlapping ranging from 30 to 50 %. A set of audio signals characterizing specific natural catastrophes such as fires, earthquakes or floods is used to train a neural tree (Foresti and Micheloni 2002). The obtained network is used to classify audio signals acquired by environmental audio sensors to distinguish normal and abnormal situations.
Video flows are processed by a change detection algorithm in order to point out specific areas where objects are moving. The fast Euler numbers (FEN) algorithm (Snidaro and Foresti 2003) has been used. It has been chosen for two reason: (1) to reduce the computation complexity during the frames processing from O(hwg) to O(hw), where h and w are the images height and width and g is the number of possible thresholds; (2) to compute automatically the internal difference threshold. Nevertheless, during tests, the FEN algorithm did not require any adjustment in as much it has been able to detect large changes of the scene, therefore candidates to be anomalous respect to superfluous events.
When several areas of the image sequence acquired by sensor S k are moving contemporaneously (e.g., typical situation of an earthquake or of a flooding) an anomalous event is detected and an alarm with high level risk is generated by the same sensor. Whenever the sensor S k detects some small areas moving in the image sequence a potential anomalous event is detected and an alarm with low level risk is generated. Anomalous events associated with low level risk require further investigations by the high level modules of the system.
Anomalous events detected by video or audio sensors are processed at the sensor level to generate specific alarms. An alarm, generated by the sensor S k , is represented by a vector A k [p i ] containing multiple parameters p i such as the sensor Id, the sensor’s type [microphone, optical camera, IR camera], the coordinates [x,y] of the sensor’s position on a 2D map of the monitored area, the risk level [high,low], the timestamp of the event [T i ].
Each alarm is locally processed and a 2D alarm map (AMap) is continuously updated by the intelligent sensor network with data coming from the sensors placed in the reference area (Fig. 7). Spatial and temporal constraints are taken into account to update the alarm map.

An example of a possible distribution of alarms with high level risk coming from environmental sensors during the earthquake in L’Aquila (Italy)
Every time a new alarm is added to the AMap, the alarm vector A k [p i ] is inspected to find some time and spatial correlations between the current anomalous event and those previously detected with the same risk level. A first search is performed according with the timestamp associated to each alarm. For each alarm A k, the timestamp T k is compared with the timestamps T j of the most recent detected alarms with the same risk level into the AMap. The difference between the two times is threshold to find a temporal matching.
Let {(x, y) k1 , …, (x, y) k n } be the positions of the n alarms with the same risk level that are temporally correlated with the A k alarm. The corresponding multimodal histogram of such alarms suggests a representation described by means of a mixture of narrow Gaussians. In particular, to describe the probability distribution of the map positions (x j , y j ) of temporally closed alarms, we adopted a mixture of M Gaussians where the probability to observe an alarm \(A_{j}\) in a given region R k (a circular region with centre in the map position P k where the A k alarm has been detected) of the map is described by:
where M is the number of Gaussian distributions in the mixture, \(\omega_{i}\) is the weight given to the i-th Gaussian, and μ i and σ i are the mean and the standard deviation respectively. G is the Gaussian probability function given by:
Each alarm position \(P_{j}\) on the map is described by a mixture of Gaussians where the current value is represented by either one of the Gaussian or none. In the former case, the current value is used to update the model, while in the latter is used to reinforce the dangerousness of the alarm. Thereafter, if the higher level modules of the system assert that the current number of alarm is not too high, the new value is used to update the model. A given number of alarms is represented by the mixture if there exists a Gaussian that contains the value. Hence, if it is within kσ from the mean μ of one of the M Gaussians, where k is a per event/per Gaussian experimentally defined threshold (Micheloni et al. 2009), the mixture is updated as follows:
where α ∊ [0, 1] is the learning rate. High values penalize the i-th distribution which does not contains the value (e.g., ω i approaches to zero).
Once the temporal matching process is completed and the spatial correlations between the current alarm and the alarms with the same risk level that have been temporally matched are computed, a probability measure of the dangerousness of the alarms in the region R k is obtained in the following way:
where K is the number of sensors S i ∊ R k that have generated an alarm and N is the whole number of sensors S i ∊ R k
The regions where the above probability is greater than a predefined threshold (Foresti et al. 2001) are displayed on the 2D map of the monitored area with a red colour to focalize the attention of the operator. The intensity of the colour of the R regions which represents the area where a dangerous event has been detected is increased proportionally to the number of alarms generated by the environmental sensors located in that area, normalized to the whole number of sensors existing in the same area (Fig. 8). The R regions and the related alarm vectors A[p i ] are sent through to the network layer to the UOC.

The red elliptical areas represent the “R regions” where dangerous events have been detected by environmental sensors generating alarms with high level risk
A limit of ASyEM which is common to all real-world systems using intelligence functions is the lack of robustness, the inability to test and validate the systems under variety of real situations. Another limit is the ability to self-diagnose when the sensor data are not useful for a correct processing. For example, when video camera lens are affected by the rays of the sun, the video become useless for monitoring purposes. In these scenarios, it could be useful to have an automatic system diagnostic that alerts the operator at the UOC of the unavailability of the automated intelligence functions. In addition, the system should gracefully degrade in performance as the complexity of data increases. This represents a very open research issue that is crucial to the deployment of these systems.
5 Analysis of user generated data
As mentioned in Sect. 3, ASyEM analyses not only data coming from environmental sensors but also UGC shared by citizens on the most popular social platforms. In this regard the system uses a neural tree (NT) network (Micheloni et al. 2012) which after a training phase is able to determine and identify the type of emergency event using the most significant keywords extracted from users’ social posts (Fig. 9). In this respect, the first selection procedure of the vocabulary to perform the research is conducted on the basis of a manual search of the posts in order to identify the most important terms used by people during a catastrophic event. In this way, when a user write a post or upload a photo on a social platform (e.g. Twitter) using for example the hashtag #earthquake or other important specific keywords, as “disaster”, “flood”, “fire”, etc., the system is able to identify and collect the socio-mobile data, locating it on a map (Figs. 10, 11).

An example of tweets posted on Twitter some moments after an earthquake in NYC

An example of messages posted on Twitter during the recent 2009 earthquake in L’Aquila

The NT model used to analyse UGC. During the off-line phase detected keywords are clustered, while during the online phase clusters of keywords are used to classify an event
A reference example could be the recent 2009 earthquake in L’Aquila. From the surrounding area on April 6 after 03:32 AM people posted online status update like:
When an emergency event occurs, usually posts written by people contain some specific words related to the event itself. These words can be used to create a set of keywords useful to recognize and identify what is happening (in experimentation phases presented in Sect. 7, keywords were manually collected although in the future an automatic statistical approach could be adopted). Starting from this assumption we used a web crawler software appositely developed called ASyEM spider. The ASyEM spider is able to visit web sites, read and analyse the content of their pages and other useful information, such as the mark-up language (e.g. HTML), in order to find the established keywords and retrieve the associated content. The ASyEM spider is also able to analyse the content of an article posted in an online newspaper and search significant keywords to recognise a disaster event. For example, if in an article it finds words as earthquake, alarm, emergency, disaster, etc., and if these words appear a consistent number of times, it is plausible that the article refers to an earthquake rather than a flood.
Through the ASyEM spider, all the users’ posts published on social platforms can be carefully evaluated and the most important keywords can been detected. To perform this operation, ASyEM spider has been trained to analyse and retrieve the information in a period of time ranging from 5 to 15 min. This range was chosen considering several experimentation attempts. Finally, all extracted keywords are analysed by the NT algorithm that is able to detect and classify large sets of complex data separating emergency events from ordinary events.
Moreover, assuming that the majority of the information shared by users can be geographically localized, it is possible to classify all the keywords on the basis of a specific area. Therefore the physical “distance” among the information shared on the map is calculated, allowing to identify the area where the event is occurring.
The NT algorithm requires two different phases: a learning phase and a classification phase. The learning phase (off-line phase) is performed and the NT is built by training it with data acquired from previously occurred disasters. Then, the obtained NT is applied (on-line phase) to analyse the keywords extracted by the ASyEM spider just after the occurrence of a disaster and correctly classify the type of event.
In the off-line phase a supervised keywords classification is required. Past disasters (e.g. earthquake in L’Aquila, floods in Genoa, etc.), have been inspected and a keywords selection have been performed. Keywords have been classified considering the number of times they have been used to report the disaster. Regular expression techniques were used to avoid differences to uppercase and lowercase words or simple typos that can occur during the keywords detection process.
The probability that a post is classified as an emergency event increases with the number of post which are classified by the NT as generated during an emergency event. For example, if the 80 % of posts is classified by the NT as generated by an emergency event it is highly possible that an emergency event is occurring.
6 High level data fusion
While traditional ambient security systems were focused on the extensive use of arrays of single-type sensors (Monekosso and Remagnino 2007), modern systems aim to combine information coming from different types of sources. Multi-modal systems (Ross and Jain 2004), even more often used in biometrics, or multi-sensor multi-cue approaches (Liu et al. 2009) fuse heterogeneous data in order to provide a more robust response and enhance situational awareness. Nevertheless, other models relate to the relationship between situational awareness and numerous individuals and environmental factors (Endsley 1995).
A standard model for data fusion was proposed by the US Department of Defense to facilitate discussion, component reuse and system integration. The Joint Directors of Laboratories (JDL) data fusion model offers a multi-level functional model that describes how processing is organized in a military data fusion system. The JDL data fusion model is recognized as a de facto standard in data fusion and is likely to remain so for the foreseeable future.
According to the JDL Fusion model proposed by Llinas et al. (2004) and its revisions, a typical fusion problem can be defined as a complex integration process working on defined functional levels: (a) Level 0: signal assessment which extracts features from raw data; (b) Level 1: object assessment which gathers information about individual entities; (c) Level 2: situation assessment which focus the attention on the relationships between entities and contextual implications; d) Level 3: Impact assessment which assess consequences of applying known plans on the current situation; (e) Level 4: performance assessment which measures the performance and effectiveness of the system to facilitate refinement.
This model has been generalized and adopted in ASyEM. It has been chosen mainly because it is able to manage the whole system from controlling hardware resources (e.g. sensors, CPU, storage, etc.) to adjust the processing flow in order to optimize the system behaviour.
In ASyEM, the UOC receives from the sensor layer two kind of data: (1) 2D map areas and alarms autonomously detected by environment sensors, i.e., the R regions and the related alarm vectors, and (2) alarms and data received directly from operators or private citizens, i.e., the “virtual” sensors. A data fusion mechanism is applied at the UOC level to reach different objectives: (a) to increase the reliability and the efficiency of whole management system by increasing the quality of data; (b) to localize the critical areas in order to send one or more UAVs to acquire additional information; (c) to refine the intrinsic and extrinsic parameters of the sensors (i.e., sensor management process) to increase the quality of the acquisition process, e.g., to move a PTZ camera to better see a given target or the modify the aperture of a fixed camera to increase the focus on the observed target and (d) to modify the internal parameters of applied procedures and algorithms to improve the performance of the system that seeks to better manage, or coordinate, the use of a set of sensors in a dynamic, uncertain environment.
The JDL model can be adapted to the context of a given monitoring area and to the management of the resources for emergency responses. In ASyEM a typical urban scenario where multiple cameras monitor a wide area has been considered. The JDL scheme that has been applied is show in Fig. 12, where different levels correspond to specific tasks of the ASyEM system.

The proposed JDL model to monitor emergency situations
-
At level 0 (signal assessment) the raw data streams coming from the sensor layer are individually pre-processed. In particular, audio signals are filtered to reduced noise, video signals are processed to increase contrast and video resolution is scaled down to reduce the processing time.
-
At Level 1 (object assessment) the areas in the scene where alarms occur are analysed in order to extract info coming from both environment and personal sensors. Figure 13 shows an example of the distribution of the alarms on the 2D map of the monitored environment.
Fig. 13 
Displayed alarms coming from mobile personal sensors (i.e., small triangles with different colour) and the regions Rk (i.e., red ellipses) where dangerous events has been detected by environmental sensors (colour figure online)

The areas R k detected by environmental sensors and the alarms detected by mobile personal sensors, i.e., the virtual sensors, are the entities of the process, but no relationships are involved yet at this point. A fusion mechanism is now applied to integrate information contained in the alarms coming from mobile personal sensors M k . These alarms are represented by a vector \(V_{k} \left[{q_{i}} \right]\) containing multiple parameters q i such as the sensor Id [IP address, phone number, app ID], the data type [video, text, audio, internet content], the coordinates [x, y] of the sensor’s position on the 2D map of the monitored area, the risk level [high, low], and the timestamp of the event [T].
Additional constraints as, for instance, sensitive zones on the map, can be used at this stage as a priori contextual information.
-
At Level 2 (situation assessment), spatial or temporal relationships between entities are analysed: multiple alarms coming from environment and personal sensors sharing common time and spatial relationships can constitute interesting events to be taken into account. These regions are displayed to the operator at UOC level and sent to the decision support system for emergency management.
-
At Level 3 (impact assessment) a prediction of an event can be an example of what, in practice, may happen at this step. An estimation of a set of regions where anomalous events occurs can be a topic of this level.
-
Finally, at Level 4 (performance assessment), the emergency system can operate specific backtracking operations on data and procedures working at all the previous levels by using info on the events predicted by Level 3. For instance, the sensors can be relocated to better monitor a given region R, new thresholds can be selected for the procedures working at Level 0 or different algorithms can be employed at Level 1. For example, the UOC operators can translate mission plans or human directives, restricted to operator of policy forces or civil protection, into sensing actions directed to acquire needed additional or missing information in order to improve situational awareness and fulfil the objectives. One or more UAVs can be used to acquire additional information on critical areas.
In Fig. 14, some examples of a top view image acquired after the L’Aquila earthquake are shown.

Examples of top view images acquired just some time after the L’Aquila earthquake
ASyEM takes as input the current situation and the requests from the human operators which are working on the area of the disaster and performs a first breakdown of the objectives by trying to match them with the available services and functionalities. The system identifies also the areas to be monitored, the targets to look for, the frequency of measurements and the accuracy level. Moreover, the system recognises the sensors to be used among the available ones and redefined, if necessary, the coverage and the sensing modality. For example, depending on the time of the day a certain event is to be detected a sensor may be preferred to another, e.g., an IR sensor can be preferred during the night or with low illumination conditions. The purpose of this procedure is to optimize sensor parameters (Micheloni and Foresti 2009), e.g., for video sensors this may involve regulating iris and focus to optimize image quality.
7 Case of uses
Several experiments have been carried out to evaluate ASyEM. In Sect. 7.1 the ASyEM’s architecture and dataset used for testing are presented, while in Sect. 7.2 tests and experimental results are discussed.
7.1 Experimental scenario
ASyEM can be used whenever multiple sensors observe a scene and collect different data. Specific algorithm (see Sect. 7.2) analyses these data in real-time and a decision planning server tries to aware the situation. This way can be applied into different scenarios, such as flood, hurricane, volcanic eruption, fire, etc.
Figure 15 shows the subset of the ASyEM’s architecture which has been developed to demonstrate the feasibility of system. Environment sensors, mobile personal sensors and mobile system sensors send the acquired information to a remote control centre, where a decision planning server integrates the received data and classifies the events into two different classes: emergency event or normal situation.

The subset of the ASyEM’s architecture proposed in the experimental protocol. Client PCs communicate with the server through a 10 Mbps UHF radio link
Sensor data have been simulated using different 2.6 GHz PC clients (equipped with a MySQL database), full connected through a 100/1,000 Mbps LAN network. The decision planning server has been developed on a Linux server equipped with a 3.10 GHz processor with 6.00 GB of RAM. A 10 Mbps UHF radio link has been used to send data from sensors client PCs to the remote decision planning server.
Datasets used for experiments have been simulated using both information retrieved during past disaster events (e.g., video and audio registrations) and data appositely generated for these purposes. In particular, one audio and three video flows collected during the 2009 L’Aquila earthquake have been exploited. Mobile personal sensor data have been simulated using both a dataset of information generated for the specific purpose and existing web content (such as Twitter posts, etc.) retrieved from internet, filtered and stored in a database.
7.2 Tests and results
Several experiments have been carried out to evaluate ASyEM in the context of an emergency situation caused by an earthquake. Tests have been classified into two main groups: (1) tests performed during the event and (2) tests performed after the event.
The first set of tests would demonstrate the capability of ASyEM to autonomously detect an earthquake event. Some audio and video data recorded during the 2009 L’Aquila earthquake were used as input of the system. Instead, the second test set makes use of UGC from different social platforms (therefore after the event) to confirm the disaster event and locating its consequences on a top view map of the area.
In Figs. 16 and 17, few frames of two different real sequences acquired from environmental video sensors are shown. In particular, the frames in Fig. 16 have been acquired by an indoor camera placed into a supermarket, while the frames in Fig. 17 have been acquired by an external camera monitoring an outdoor public garden; the time delay from each pair of frames is about 250 ms.

A real sequence acquired during the L’Aquila earthquake by an indoor camera placed into a supermarket. a Two consecutive frames and b output of the change detection algorithm

A real sequence acquired during the L’Aquila earthquake by an outdoor camera monitoring an outdoor public garden. a Two consecutive frames and b output of the change detection algorithm
It is worth noting how several objects present in the scene are moving at the same time (e.g., all lights in the supermarket and in particular these on the right part of the scene). Figures 16b and 17b show the output of the change detection process (Snidaro and Foresti 2003): a large number of pixels on both images has been moved due to the earthquake event. An anomalous event is detected by a large subset of video sensors. An example of the parameter vector Ak[pi] of the alarms generated during the earthquake in L’Aquila by a CCD camera and by a microphone sensor respectively are the following:
The alarms generated by each environment sensor are analyzed and displayed on the 2D AMap: alarms that are spatially and temporally closed are used to update the alarm map (see Sect. 4) and consequently the probability measure of the dangerousness is computed. As a running example, we show the probability measure D of the dangerousness of the alarms generated in a region R i containing 3 CCD cameras and a microphone. All video sensors have been able to detect the earthquake, while the microphone was unable to detect any event. The following parameters have been used: K = 3 is the number of sensors belongs to the region R i that have generated an alarm and N = 4 is the whole number of the sensors in the region R i , mean μ = 4.7, standard deviation \(\rho_{1}=0.85\), \(\rho_{2}=0.56\) and \(\rho_{2}=0.3\), learning rate α = 0, 02. As reported by Eq. (1), P(A i ) represents the probability to observe an alarm A J in a given region R k . \(P\left({A_{i}} \right)\) values have been calculated by considering respectively the three weights \(\omega_{i}\), emerged from real experimental tests: ω 1 = 0.32, ω 2 = 0.65 and ω 3 = 0.84.
As the computed dangerousness is greater than a predefined threshold equal to 0.7, the region R i is boarded with a red elliptical line and displayed on the 2D AMap to focalize the attention of the operator. The alarm vectors \(A_{k} \left[p \right]\) (k = 1,…,3) generated by the three CCD cameras and the map position of the regions R i are sent thought the network layer to the UOC. The UOC receives from the sensor layer also the alarms with the related parameter vector directly from the mobile personal sensors represented by private citizens or public operators. As a running example, we show the alarm vector \(V_{k} \left[q \right]\) generated by a Twitter message some moments after the earthquake.
All the messages received around 03:32 AM indicate that citizens living in the area felt a strong earthquake and several aftershocks and the system was able not only to capture the text written and shared on Twitter by the people but also to record the data regarding their location and the exact time at which the tweet was posted online. All these different parameters have been imported by our system architecture and displayed on the map.
In Fig. 18a, the percentage of the most used reference keywords is presented. Results show that, considering the analysis of about 100 messages posted on Twitter, the most used keywords were earthquake (72 %) followed by collapse (16 %), shake (8 %) and magnitude (4 %). Moreover tests on the applied neural tree (Fig. 18b) show how about 84 % of emergency events were correctly classified considering the type of the event (e.g. earthquake, flood etc.). Only 11 % failed to be classified and 5 % of events resulted as not classifiable.

a Percentage of the most used keywords during the 2009 earthquake in L’Aquila; b success rate of the applied neural tree
Finally, the alarms coming from both environment and mobile personal sensors sharing common time and spatial relationships can constitute an interesting event to be taken into account at UOC level. The regions where interesting alarms have been detected are displayed to the operator and sent to the decision support system for emergency management. The UOC operators can define specific mission plans to human operators of Policy Forces or Civil Protection, modify the internal parameters of environmental sensors to acquire additional or missing information in order to improve situational awareness and activate one or more UAVs to acquire additional images on critical areas.
8 Conclusions and future proposals
The results emerged from our test scenario are promising. Taken together, the data generated by environmental sensors (optical and infrared cameras, microphones, etc.) and the data generated by citizens via socio-mobile applications were able to provide an accurate visualization of the disaster in L’Aquila which reflects at the same time both the damages to the building and people. Differently to other platforms for emergency management, ASyEM allows citizens involved in the earthquake to be active in all the emergency phases. Thanks to socio-mobile media, from the immediate rescue phase to the long-term recovery process, they could spread relevant information about some hyper local situations and cooperate in this way with the public authorities in the emergency response. The grassroots communication practices combined to a sophisticate intelligent sensor network create a sort of “peer-to-peer” emergency platform, that provides up-to-date information and can be used to coordinate relief and volunteer efforts through social applications. ASyEM increases the efficiency of the traditional software for emergency management and allows to localize the critical areas in order to send one or more UAVs to acquire additional information.
Nevertheless, some limitations occurred during the test phase of the system have prevent us to reach more accurate results. Video and audio registrations were retrieved from the internet and only after some editing operations they have been adapted to our purposes. Other limitations of the proposed system are represented by a small number of involved real sensors, the use of local networks of reduced size to collect sensor data and the use of a single network to send data from sensors to the remote control centre.
Moreover, since ASyEM is “open”, in the future it will be possible to integrate additional data from new sensors in order to allow the entire architecture to achieve best performance. The addition of new sensors will guarantee the possibility of having a greater number of information for the emergency response. Furthermore, as ordinary citizens acquire largest digital skills, they will be able to provide more detailed and accurate content and information, which in turn will guarantee a more precise intervention on the territory. It will also be possible to develop a specific socio-mobile application to use on the next generation personal devices, in case of various types of disasters, not linked exclusively to natural calamities but also to accidents, coordination of grassroots first aid, etc.
References
Abad P, Puente V, Gregorio JA (2012) Balancing performance and cost in CMP interconnection networks. IEEE Trans Parallel Distrib Syst 23(3):452–459
Abel F, Hauff C, Houben G, Tao K, Stronkman R (2012) Twitcident: fighting fire with information from social web streams. In: Proceedings of International Conference on World Wide Web (WWW), Lyon, France
Baudry M (2008) The geoweb and hyper-local internet markets. Commun Strat 72(4):179–184
Bortree DS, Seltzer T (2009) Dialogic strategies and outcomes: an analysis of environmental advocacy groups’ Facebook profiles. Public Relat Rev 35(3):317–319
Boyd DM, Ellison NB (2007) Social network sites: definition, history, and scholarship. J Computer Med Commun 13(1):210–230. doi:10.1111/j.1083-6101.2007.00393.x
Brunner D, Lemoine G, Thoorens FX, Bruzzone L (2009) Distributed geospatial data processing functionality to support collaborative and rapid emergency response. IEEE J Sel Topics Appl Earth Obs Remote Sens 2(1):33–46
Bruns A, Burgess J, Crawford K, Shaw F (2012) #qldfloods and @QPSMedia: crisis communication on Twitter in the 2011 South East Queensland Floods. ARC Centre of Excellence for Creative Industries and Innovation, Brisbane
Cai R, Lu L, Zhang HJ, Cai LH (2003) Highlight sound effects detection in audio stream. In: Proceedings of IEEE International Conference on Multimedia Expo
Caplan SE, Perse EM, Gennaria JE (2007) Computer-mediated technology and social interaction. In: Lin CA, Atkin DJ (eds) Communication technology and social change: theory and implication. Lawrence Erlbaum, Mahwah, pp 39–57
Conklin WA, Dietrich G (2010) Emergency communications using the web: matching media richness to the situation. In: 43rd Hawaii International Conference on system sciences, Honolulu, pp 1–9. http://ieeexplore.ieee.org/lpdocs/epic03/wrapper.htm?arnumber=5428284
Earle P, Guy M, Buckmaster R, Ostrum C, Horvath S, Vaughan A (2010) OMG earthquake! Can Twitter improve earthquake response? Seismol Res Lett 81(2):246–251
Endsley MR (1995) Toward a theory of situation awareness in dynamic systems. Human Factors: J Hum Factors Ergon Soc 37:32–64
Farinosi M, Micalizzi A (2013) NetQuake. Media Digitali e Disastri Naturali. Dieci ricerche empiriche sul ruolo della Rete nel terremoto dell’Aquila. FrancoAngeli, Milano
Farinosi M, Treré E (2010) Inside the “People of the Wheelbarrows”: participation between online and offline dimension in the post-quake social movement. J Commun Inf 6(3). http://www.ci-journal.net/index.php/ciej/article/view/761/639
Ferrin G, Snidaro L, Foresti GL (2011) Contexts, co-texts and situations in fusion domain. In: 14th International Conference on Information Fusion, Chicago, USA, July 5–8, 2011
Foresti GL, Micheloni C (2002) Generalized neural trees for pattern recognition. IEEE Trans Neural Netw 13(6):1540–1547
Foresti GL, Regazzoni CS, Visvanathan R (2001) Video communications, processing and understanding for third generation surveillance systems. In: Proceedings of IEEE, 89(10)
Fraustino JD, Brooke L, Jin Y (2013) Social media use during disasters: a review of the knowledge base and gaps. In: Final report to Human Factors/Behavioral Sciences Division, Science and Technology Directorate, US Department of Homeland Security. College Park, MD: START, Jen. 2013
Gilbert C (1998) Studying disaster: changes in the main conceptual tools. In: Quarantelli EL (ed) What is a disaster? Routledge, London, New York, pp 11–18
Goodchild MF (2007) Citizens as sensors: the world of volunteered geography (online). http://www.ncgia.ucsb.edu/projects/vgi/docs/position/goodchild_vgi2007.pdf
Goolsby R (2010) Social media as crisis platform: the future of community maps/crisis maps. ACM Trans Intell Syst Technol 1(1). doi:10.1145/1858948.1858955
Guy M, Earle P, Ostrum C, Gruchalla K, Horvath S (2010) Integration and dissemination of citizen reported and seismically derived earthquake information via social network technologies. In: Advances in intelligent data analysis IX. Springer, Berlin, pp 42–53. doi:10.1007/978-3-642-13062-5_6
Heinzelman J, Waters C (2010) Crowdsourcing crisis information in disaster-affected Haiti. United States Institute of Peace, Washington, DC
Hofstee H (2005) Power efficient processor architecture and the cell processor. In: Proceedings 11th Int. Symposium on high-performance computer architecture (HPCA), San Francisco, USA, February 12–16, 2005
Jang HC, Lien YN, Tsai TC (2009) Rescue information system for earthquake disasters based on MANET emergency communication platform. In: Proceedings of the 2009 International Conference on Wireless Communications and Mobile Computing: Connecting the World Wirelessly, Leipzig, Germany, June 21–24, 2009, pp 623–627
Kanchanasut K, Tunpan A, Awal MA, Kumar Das D, Wongsaardsakul T, Tsuchimoto Y (2007) DUMBONET: a multimedia communication system for collaborative emergency response operations in disaster-affected areas. Int J Emerg Manag 4(4):670–681
Kavanaugh A, Fox EA, Sheetz S, Yang S, Li LT, Whalen T, Shoemaker D, Natsev P, Xie L (2011) Social media use by government: from the routine to the critical. In: Proceedings of the 12th Annual International Conference on Digital Government Research, College Park, MD, June, 2011
Kim J (2009) Low-cost router microarchitecture for on-chip networks. In: Proceedings IEEE/ACM 42nd Int. Symposium on microarchitecture, New York, USA, December 12–16, 2009
Kinsella S, Murdock V, O’Hare N (2011) “I’m eating a sandwich in Glasgow”: modelling locations with tweets. In: SMUC 11 Proceedings of the 3rd international workshop on Search and mining user-generated contents
Kodrich K, Laituri MN (2011) Making a connection: social media’s key role in the Haiti earthquake. J Commun Computer 8:624–627
Li L, Tang S (2008) An artificial emergency-logistics-planning system for severe disasters. IEEE Intell Syst 23(4):86–88
Littlefield RS, Quenette AM (2007) Crisis leadership and Hurricane Katrina: the portrayal of authority by the media in natural disasters. J Appl Commun Res 35(1):26–47
Liu H, Yu Z, Zha H, Zou Y, Zhang L (2009) Robust human tracking based on multi-cue integration and mean-shift. Pattern Recogn Lett 30(9):827–837
Llinas J, Bowman CL, Rogova GL, Steinberg AN, Waltz EL, White FE (2004) Revisiting the JDL data fusion model II. In: Proceedings of the Seventh International Conference on Information Fusion, Stockholm, Sweden, June 2004, pp 1218–1230
Martinel N, Micheloni C, Piciarelli C (2012) Distributed signature fusion for person re-identification. In: International conference on distributed smart cameras. Hong Kong, pp 1–6
Martinel N, Micheloni C, Piciarelli C, Foresti GL (2013) Camera selection for adaptivehuman—computer interface. IEEE Trans Syst Man Cybernet: Syst 1–1. doi:10.1109/TSMC.2013.2279661
Meier P (2013) How to create resilience through big data (online). http://irevolution.net/2013/01/11/disaster-resilience-2-0/
Micheloni C, Foresti GL (2009) Automatic tuning of intrinsic camera parameters. IEEE Trans Autom Sci Eng 6(4):577–587
Micheloni C, Snidaro L, Foresti GL (2009) Exploiting temporal statistics for events analysis and understanding. Image Vis Comput 27(10):1459–1469
Micheloni C, Rinner B, Foresti GL (2010) Low-level processing in PTZ camera networks. IEEE Signal Process Mag 27(5):78–90
Micheloni C, Rani A, Kumar S, Foresti GL (2012) A balanced neural tree for pattern classification. Neural Netw 27:81–90
Monekosso D, Remagnino P (2007) Monitoring behaviour with an array of sensors. Comput Intell 23(4):420–438
Neuvel JMM, Scholten HJ, Van Den Brink A (2012) From spatial data to synchronised actions: the network-centric organisation of spatial decision support for risk and emergency management. Appl Spatial Anal Policy 5(1):51–72
Pande P, Grecu C, Jones M, Ivanov A, Saleh RA (2005) Performance evaluation and design trade-offs for network-on-chip interconnect architectures. Computers 54(8):1025–1040
Park SH, Jung K, Hea KJ, Kim HJ (1999) Vision-based traffic surveillance system on the Internet. In: Proceedings of 3rd International Conference on Computational intelligence and multimedia applications (ICCIMA), 1999, pp 201–205
Paulheim H, Döweling S, Tso-Sutter K, Probst F, Ziegert T (2009) Improving usability of integrated emergency response systems: the SoKNOS approach. In: Proceedings of Informatik 2009 Conference, Lübeck, Germany, September 28-October 2, 2009, pp 1435–1449
Pringle C (2009) From curiosity to collaboration: leveraging technology to improve situational awareness. Safeguarding Homeland Security. Governors and Mayors Speak Out, pp 159–176. doi:10.1007/978-1-4419-0371-6_14
Rinner B, Wolf W (2008) An introduction to distributed smart cameras. Proc IEEE 96(10):1565–1575
Ross A, Jain A (2004) Multimodal biometrics: an overview. In: Proceedings of the XII European Signal Processing Conference, 2004, pp 1221–1224
Schade S, Luraschi G, De Longueville B, Cox S, Díaz L (2010) Citizens as sensors for crisis events: sensor web enablement for volunteered geographic information. In: Webmgs 2010 (online). http://www.isprs.org/proceedings/xxxviii/4-w13/id_02.pdf
Singh VK, Gao M, Jain R (2012) Situation recognition: an evolving problem for heterogeneous dynamic big multimedia data. Proceedings of the 20th ACM international conference on Multimedia (MM ‘12). ACM, New York, pp 1209–1218
Snidaro L, Foresti GL (2003) Real-time thresholding with Euler number. Pattern Recogn Lett 24(9–10):1533–1544
Snidaro L, Foresti GL (2007) MISS EU project : video application to improve public transport efficiency. In: 6th European Congress on Intelligent Transport Systems, Aalborg, Denmark, June, 18–20, 2007
Spiro ES, Sutton J, Greczek M, Fitzhugh S, Pierski N, Butts C (2012) Rumoring during extreme events: A case study of Deepwater Horizon 2010. In: International Conference on WebSci 2012, Evanston, IL, June, 2012
Starbird K, Palen L (2010) Pass it on?: Retweeting in mass emergency. In: Proceedings of the 7th International ISCRAM Conference—Seattle, USA, May 2010
Starbird K, Palen L (2011) Voluntweeters: self-organizing by digital volunteers in times of crisis. In: Proceedings of the ACM 2011 Conference on Computer Human Interaction, Vancouver, BC, Canada, May 2011
Starbird K, Palen L (2012) (How) will the revolution be retweeted? In: Information diffusion and the 2011 Egyptian Uprising CSCW’12, February 11–15, 2012, Seattle, Washington, USA
Stephens KK, Malone P (2009) If the organizations won’t give us information…: the use of multiple new media for crisis technical translations and dialogue. J Public Relat Res 21(2):229–239
Sutton J, Palen L, Shklovski I (2008) Backchannels on the front lines: emergent uses of social media in the 2007 Southern California wildfires. In: Proceedings of the 5th International ISCRAM, Washington, DC, May, 2008
Sweetser KD, Metzgar E (2007) Communicating during crisis: use of blogs as a relationship management tool. Public Relat Rev 33:340–342
Waharte S, Trigoni N (2010) Supporting search and rescue operations with UAVs. In: International Conference on emerging security technologies (EST), September 6–7, Canterbury, UK, 2010, pp 142–147
Author information
Authors and Affiliations
Corresponding author
Rights and permissions
About this article
Cite this article
Foresti, G.L., Farinosi, M. & Vernier, M. Situational awareness in smart environments: socio-mobile and sensor data fusion for emergency response to disasters. J Ambient Intell Human Comput 6, 239–257 (2015). https://doi.org/10.1007/s12652-014-0227-x
Received:
Accepted:
Published:
Issue Date:
DOI: https://doi.org/10.1007/s12652-014-0227-x