
Abstract
In today’s era of new advancements, diagnosing a pathology at an early stage has given rise to the development of automated diagnostic systems. Knee Osteoarthritis (KOA) being among one of the most painful joint disorders is the root cause for disability, particularly in elderly population. Gait based recognition of KOA is a prominent area that requires deliberations from the end of researchers, academicians and scientists to develop more automated systems that not only offer reliability and accuracy but are also affordable for common man. This article aims to provide an in-depth investigation of efforts directed towards vision-based, sensor-based and hybrid KOA identification. The study is based on the historical data gathered and background obtained viz-a-viz clinical gait analysis. An extensive survey of KOA gait acquisition modalities and feature representation approaches for the purpose of critically examining them are also presented. The study surveys the statistical metrics used for evaluating KOA, considering relevant articles. Based on the survey, this article aims to provide an up-to-date review of machine learning techniques for classification of KOA and healthy subjects. Furthermore, this article also identifies open research challenges existing in the literature that could be explored further for providing more effective KOA analysis. Finally, this article presents the future perspectives and provides an outline of the proposed work for efficient KOA diagnosis based on vision-based gait.
1 Introduction
A biometric refers to the measurement of various characteristics of the human body that provides a unique identity to an individual. From recent years, a number of biometrics have been used for diagnostic purposes such as handwriting [1], voice [2,3,4], iris [5] etc. In the era of modern science and technology, gait as a biometric has gained high popularity in resolving a number of issues. Automating the process of gait analysis plays a vital role in two major application areas: identification of human (authentication purpose) [6, 7] and medical (disease detection) [8,9,10,11]. So, gait analysis is mainly concerned with recognizing the walking pattern of an individual using some quantitative measures. Due to distinctive characteristics in gait patterns, positive and negative deviations in a person’s gait can be observed and efficiently investigated [12].
The term ‘abnormal gait’ is often used when a person loses the ability to walk normally. In clinical diagnosis, human gait analysis can be employed for the identification of various disorders that lead to gait abnormality. Individuals with disturbed gait have altered speed, cadence, limb moments etc. [13, 14] in comparison to ones with a normal gait. Analysis of these abnormalities in gait conditions can provide an effective way of developing new treatment strategies [8] which can help people with better Quality of Life (QOL). Abnormal behavior in gait doesn’t arise due to a single condition but involve several pathological diseases such as Musculoskeletal (joint pain, OA, injury) [15, 16], Neurological (Parkinson’s, cerebral palsy, other sensory impairments) [17,18,19] and also diseased health conditions (obesity, respiratory problem, heart attack etc.) [20, 21]. The worldwide data has been provided by Roser et al. [22] on ‘Burden of Disease’ from (1990–2016) using ‘Disability Adjusted Life Years’ (DALYs). From all the diseases, we have included aforementioned disorders that may affect the gait of a person. The study revealed that amongst all the considered gait conditions, Musculoskeletal disorders (MSD) shows the highest growth rate after heart diseases as shown in Fig. 1. However, the overall growth rate of cardiovascular diseases seem to be higher but their effect on a person’s gait is not tangible. Also, a study by Woolf [23] has revealed high occurrence and burden of MSD across the globe in comparison to other diseases. Therefore, the study of MSDs is taken into consideration and occupy the focus area of study in this article.

Comparative representation of some gait disorders affecting a large population, based on a study [22], measured using DALYs
MSDs are the conditions often characterized by chronic and long-term pain in any region of Musculoskeletal system (joints, tissues, nerves etc.). Presence of such painful situations hinder the flexibility, stability, mobility and other functional capabilities of a human body [24]. According to ‘Global Burden of Disease’ (GBD) [25], MSD was ranked second due to functional disability caused to the patient’s worldwide. The most common MSD includes Osteoarthritis (OA), injury (joint fracture), back and neck ache [24].
Based on study [26] from (1990–2010), an increase in about 45% abnormality was analyzed due to MSD (primarily due to OA). OA is the common joint disorder causing pain and inflammation in joints. The study [26] estimated OA to grow higher in the coming years with the rise in obesity, injury and aging like factors. Another GBD study [27] from (1990–2015) indicated a rise in OA from 33.6 to 36% (between 2005 and 2015), measured using ‘Years Lived with Disability’ (YLDs).
Recent studies on biomechanical causes in OA mostly focused on analyzing knee joint movement due to its simpler anatomy compared to other body joints [8]. An analysis by the study [28, 29] has shown about 3.8% Global-Age Standardization (GAS) prevalence of KOA higher among female population (about 18%) than males (approx. 9%) over 65 years. Vos et al. [30] reported growth of KOA on 250 million people on global disease survey. Further, KOA requires higher financial dependence for its diagnosis and treatment. Approximately 330$ billion has been spent on KOA in the USA and further rise has been estimated [28].
In the field of KOA diagnosis, the use of automated systems employing three types of gait acquisition modalities, i.e. vision-based, sensor-based and hybrid has been given more attention. Recently a study by Derek et al. [16] applied the combination of instrumented gait treadmill and retroreflective markers to access differences among gait features of KOA and healthy subjects. The use of inverse dynamics successfully achieved an accuracy of 94–98%. The high potential of hybrid modality for KOA has attracted more researchers towards this. An effort to analyze KOA gait using only sensor based modality was led by Kotti et al. [10] attained high accuracy. Towards vision-based KOA recognition, a commendable work was put forward by Ishikawa et al. [31] using model-based approach. Their study revealed the potential of planar law to measure gait variations. Similarly, the use of the Kinect sensor for KOA gait acquisition by Cui et al. [32] opened new doors towards vision-based model free modality and achieved an accuracy of 97%. Besides these research studies, certain Universities also contributed to the medical field. Recently, in 2018 University of United Kingdom (UK) developed sensor installed clothes for gait capture purposes [33].
In spite of having huge benefits of vision and sensor-based KOA recognition, several issues have been observed by researchers which make KOA gait analysis a complicated task such as unavailability of KOA database, small sample size [12, 34,35,36], self-occlusion [37], focus on only few severity levels [16, 38,39,40], few gait parameters [11, 41] etc. Till now, most of these issues remain unsolved thus opening new research scope in the clinical diagnosis of KOA.
In this article, the entire focus is directed towards broader analysis of KOA considering gait biometric. A systematic review process of the articles is shown in Fig. 2. A literature survey has been performed using highly reputed journals including IEEE, Sensors, The Knee, Osteoarthritis and Cartilage, Gait and Posture, Clinical Biomechanics, Journal of Biomechanics, Advanced Robotics, Arthritis Care and Research etc. Articles are searched using different keywords. Keywords such as ‘osteoarthritis gait’, ‘knee osteoarthritis’, ‘clinical knee osteoarthritis’, ‘vision based KOA’, ‘sensor based KOA’ etc. are incorporated in the search box, also providing a range of years to be searched ‘2000–2018’. On specifying the search string to ‘OA gait’, approximately (1000–1500) articles have been obtained. Further limiting the search string by ‘area tag’ (e.g., knee, hip, ankle OA gait), most of the research articles found to be related with KOA. Finally, after eliminating duplicate and unrelated articles, a total of 125 relevant articles are considered that mainly focused KOA diagnosis based on gait.

A demonstration of the complete systematic review process to obtain relevant KOA articles from (2000–2018), considering reputed journals
The general framework followed for diagnosing KOA using clinical analysis involves five main stages i.e. (1) Gait data acquisition (2) Pre-processing (3) Feature Extraction (4) Classification (5) Output, shown in Fig. 3. Stage-I includes capturing of KOA and healthy subjects gait data using sensor-based [10, 42,43,44], vision-based [31, 32, 37] and hybrid [14, 36, 45, 46] modalities. In Stage-II, the acquired data is then pre-processed (frame extraction, noise filtering, etc.) to enhance the quality of data. For filtering of gait data, Butterworth (fourth order, zero phase lag) low-pass filter is used by most of the researchers [29, 31, 40, 47]. Stage-III involves acquiring of gait frames and extraction of relevant features such as speed, knee moments, velocity etc. for both KOA and normal subjects, optimized features are then selected using some techniques such as PCA [31] etc. In Stage-IV, the classification among KOA and healthy subjects is performed using statistical measures [42, 44] or machine learning techniques [41, 48]. Stage-V indicates the result of the diagnostic system for KOA diagnosis and accordingly provides a decision regarding the severity of the disease. The detailed description of the aforementioned stages (I, III, IV, and V) is provided in succeeding sections.

A pipeline depicting the diagnostic process of knee osteoarthritis (KOA)
1.1 Contribution
There are some existing surveys done by different researchers that provided useful reviews on normal as well as pathological gait recognition. A recent review by Prakesh et al. [49] focused on different parameters (such as spatiotemporal, kinetic, kinematic etc.), approaches (vision, sensor-based and hybrid) that are used for human gait recognition. They had also covered application areas and Machine learning techniques for human identification. Another review by Tao et al. [50] highlighted the efficiency of wearable sensors for gait analysis.
In the clinical field, a review by Herran et al. [51] focused the use of wearable and non-wearable systems and their applicability in diseased gait analysis. Another effort by Ali et al. [52] conducted a systematic review indicating the potential of vision and non-vision based sensors for abnormal gait rehabilitation.
The aim of this article is to perform a systematic survey on different aspects of KOA based on gait. The objective of this article can be understood through the points mentioned under:
-
1.
To the best of our knowledge, this is the first article which provides literature survey of KOA based on gait.
-
2.
The paper comprehensively outlines the evolution of various techniques for clinical gait analysis from the year (2000–2018).
-
3.
Investigated KOA considering more than 100 research articles from journals of repute.
-
4.
The article exhaustively reviews several gait acquisition modalities for KOA, also highlighting their issues and their relative comparison.
-
5.
The article provides a brief description of various performance evaluation statistical methods used for KOA analysis.
-
6.
The paper inclusively surveys a number of KOA feature representation approaches, based on taxonomy shown in Fig. 13.
-
7.
The paper provides an overview of machine learning techniques for the diagnosis of KOA.
-
8.
The article also focuses on the future perspectives that need to be considered for reliable KOA diagnosis.
-
9.
A concise description of the proposed workflow is also given in Fig. 19.
Fig. 5 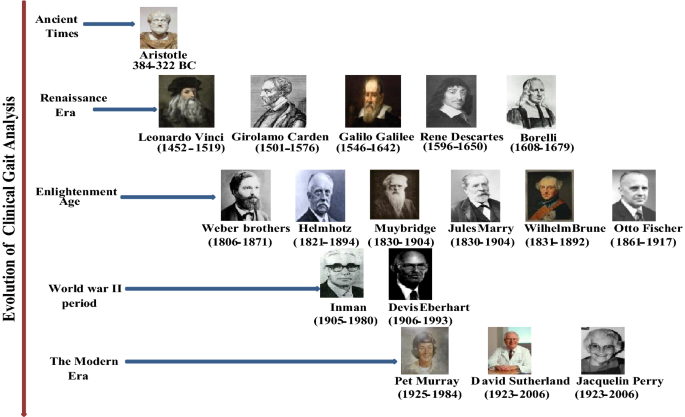
Major contributions in the history of clinical gait analysis. The left side represents the evolution of gait in clinical analysis from Ancient times to The Modern Era. At the right side, key contributors are shown. Some images in this and other figures are from the internet. URL’s are provided in “Appendix”


The paper is organized as follows; Sect. 2 presents an overview of human gait analysis including basics of human gait, history of clinical gait analysis and a brief description of Musculoskeletal disorders. Section 3 outlines the evolution of clinical gait analysis technologies. Section 4 describes KOA gait acquisition modalities. Further, feature representation approaches for KOA is defined in Sect. 5. Sections 6 and 7 illustrate evaluation methods and machine learning approaches for KOA analysis. Section 8 discusses future perspectives and proposed work is presented in Sect. 9. At last, Sect. 9 summarizes the whole article in the form of conclusion.
2 Overview to Human Gait Analysis
Gait defines the style of walking of humans as well as animals. Human gait analysis is more primarily concerned with the study of human kinetics employing both subjective such as eye and brain of the viewer as well as objective assessment i.e. using various devices and techniques for calculating gesture of body, muscles action and body mechanics [53]. Along with security and clinical applications, gait analysis can be applied in identification of risk injuries (Sports), Robotics research, Rehabilitation etc. In recent years there has been a great interest among researchers and scholars to understand, identify and intellectualize the concepts of biometrics in the field of medicine. By analyzing the walking pattern of a patient clinically, it is possible to perform an early diagnosis of various diseases and accurate differentiation of normal and abnormal subjects. This section provides the description of human gait basics including gait cycle, history of clinical gait analysis and a brief illustration of Musculoskeletal disorders focusing primarily on Knee Osteoarthritis (KOA).
2.1 Basics of Human Gait
In a normal human being, gait activity occurs smoothly using two limbs where one limb supports another without losing balance. However, this simple looking walking involves complex events. These events happen in a sequence which repeats itself to create ambulation and forms the gait cycle. In this section, an explanation of phases and sub-phases involved in human gait cycle is presented (using different colors) in Fig. 4. Also, brief detail about percentage contribution of each phase in total gait cycle is provided.
-
1.
Human gait cycle
Taking right leg as reference, the period initiating from heel strike of one extremity (right) to the occurrence of the same event of other lower extremity (left), is named as Gait Cycle [54]. On the other hand, if it ends with other lower extremity different from that of starting one, is known as Stride. Three essential combination of human body parts-lower extremity, pelvis and spinal column are responsible for the occurrence of the gait cycle [49].
Typically, Gait cycle is divided into two principle phases namely Stance Phase and Swing Phase. Stance phase means in-touch with the ground, i.e. when foot remains in contact with the floor (lime color), as shown in Fig. 4. It shares about 60% in forming the gait cycle. On the completion of the Stance phase, immediately foot goes in the air (away from the ground) referred to as Swing Phase (tan). It contributes almost 40% in the gait cycle. So, the whole summation of above two phases makes a complete gait cycle [56]. In totality, Perry et al. [55] divided gait cycle into eight sub-phases out of which first five belongs to Stance phase and remaining three to Swing phase, implies in Fig. 4. The subsequent aggregation of all phases attain three important tasks-Weight Acceptance (WA) (aqua), Single Limb Support (SLS) (dark purple) and Limb Advancement (LA) (green) [49, 54].
First two sub-phases of Stance phase are: Initial Contact also known as heel Strike, occurs when the foot first touches the ground and contributes nearly (0–2%) of the gait cycle. The second one is Loading Response also known as foot flat, in which the whole weight has to be acknowledged by the reference leg. When this phase takes place, foot become flat and shares (2–10%) of the total gait cycle. These two sub-phases lead to the accomplishment of the first task i.e. WA.
Then the next two (third and fourth) sub-phases of Stance phase begins-specifically Mid-Stance, which represents the midway of the whole Stance phase. It starts when the limb other than reference leg is raised and maintained over the forefoot and covers about (10–30%) of the gait cycle. Another phase i.e. Terminal Stance (heel-off) indicates that the heel is actually trying to leave the floor and adds (30–50%) of the gait cycle. These two sub-phases of Stance phase completes the second task of (SLS). Final (fifth) sub-phase of stance phase: Pre-Swing (toe-off) occurs when toe leaves the ground and forms (50–60%) in the gait cycle. This phase initiates last task i.e. (LA) and is continued through three (sixth, seventh and eighth) other sub-phases of Swing phase.
In Swing phase, Initial Swing is considered as the first sub-phase in which the person tries to accelerate the extremity ahead and shares (60–70%) of the total gait cycle. Likewise, mid-stance phase of stance phase, other phase known as Mid-Swing referred as the midpoint of Swing phase and shares (73–87%) of the gait cycle.
Following the Mid-Swing phase, the last phase of Swing phase i.e. Terminal Swing occurs. In this phase, an effort is made to stop the limb for next heel strike for the preparation of next Stance phase and commit (87–100%) of total gait cycle [49, 54]. The Period of Double support (DS) can be seen in first and fifth phase (rose) while the period of Single Support (SS) extends from second to the fourth phase and continued from sixth to eighth phase (blue), shown in Fig. 4. Therefore, the gait cycle plays a vital role in the identification of individual gait patterns either normal or with some pathological disorder such as KOA.
2.2 History of Clinical Gait Analysis
The understanding of walking developed today is not influenced by a single era of study but involves a long history. How does walking happen? What are the parameters and phases involved in it? People have been reasoning since the earlier times [57]. In this section, the information about work done in the medical area from Ancient times to The Modern Era, by some major contributors is provided and summarized in Fig. 5.
In Ancient era, by raising certain relevant queries about the manner of walking of human beings, Aristotle (384–322 BC) [57, 58] has set the basis for further evaluation in gait analysis and became the first person who contributed towards gait by giving his work in ‘Gait of Animals’. He examined and outlined the human movements based on which various new theories developed on human and animal’s locomotion.
After Aristotle’s work, during the Renaissance era, Vinci (1452–1519) [58] focused on the mechanics of the human body during different activities such as walking, upstanding etc. Cardano (1501–1576) [58] contributed his work towards human body’s 3D joint angles to analyze the movement. Then the concept of modern scientific methods was put forward by Galilei (1546–1642) [57, 58] who was a physician. Similarly, another work by Descartes (1596–1650) [57] on Cartesian coordinates added a new advancement in the assessment of clinical gait. Out of all the related work done during renaissance era, one of the tremendous contributions was laid by Borelli et al. (1608–1679) [57,58,59] on ‘Motion of Animals’ and is considered as the first researcher to conduct experiments on gait analysis. Borelli’s study on muscle movements and body mechanics came with a new conclusion that external load applied to muscles is considerably less than the forces between the muscles.
After that, the age of enlightenment began with the work of Weber brothers (1806–1871) [57, 60]. They were the first to inspect the human gait analysis in ‘Mechanics of Human Walking Tools’ (Mechank der Menschlichen Gelwerlizeuge). Their efforts towards constructing a model to give a clear description of the behavior of limbs at different time and relationship between variations in step length and cadence provided great insight in clinical gait assessment.
Afterward, Helmholtz (1821–1894) and Carlet (1845–1892) [58] has carried their researches and involvement towards this field also shown in Fig. 5. Muybridge et al. (1830–1904) [61] and Marey et al. (1830–1904) [62] contributed substantially to this new findings and developing field of gait biometric by giving their work in ‘The Human Figure in Motion’ and ‘Animal Mechanics’. Muybridge (a leading American photographer) used his photography techniques to capture gait. Later Marey’s efforts to capture several images on a single photographic plate by developing a shutter had successfully overcome the Muybridge’s flaws and used it for pathological gait study [62].
In the same era, Braune (1831–1892) and Fischer (1861–1917) [58, 63] became the first to direct the tridimensional mathematical investigation of human gait and their effort published in the book ‘Der Gang des Menschen’ (1895–1904). They made an effort to study mass, volume and center of mass for three male adults and also enhanced the use of regression equations to estimate various parameters of the body.
Gait analysis in the clinical application set up great strides in later half of the twentieth century [64]. In the period of World War II, Inman (1905–1980) [65] and Eberhart (1906–1993) [66] emerged with new and splendid understanding concerning to human locomotion. Their aim was to treat world war retired soldiers for providing gait rehabilitation to them.
At the end of World War II, Murray (1925–1984) [58, 67] was the first researcher to quantify the kinematics of body segment in more than one plane during walking. She made intriguing research for worldwide studies in the medical field. The concept of interrupted lights was used to capture the gait of 60 normal males in both sagittal and traverse plane [57].
In the modern century, major contributions to the development of clinical gait have been made by two surgeons namely Sutherland and Perry (1923–2006) [57]. Development of Electromyography (EMG) electrodes by Sutherland [58] for gait measurement using EMG proved to be a successful tool for disease investigation in clinical research. They established the gait enquiry library [64] and have also given division in the phases of the gait cycle.
Therefore, clinical gait analysis has emerged as a new area for academia and researchers to produce more investigative outcomes towards early detection of the disease.
2.3 Overview of Musculoskeletal Disorders (MSD): KOA
The human body is just like a network that consists of bones, joints, muscles, nerves, other tissues and supporting structures collectively named as Musculoskeletal System (MSS) [68]. The occurrence of any condition (e.g. injury, physical abnormality) which directly or indirectly affects the parts of such system, is termed as Musculoskeletal disorders (MSD) such as arthritis, Osteoporosis, back pain etc. [69]. These disorders causes pain and effects the walking of a person.
This section provides a brief outline of MSD, giving special preference to Osteoarthritis (OA) considering knee i.e. Knee osteoarthritis (KOA), affecting a large population. Arthritis is a MSD that mainly causes inflammation of joints and besides affecting older population, children and young people are also prone to the disease [70]. Among all arthritis’s (such as Osteoarthritis (OA), Rheumatoid Arthritis (RA), Gout etc.), OA is the most common type degrading people lives gradually. In a systematic analysis on the global burden of disease study from (1990–2016) [71], it is analyzed that OA shows a high rise in affecting population between the period 2006 and 2016 i.e. 31.5% as compared to other types of arthritis and MSD’s. OA typically referred to as degenerative joint disorder/wear and tear disease [64, 72, 73] initially begins with affecting a few joints (medial compartment) and when progresses to severe stages, it destroys other joints of the body including knee, hip, hand, feet and spine [70]. In OA, the joint becomes unstable and loses its range of movement, even then many people do not complain about pain in that joint. Thus, diagnosing OA in early stages is a very difficult task [70].
A 2012 study by Turkieivicz et al. [74] investigated the present and future effect of OA on healthcare considering OA population aged greater than 45. The analysis reveals that out of three most effected joints of the body i.e. knee, hip and hand, greater effect was seen on the knee (almost 61%) followed by the hip joint (48%). Hand OA contributed 46% and 55% by other joints (shoulder, ankle, elbow, foot, jaw and polyarthritis nodes) as shown in Fig. 6.

Representation of percentage effect of OA on various joints of the body including knee, hip, hand and other, based on study [74]
Another study by Gabriel et al. [75] has provided an evidence of knee as the most affected joint attacked by OA compared to hip and hand joints. KOA is a very common cause of gait disorder that affects whole joint [76] and leads to serious treatment such as Total Knee Replacement (TKR) [77].
A joint basically provides a point where two bones meet and are held by a fibrous elastic tissue known as ligament. Figure 7 gives a visual description of differences between a healthy and OA knee joint. In the knee joint, two bones namely femur and tibia are connected with the help of ligament. In a healthy knee (left), cartilage prevents two bones from sliding each-other by providing joint space. Also synovial fluid provides nourishment to the bone and helps in normal walking. When KOA occurs, healthy articular cartilage starts deteriorating, get reduced, become hard and rough, ends of bone swells and take knobby shape [70] as shown in Fig. 7 (right). Also, synovial membrane thickens increasing the amount of synovial fluid which starts releasing toxin substances and reduces joint space between two bones. As a result of which, during walking, bones rub each other and cause pain to a person.

A pictorial view of healthy unaffected knee joint (left) and knee joint affected by OA (right) [78]
The causes behind occurrence of KOA still remain hidden. However, some factors such as obesity, aging, excessive joint load, injury can be considered as its main causes [76]. Several studies have revealed that aging is the important risk factor that contributes to KOA and women are more prone to the disease than men [69]. In a health 2000 Examination survey [76], it was concluded that persons with age group (55–74) and mostly females frequently comes under the effect of KOA [70]. The reason may be more susceptibility of KOA for degradation and damage of cells [77].
Therefore, In KOA, destruction of knee joint leads to an abnormal gait, referred to as Antalgic gait. A person with this gait try to put less load on the more affected knee to avoid pain thus have more swing than stance phase in gait cycle [79].
-
1.
Clinical Measurements for KOA Diagnosis
In Clinical diagnosis of KOA, radiographs (X-rays, MRI) of a patient’s knee gives the evidence of the presence or absence of KOA. Once diagnosing its presence, doctors grade the disease on some clinical radiograph classification systems to assess its severity. Currently, there are almost 30 such systems available to grade KOA severity including Kellgren-Lawrence Scale (K–L scale), Visual Analogue Scale (VAS), Knee injury and Osteoarthritis Outcome Score (KOOS), SF-36 questionnaire, Western Ontario and McMaster Universities Osteoarthritis Index (WOMAC), Boston Leeds OA Knee Score (BLOKS) etc. Amongst the existing grading scales, K–L scale is typically used for assessment of KOA severity by assigning grades from 0 to 4, due to its easiness in understanding and usage [76]. The whole description about the meaning of each grade in K–L scale is presented in Table 1.
However, the use of these clinical grading measures for KOA seems to be good but only involves subjective assessment. Radiographic scores and patients reported pain need not to correlate with each-other that leads to an inaccurate diagnosis of KOA. Therefore, objective and quantitative measurements of KOA should be performed for proper diagnosis of KOA. Using gait as a measure for KOA, can provide a Quality of Life (QOL) to people suffering from KOA and help in gait rehabilitation.
3 Evolution of Technologies for Clinical Gait Analysis
A technology refers to equipment or device evolved from technical knowledge in order to solve numerous problems. Due to its larger benefits, one of its application areas is in medical for recognition of a disease efficiently. This section provides a brief description of the evolution of numerous technologies invented by different researchers from ancient time to modern era [81] and are used for clinical gait analysis. Figure 8 provides a visual representation of technologies developed from the 1800s to 2018.

A Visual Representation of the evolution of various technologies for clinical gait analysis. Left side depicts the name of the inventor with the year and the right side shows a list of clinical gait measurement technologies and types of modality under which they fall

A depiction of usage proportion of each modality for KOA gait acquisition
The foundation of clinical gait analysis was led by efforts of Braune and Fischer [82] in the 1800s, by applying Geissler tubes. They focused on determining individual joint angles such as flexion, extension, adduction, abduction etc. using the idea of differences in angular rotation of joints and body segments that differentiates a normal gait from an abnormal one. The use of Geissler tubes however shown efficiency in estimating kinetic data of subject but required a large number of hours for patients gait acquisition and further calculations. Another advancement in this area was made by Carlet [57] (student of Jules Marey) in (1849–1892). Carlet developed insole pressure shoes with the aim to perform Ground Reaction Force (GRF’s) measurements when foot of the subject comes in contact with the ground.
Afterward, in the 1940s Elbeherdt and Iman [66, 82] took forward the clinical research by using the principle of interrupted lights. The joint angles were calculated by a series of dots formed by slotted plates/disks rotating in front of the camera at fixed intervals of time. Since these angles were manually computed so it was not appropriate for medical applications. Both Geissler tube and interrupted light methods were based on old photography. The discipline of gait enquiry was then lifted ahead by Inman and Colleagues [81] in (1944–1947) with the invention of Kinesiological Electromyography (KEMG). They employed KEMG in combination with 3-Dimensional (3D) force to investigate the muscle movements and strength between normal subject and the ones with the disorder. Abnormal interrupted lights activity potential was then analyzed using a system known as Electromyographs. The used procedure though helped in reducing the synchronization error [81] but the insertion of electrodes in the body to measure EMG signals was very painful for the subjects. In the 1950s, Goddard [81, 83] had revolutionized the world of clinical gait analysis by introducing inertial sensors i.e. accelerometers, gyroscopes etc. These Inertial Measurement Units (IMU’s) were fixed to different body parts of subjects in order to compute the linear acceleration as well as the angular position of the body. However, these units had high potential in capturing sufficient clinical gait data but was bulky, expensive and caused difficulty to subjects in wearing IMU’s.
Afterwards, a new technology emerged that has changed the face of clinical gait analysis i.e. Kistler force plates. These force plates were launched by Kistler group [57, 64] in 1969 to measure GRF’s from the surface. These devices had the ability to acquire total XY and vertical forces conveyed by foot while walking. The invention of KEMG, insole pressure shoes, and force plates constitute force and pressure sensors which in turn are wearable (e.g. insole shoes) and non-wearable (e.g. Kistler plates) shown in Fig. 8. The name of a great researcher Murray [82] gave a new insight to this area by inventing an effective, easily employable and low-cost technology of retro reflective strips in the 1960s–1970s. Reflective markers (either passive-covered with retro-reflective material or active-LED’s itself) were devices attached to different parts of the human body which then acts as landmarks to calculate the joint angles from photographs taken. Measurements were performed by connecting these stripes to body extremities of normal (men, women) and pathological diseased patients. This technology contributed towards marker-based gait capture [84].
In 1976, the very first researcher to make use of the electrogoniometer technique to enable joint angles recording in an easy way was Karpovics brothers [82]. The main advantage was its cost-effectiveness and its ability to continuously measure joint angles. Afterward, in the 1980s Motion capture suit shortly known as Mocap suit [85] was developed by Virtual Programming languages (VPL) that was competent enough to record the actions of the wearer. Other companies had also put forward this technology into a new form such as Tesla, prior Virtual reality (VR) etc. in the market.
In 1984, one of the eminent technologies was founded by Vicon [64] which enabled acquiring and capturing the 3D motion. Vicon was chiefly the video-based motion capture system to reflect infrared light of passive targets attached to the area of interest on the body. In the period of (1995–2005) Digital camcorders and Smartphone’s [64] had completely modernized the world. This discovery (by Sony, Ikegami etc.) made it easier to capture the motion of the human body with high accuracy and reliability. Mobile devices such as smartphones have been used to use the accelerometer data.
Research towards the medical field didn’t stop here but a new technology was put forward by Microsoft (MS) Kinect with the invention of the depth camera in 2011 [64]. This device had the capability to capture only that portion of the body in which the researcher was interested by constructing a skeleton structure of the body. The three technologies discussed earlier i.e. Vicon 3D Motion system, Digital camcorders, Smartphone’s and depth camera were based on the concept of image processing. They directly capture gait of a patient without the use of markers on the body thus known as mark-less motion capture technology.
Recently in 2018, a new sensor installed clothes have been developed by the researchers in the University of UK [33] for clinical gait assessment. These clothes are equipped with highly specialized internal sensors to access the entire motion of the body. This new invention contributed immensely towards the enhancement of clinical research. The technologies such as inertial sensors, electrogoniometer, Mocap suit and sensor installed clothes are wearable sensors i.e. in order to use them, it is necessary to attach them to the subject’s body.
Therefore, invention and development of the abundant technologies have opened new doors towards medical applications for diagnosis of various gait disorders such as Musculoskeletal, neurological diseases etc. The detailed explanation of all the technologies is presented in Sect. 4.
4 Gait Acquisition Modalities for Diagnosis of Knee Osteoarthritis (KOA)
Data acquisition primarily defines the process of collecting sufficient information using different modalities. The success of a system relies on this acquired data. A modality is simply the way through which relevant data can be obtained. One of its major roles can be seen in capturing clinical gait of people suffering from KOA. In recent years, a number of KOA gait acquisition modalities have been developed based on different gait parameters such as Knee Adduction Moment (KAM), Knee Flexion Moment (KFM) etc. that enabled KOA effective diagnosis. Data acquisition in KOA is based on the technologies discussed in Sect. 3.
In this section, a systematic description about various KOA gait acquisition modalities from recent 15 years is summarized in Tables 2 and 3, based on proposed hierarchical taxonomy shown in Fig. 10. To get deep insight through these modalities, a complete illustration of each is presented. In this article, KOA acquisition modalities are classified into three broad categories namely Vision-Based, Sensor-Based and Combined/Hybrid. Approx. 125 research articles are found on KOA from 2004 to 2018, out of which 90 are based on Hybrid modality, 32 are Sensor-based and rest are Vision based, shown in Fig. 9.

Gait acquisition modalities for knee osteoarthritis (KOA) diagnosis
4.1 Vision-Based
Since assessing an individual’s gait with naked eyes is very challenging, the use of an optoelectronic system is required [52]. Vision-based modality make use of the analog or digital camera to capture and analyze the gait cycle. Once KOA gait is acquired, digital image processing techniques such as Time-of-Flight (TOF) and several methods including threshold, range imaging, background subtraction are used to perform measurements on recorded gait data [51]. This modality is further classified into two major sub-categories based on the use of markers i.e. model-based and model-free, shown in Fig. 10.
4.1.1 Model-Based
This modality is based on modeling the human body to extract relevant KOA clinical gait. Initially, a set of retro-reflective markers is fastened to the human body which provides the position of indicator points to determine angles of joints. Then a video-based optoelectronic system such as VICON, Polaris etc. is employed to detect the location of indicated body landmarks [108]. Retro-reflective markers thus used for this purpose are categorized into two classes [49]:
-
(i)
Passive markers These are the spherical, rounded or square devices coated by a reflective scotch lite tape layers. On emitting light by LED’s equipped camera, these devices reflect the light back indicating the position of body landmarks.
-
(ii)
Active markers These markers are LED’s itself that are attached to the subject’s body and releases light. Infrared light signals are released by the camera to determine the backscattering produced by LED’s markers giving the exact location and position of landmarks on the body.
Ishikawa et al. [31] proposed a study with an objective to analyze the angle of elevation made by KOA patients and healthy controls during walking. They employed an eight markers plug-in-gait marker set and a nine cameras VICON Mocap system. Results demonstrated the applicability of planar law to patients and achieved increased accuracy-0.69 ± 0.14, (Area under Curve) AUC-0.69 ± 0.767, precision = 0.84 ± 0.23, recall-0.57 ± 0.26, F-measure-0.66 ± 0.15 than previous method and Threshold = 8.56 ± 1.80.
Model-based modalities however, achieve high accuracy by giving correct location of body landmarks but require the use of controlled and complex laboratories to achieve KOA gait acquisition purpose.
4.1.2 Model Free
To overcome the limitations of model-based modality, model-free also known as holistic or appearance based modality has been developed. Model-free modality doesn’t employ markers on patient’s body but only utilizes a single video camera such as Kinect V2 etc. to capture KOA gait. Existing details about the subject’s body are not required and the main focus is given to shape, observing the point of camera and appearance. Firstly, videos are captured using a camera and then background subtraction is done to extract the silhouette image in order to again capture again shape and motion parameters [108].
Verlekar et al. [37] developed a single 2D video camera based system to allow automatic diagnosis and classification of gait pathologies using foot (step length and symmetry, foot fraction, normalized step count, speed) and body (amount of movement during gait, the center of gravity shifts and trunk orientation) related features. The proposed system using Support Vector Machine (SVM) outperformed the existing markerless two-dimensional (2D) video-based systems by attaining an accuracy of 98.8% and proved its reliability in the diagnosis of different pathologies including the knee. Though system achieved high accuracy but was susceptible to some flaws such as inability to analyze arm movement in silhouette image, requirement of a high resolution camera.
In another study, Cui et al. [32] proposed a method for reliable and accurate gait analysis of KOA patients using a single Kinect sensor consisting of depth sensing RGB-D camera to capture the depth information of joints of patient’s body. Kinematic, kinetic and spatiotemporal features were determined and Dynamic Time Wrapping (DTW) was used for calculation of knee joint angles. DTW is a method for distance calculation that performs a non-linear transformation to minimize the cost function. Applying SVM for classification results in high efficiency of Kinect in KOA diagnosis with an accuracy rate of 97%.
Thus the combination of model-based and model-free modalities constituted video based non-wearable mode for KOA gait acquisition and assessment. In recent years, a very few research is focused on using this modality for KOA diagnosis. Vision-based modalities offer direct capturing of KOA gait without the involvement of subjects and don’t require putting devices over the body. So there is greater need to consider these modalities for further KOA investigations.
4.2 Sensor-Based
Another important KOA gait acquisition modality is based on the use of sensors which are attached to the human body. These are further classified into two sub-categories on the basis of their ability to be worn on the subject’s body namely Non-wearable sensors and Wearable Sensors.
4.2.1 Non-wearable Sensors (NWS)
This KOA gait sensing modality can’t be worn on the body using these sensors, the diagnosis of KOA is performed on the basis of forces obtained from contact between foot and ground. Floor Sensors are used in NWS for the acquisition of KOA gait parameters.
-
(a)
Floor Sensors (FS)—These are the non-wearable sensors which make use of force sensors embedded in floor platform thus named as floor sensors. The force sensor platforms such as force plates, electronic and pressure mats, instrumented treadmill have the potential to directly make the estimate of the force vector. Transducers provide the GRF’s on which measurements are performed. At last, the obtained forces are transformed into electrical signals to compute Center of Pressure (COP). An example of such an electronic floor sensor used in the research study of Southampton University is shown in Fig. 11.
Fig. 11 
A prototype of floor or pressure mat (left) and the corresponding recorded footsteps on the instrumented mat (right), taken from [109]. Reproduced with the permission from Southampton University

Kotti et al. [10] proposed a system to determine the reliability of rule-based approach for comparison of 47 KOA and healthy subjects. They made use of two Kistler force plates on 6 m long walkway having piezoelectric three-component force sensors to collect subject’s data. A 5-fold cross-validation (CV) accuracy of 72.61% ± 4.24% was achieved, employing Random Forest regression learning approach.
In other work, Elbaz et al. [44] used a computerized walking mat (GaitMatMII system) and successfully classified the KOA male and female (including 2911 knee OA patients). An accuracy of 89.5% for females and 90.8% for males was achieved using K-means method and Classification and Regression Tree (CART) model.
With the integration of 2 Kistler force platforms and a treadmill, Mezghani et al. [89] proposed to develop a system to differentiate KOA and healthy subjects. Using GRF’s parameters and Nearest Neighbor Classifier, overall accuracy of 91% was achieved.
4.2.2 Wearable Sensors (WS)
In contrast to NWS modality, another modality seeking attention for KOA gait collection is wearable sensors. In order to enable the gait to be captured using wearable sensors, a subject has to wear the sensor on the body. Wearable sensors based modality is further subdivided into different types on the basis of their function.
-
(a)
Inertial Sensors (IS) These are the electronic equipment’s established on the concept of inertial measurement. The measurement of subject’s body can be performed by employing three main devices such as accelerometer (measures acceleration), gyroscopes (angular velocity), magnetometers (magnetic force computation) and sometimes combination of all three. Using IMU’s, it is possible to perform linear and angular measurements efficiently [110]. Tereso et al. [92] proposed a study to examine the Spatiotemporal, posture and fall-related features in KOA patients after Total Knee Arthroplasty (TKA). Crutches, standard walker (SW) and Rollator with Forearm Supports (RFS) were used to check their capability in KOA rehabilitation and the gait was recorded using two inertial sensors. MANOVA with repeated measures shown the differences among all the spatiotemporal features (p < 0.05). Also, SVM predicted the best stability using SW and RFS in which gait of patients was more closely related to normal ones and revealed the importance of time in gait evaluation.
In other work, Bolink et al. [95] aimed to examine the biomechanical gait features of KOA patients using only a single inertial sensor. An enhanced 3D inertial sensor configuration of gyroscope and accelerometer was applied to analyze spatiotemporal as well as kinetic features. Results indicated the potential of inertial sensors in KOA and analyzed that KOA subjects walk with less speed, flexion and more trunk lean.
-
(b)
Electromyograph (EMG Sensors) EMG sensors are the devices used to inspect the muscles electrical activity using a device known as Electromyographs. In KOA, muscle electrical signals representing electrical activity and muscle patterns of patients varies to a larger extent. These patterns represent the strength of muscles and enable the computation of different gait characteristics. EMG sensors perform their function either using inserted sensors, consisting of wire or needle/surface electrodes made up of integral electrodes.
Kozey et al. [43] intended to determine the changes occurring in the knee of 38 KOA patients with time as compared to healthy controls. Surface EMG electrodes were used to analyze lower limb motion, GRF’s and other kinetic moments. Using inverse dynamics and Principle Component Analysis (PCA), it was analyzed that changes in gait speed (1.25–1.17 m/s from baseline to follow up) and muscle activity (p < 0.05) for both groups varied due to age and other related factors.
Again, in another study, Kozey et al. [97] tried to characterize the knee joint muscles pattern in 51 patients with severe KOA using some pattern recognition methods. Electromyographic data was collected for patients using Silver chloride surface EMG (S-EMG) electrodes. About 97% of the variance and differences in EMG waveform was detected using Analysis of Variance (ANOVA) models which indicated that people with KOA walk with low velocity than healthy subjects.
-
(c)
Electrogoniometry (EGM Sensors) These sensor-based modalities are used to quantify joint angles of the body such as ankle, knee, hip etc. repeatedly without any interruption. Based on analyzed fluctuations in angle, these type of modalities are capable of measuring the amount of deviation in the physical signal. Two types of electrogonimeter were in major use including Potentiometer-attached with the joints rotator points but due to its bulky nature inducefrustration in ambulation. Another was Strain Gauges, also known as the flexible electrogonimeter made of flex spring with plastic and blocks on each end. These devices were light weighted, portable and can be applied easily [82]. So, in spite of having great potential of measuring joint angles these devices are very painful to wear.
The use of EGM can be seen in the study performed by Tarnita et al. [12]. They tried to examine flexion–extension moments, angles between KOA and healthy group by collecting kinetic and kinematic data using a treadmill and two electrogoniometers. Statistical analysis revealed that Knee OA subjects had less max flexion (69.01 deg.) for affected knee and max amplitude (51.73 deg.) than healthy ones. Also, the healthy knees of the patients shown less flexion than the other group.
-
(d)
Other Sensors Irrespective of all the non-wearable sensor modalities discussed above, there are few other preferred for capturing KOA gait. This includes pressure shoes, Ultrasonic sensors and Smart garments. Pressure shoes, also known as instrumental insoles are positioned within the confines of shoes inside and impart the weight or load information applied on sensors. Organero [48] presented a study to evaluate the efficiency of eight insole pressure sensors embedded inside the shoes in KOA investigation. KOA and healthy control group was identified based on different types of classifiers i.e. SVM, Logistic regression model, Multilayer Perceptron (MLP) and Tree-based classifier. Average heel, mid-foot and forefoot pressure was determined and results demonstrated the efficacy of tree-based classifier than all other classifiers.
Ultrasonic sensors are used to achieve gait related parameters such as the number of steps, stride length and other related characteristics. Kiss et al. [101] focused on examining the relation between gait variability of KOA patients and its severity. Patients were strictly instructed to walk at three different speeds to assess the effect of speed on KOA subject’s gait, with different severities. An ultrasound-based system (a triplet of UV sensors) was used to analyze gait motion. The study outcome indicated that variations of gait among different severities of KOA are gender dependent and should be considered carefully while analysis of KOA.
Finally, we included smart garments also named as sensing fabrics in this category. They are specially designed by the aggregation of sensing technology and fabric in which sensors are infused in normal fabrics and have flexibility. Bergmann et al. [100] made an effort to propose a new clothing sensor system in which sensors were installed inside the clothes. Knee joints measurement was performed to compare the proposed system with a gold standard system. The coefficient of determination more than 0.99 between two systems shown the reliability of the proposed system for KOA monitoring.
Chen et al. [91] developed a mechanism to evaluate three rehabilitation exercises namely Short Arc Exercise (SAE), Straight Leg Raise (SLR) and Quadriceps Strengthening Mini-squads (QSM) for KOA patients using the combination of three OPAM inertial sensors and a goniometer. Results demonstrated high potential in KOA assessment by providing exercise classification accuracy of 97.29% and posture and classification accuracy of 88.26%.
Table 2 gives the description of work done on sensor based modalities either used alone or in combination with other sensors and attained accuracy.
Data reveals that much of the research is focused on using FS due to its tremendous capability of directly capturing the gait parameters without involvement of any complex procedure for the patient but they are very expensive to use. Out of 32 articles on sensor-based modality, 11 are FS based, 8 are IS based, 6 are EMG, 4 on other sensors and 3 on EGM based, showing more focus on FS. Percentage Utilization of different sensors in Sensor-Based (SB) modality is defined in Fig. 12.

Description of percentage use of various sensors in sensor-based KOA gait capturing modality
4.3 Combined
Apart from these modalities, most of the studies are focused on using the amalgamation of properties and characteristics of sensor-based and vision based modalities [111,112,113]. The purpose was to capture the advantages of both suppressing their drawbacks. Metcafe et al. [102] evaluated KOA subjects by collecting data using twelve VICON MX2 cameras, three AMTI force plates and a plug-in marker set attached to subject’s. The combination of modalities to capture KOA gait yielded an accuracy of 95% and 92.5% for affected and unaffected knees.
In another research, Phinyomark et al. [41] proposed a study to investigate the effect of gender on 100 KOA gait subjects. The data was acquired using a combination of 8 camera VICON Mocap system, 9 mm retroreflective markers and a Bertec treadmill. Using SVM to differentiate both groups based on kinematic joint parameters successfully gained an accuracy of 98–100%. Results have shown the relevance of gender for gait variations in KOA and healthy subjects.
Another study by Koktas et al. [106] used a combination of vision and sensor-based modality to analyze gait variations among 150 KOA subjects with different severity levels. Reflective markers, a force platform and a set of video camera was used to perform measurements while walking. Outcomes demonstrated the potential of pooled classifiers (Decision Trees and Multilayer perceptron) in KOA analysis with a success rate of 80%.
Table 3 provides the summary of combined i.e. vision based and sensor based modalities along with the key findings and accuracy rates. The analysis of considered state-of-art literature indicated much of the focus on combined gait acquisition modalities for KOA diagnosis. About 72% of research seen to be done on this modality, reflecting its potential in KOA diagnosis as depicted by Fig. 9. Since the combination of different modalities offer additional data of the subject to be captured and analyzed and may offer more diagnostic accuracy for KOA identification. So these modalities are preferred by most of the studies to enable more effective KOA analysis but are also limited by large space and heavy set-up requirements.
5 Feature Representation Based on KOA Gait Acquisition Modalities
A feature is a distinctive characteristic that provides a unique identity to a person. Based on this unique attribute, it is possible to determine abnormal conditions of an individual. Various approaches can be used to represent different gait features in KOA. An approach is simply the method, as a result of which relevant features can be determined for efficient diagnosis. In OA, gait features such as Knee Flexion Moment (KFM), Knee Flexion Angle (KFA), speed, stance and swing time etc. has a great significance to enable proper detection of the disease.
In this section, a complete description of various approaches for identifying unique KOA gait features are given. A taxonomy is formed for KOA gait features under different approaches as depicted in Fig. 13. Tables 4 and 5 summarized various KOA feature representation approaches used alone or in combination by different studies.
Based on taxonomy shown in Fig. 10, different KOA features can be extracted and used. We have categorized these approaches into six main sub-categories [49] i.e. anthropometric, spatiotemporal, silhouette, kinematic, kinetic and hybrid. Here different colors are used to clearly explain-which KOA gait feature data is captured by what modality. At the leftmost top of Fig. 13 inside a large rectangular box, three small square type boxes in the first row (purple, green and grey) indicates that employing vision based modality using markers for KOA gait acquisition, results in features of three approaches-anthropometric, spatiotemporal and kinematic. Similarly, small square boxes in the second row (purple, green, grey and orange) represents that using data acquired by vision-based marker-less/model-free modality, four parameters can be extracted under four approaches i.e. anthropometric, spatiotemporal, kinematic and silhouette based features. Alike square boxes in the third row (purple, green, grey and pink) depicts four features-anthropometric, spatiotemporal, kinematic and kinetic features that can be extracted using sensors based data recording. Lastly, blue box in the last row representing the consolidation of all the gait approaches features (anthropometric, spatiotemporal, kinematic, kinetic and silhouette) inside a small rectangular box, that can be obtained using two or more categories of modalities (vision based + sensor based) together. Further investigation of these approaches for KOA analysis is as follows:

Various KOA gait features representation approaches obtained using different acquisition modalities
5.1 Anthropometric
This approach involves KOA demographic data features that represent the quantification of the size of the human body, as each and every individual has own body structure and properties. It involves age, weight, height, BMI, gender, rating score, disease duration etc. to use in KOA analysis. For reliable KOA diagnosis, it is necessary to consider all the aspects of a person, so this data is recorded for each individual involved in the study.
In Asay et al. [35] study, demographic data of KOA patients and healthy subjects such as age, weight, height, BMI was recorded for accurate analysis of both the groups. Also, WOMAC and Visual Analog Scale (VAS) pain scores were used to grade the KOA severity.
In another work, Monil et al. [123] collected the information about KOOS pain score, height, weight, BMI, age and gender of healthy, Medial KOA and subjects with lateral KOA. The purpose was to only involve the matched demographic data of healthy and KOA individuals.
5.2 Spatio-temporal
This is the most widely used approach to facilitate KOA diagnosis. As name suggests, the features used in this approach can be used to characterize or distinguish gait patterns by extracting stance and swing phase related time and distance measurements [133]. This includes stride length, step length, step width, traversed distance etc. as the spatial (distance) features and stride, step period, cadence, velocity, Single Limb Support (SLS), Double Support (DS) etc. as temporal (time) features. Out of the considered features, stride length parameter is of utmost importance since it represents one gait cycle length which can be effectively employed for diseased gait diagnosis in KOA.
Sun et al. [103] proposed a study to analyze and evaluate the correctness of IDDEEA3 system against Go Pro Hero3 high speed camera. Five spatiotemporal features (gait cycle, velocity, cadence, step length, and step counts) of 23 KOA subjects and 12 healthy controls were extracted to evaluate the new system’s performance. The error was estimated to determine the differences in measurements using the formula:
where E denotes error, MR is the motion results, GPR refers to Go Pro results and IDEEA3 represents IDEEA3 system results. The results obtained for IDDEEA3 were consistent with the Go Pro camera (e.g. gait cycle, cadence measurements with high speed camera and IDDEEA3 system were 0.913 ± 0.06 and 0.916 ± 0.065, 131.991 ± 9.243 and 131.625 ± 9.748) which indicates the high capacity of the proposed system to determine spatiotemporal features for KOA diagnosis.
In another article, Elbaz et al. [44] used spatiotemporal gait features (velocity, cadence, step and stride lengths, base of support, step time, swing time, stance time, SLS time, DLS time) for KOA assessment. Using k-means clustering and CART model, they were successful in classifying male KOA patients with an accuracy of 90.8% and females with 89.5%. Outcomes demonstrated the importance of spatiotemporal features in KOA identification.
A study by Falconer et al. [134] presented a very simple, inexpensive method to identify 43 KOA subjects. Spatiotemporal features (step length, cadence, stride width and velocity) were analyzed using footprints obtained by a runway of carbon paper. Results depicted reliability of the used method for KOA recognition purpose.
5.3 Silhouette
This approach is used to represent silhouette features. These features are the result of employing model free Marker less approach for KOA gait acquisition. The silhouette attributes are extracted directly from image plane known as Silhouette image and include the shape of silhouette, body posture observing Center of Gravity (COG) shifts, torso orientation, height, width of Bounding Box (BB), Gait Energy Image (GEI), etc.
Verlekar et al. [37] successfully employed automatic recognition of gait pathological disorders using body and feet related features. After extracting silhouette using background subtraction, a body related feature i.e. Amount of Movement (AOM) was measured that describes the amount of motion in arms and lower limbs during walking. To calculate AOM, initially the silhouette was cropped for each frame, numbered from (1 to Q) and then averaged to estimate GEI (Gait Energy Image) over half cycle. At last, AOM was estimated using Shannon entropy defined as
In Eq. 3, Qj is the probability indicating j is equal to the distance among two neighboring pixels and AOMVB denotes the amount of movement. The study provided good results (about 98.8% accuracy) but overlapping problem made the shape and movements of upper and lower extremity unclear.
5.4 Kinematic
Kinematic approach especially includes the motion parameters that allows the gathering of motion as well as geometric details of the human body [50]. These features are obtained using markers and vision based modality. To analyze them, retro reflective markers may be active or passive are attached to the human body. Based on the position of such landmarks, various features are extracted including joint angles are extracted such as Knee Flexion angle (KFA), knee Abduction Angle (KAM), joint positions, acceleration, motion trajectories etc. for further calculations [49, 133].
Ishikawa et al. [31] used angular parameters such as elevation angles, flexion angles to analyze the subject’s gait presented in Fig. 14.

A representation of elevation and flexion angles considered by the study [31], using a human body structure model (a). UP denotes upper part of the body including-head, arms, and torso while DOWN represents lower body section including-hip, knee, ankle, thigh, and toe. In stick (b), θthigh, θshank and θthigh are three elevation angles made between hip and knee joint, knee and ankle joint, ankle joint and toe in vertical direction. c represents knee flexion angle made between thigh and shank
Elevation angles are made in sagittal plane between segment and Y-direction. Similarly, knee flexion angles are made between the thigh and shank portions. The differences among these angles made by subjects during locomotion provided important evidence of planar law applicability for KOA diagnosis (p < 0.01) with cumulative ratio greater than 0.98.
5.5 Kinetic
The kinetic approach is related to the features that embrace the study of forces and moments which are caused by the movement of body segments during walking. These features give attention to the forces produced by the interaction of foot and ground. There are different sensors that can be used to capture kinetic data. Each sensor has its own capability such as force, acceleration can be obtained using floor sensors, angular velocity and Moment of Inertia (MOI) etc. can be produced by inertial sensors. Similarly, EMG and goniometer sensors provide EMG signals, muscles activity, range of motion (ROM), momentum etc. Other sensors such as smart garments, insole shoes are capable of recording Ground Reaction forces (GRF’s) and other data.
In Kotti et al. [10] study, a system was proposed that takes kinetic features such as GRF’s as input and produces not only output diagnosing KOA but also illustrates the set of rules through which the decision was reached. A rule-based approach was applied and evaluated for KOA detection. Results showed the high capability of used approach for KOA by giving an accuracy of 72.61% ± 4.24%.
Organero et al. [48] used insole pressure shoes to study an important kinetic feature, i.e. pressure and to check their effectiveness in analyzing patients with mild KOA. The study concluded that the pressure for each mean foot strike in stance phase was greater in patients with KOA as compared to healthy controls indicating the potential of insole pressure shoes in recognizing the effect of KOA on walking.
Table 4 summarizes recent studies from 2000 to 2018 which have used spatiotemporal, kinematic, silhouette and kinetic approaches for KOA detection with accuracy rate. Here, except disease rating scale, no other anthropometric approach feature has been shown in the tables since it is considered by almost all the studies. Data indicates the large use of kinetic approach for KOA gait features representation as it provides direct measurements of knee joint forces, muscles activities during walking. Kinetic approach however can be effective in KOA analysis but the interpretation of the extracted gait features in the form of signals offer high complexity.
5.6 Combined/Hybrid
Instead of considering only a small number of features for evaluation, it is more reliable to utilize the combination of features such as spatiotemporal in combination with silhouette, kinematic and kinetic and many more for better KOA assessment. In this section, we analyzed the hybrid approach for the demonstration of KOA gait features. Table 5 gives the summary of recent studies on hybrid approach considering accuracy and classifier used to extract a combination of KOA gait features for successful diagnosis.
Sacco et al. [135] proposed a new KOA analysis cheap footwear named Moleca in combination with passive reflective markers. The objective was to determine the effect of used footwear and other modalities on KAM during stair descent. Kinematic and kinetic features such as joint centers, GRF’s were analyzed for evaluation of KOA. Results highlighted that for all foot wear, patients with KOA shown higher KAM (for barefoot-233.3%, p = 0.028, Moleca-379.2%, p = 0.004 and High Heeled-217.6%, p = 0.007) compared to healthy controls. The knee load was similar with barefoot and Moleca for all the stances but greater with high heeled during early stance. Thus, study demonstrated the efficiency of Moleca foot ware in KOA identification.
In another study, Monil et al. [123] proposed to analyze the combination of kinematic and kinetic features for medial, lateral KOA and healthy subjects including KAM, KFA for relative comparison with Center of Pressure (COP). Using logistic regression it has been analyzed that for healthy controls, Knee Adduction Angle (KAA) remains almost zero (an ideal value for a normal person), highest for medial KOA group i.e. 5.1 degrees and very small for lateral KOA, almost - 3.5 degrees. Similarly, highest Knee Adduction Moment (KAM) was offered by medial KOA subjects than healthy controls and smaller by lateral KOA group. Also, results indicated less reliability of COP in KOA diagnosis.
In recent years from 2000 to 2018, about 104 articles related to different KOA gait feature approaches are obtained excluding anthropometric since this general data is used in all the articles. Out of the total 104 studies, 75 are based on hybrid features, 22 are focused on kinetic features, 5 on spatiotemporal and rest on kinematic and silhouette features. Percentage usage of each is represented in Fig. 15.

Usage of each approach (in %age) for KOA features representation
Table 5 illustrates the findings of the selected articles (out of the total 75 articles) with rate accuracy and tool used. Data shows heavy research on hybrid approach features due to more accurate KOA analysis. Therefore, the research articles discussed in this study reflect extensive research on hybrid KOA features approach as it allows more features of the person to be extracted. Extracting a large number of features and then optimizing them may automatically lead to enhancement in system’s performance.
6 Performance Evaluation Methods in KOA Diagnosis
After selecting some optimized features, at last the performance of the diagnostic system is evaluated by employing some statistical methods. These methods are the assessment tests having a powerful capability to measure the accuracy of a system. In KOA, these measures were applied to check the efficiency of the used model to classify normal and abnormal gait.
In this section, a simple and broad description of commonly used statistical measures for KOA analysis is presented. Over time, a number of KOA performance evaluation measures have been developed and used by researchers [44, 48, 103, 115] shown in Fig. 16 to check the overall accuracy of the system.

Description of common performance evaluation statistical measures used for KOA analysis
Broadly statistical measures are classified into two main types: parametric, which makes the assumption on data to be normal (e.g. mean, standard deviation (SD), T test, ANOVA, Pearson’s Correlation Coefficient (PCC), Intraclass Correlation Coefficient (ICC)/Coefficient of variation etc.) and the other: non-parametric, which doesn’t make any assumption related to data so known as distribution less test (e.g. Chi sq. test, Kruskal–Wallis (KW) test, Kolmogorov–Smirnov (KS) test etc.) [136].
Confusion Matrices and Cross-validation (CV) are other vital measures used in recent studies for performance validation of the model [31, 37]. Also, two important evaluation measures i.e. Mean, and Standard Deviation are examined to be considered by almost all the studies. Thus, available data indicated the high potential of statistical metrics to evaluate the performance of KOA gait analysis system. A very frequently applied tests for evaluation purpose includes:
-
(A)
Chi Square Test
Chi2-test evaluates the inherent variability by comparing collected data and data that was restructured with predict.
Based on results (0–1) obtained from the test, it is convenient to accept or reject the hypothesis (a mere statement may be true or false) [44, 98, 125]. To interpret this non-parametric statistical method, a general equation is used which simply states that Chi2 value is the sum of observed data/freq. squared divided by expected data.
where \(f_{ob}\) and \(f_{ex}\) denotes observed and expected frequency, \(\chi^{2}_{chi}\) denotes Chi2 test value and \(\varSigma\) represents the sum of all the values obtained by performing computations on \(f_{ob}\) and \(f_{ex} .\)
-
(B)
ANOVA
If the size of the population becomes large (more than two), Analysis of Variance (ANOVA) provides the best solution by examining total amount of variation within each sample. ANOVA, a statistical technique specially designed to test whether the mean of more than two population is equal or not [15, 41, 43, 46, 87, 96, 115, 119, 135]. Considering the population A and other population X, the method can be given as
where \(\bar{A}\) denotes group A mean \(\hat{X}\) is the group X mean. An ANOVA can be one-way [87, 119] (includes single classification criteria with 1 independent variable and 2 levels) or two-way [128] (two classification criteria with 2 independent variable and multiple levels).
-
(C)
Intra-class Correlation Coefficient (ICC/IC)
An inferential statistic which is used when a unit is arranged in groups and quantitative assessment is performed on it, is known as Intra-class Correlation Coefficient. 1 value of ICC indicates a close relation between elements of group and 0 indicates no relatedness [103, 134]. Considering a dataset with P paired data items (vq,1, vq,2) for \(q = 1 \ldots P\), Mathematically, ICC can be defined as
where
Here, s denotes the ICC value, r2 is the variance and \(\bar{v}\) represents the mean of the dataset.
-
(D)
Pearson Correlation Coefficient (PCC)
PCC, the most commonly used statistical measure for correlation analysis, is also referred to as Interclass or Product Moment Correlation Coefficient. PCC is applied to measure the strength of linearly related variables [16, 42]. The value of this coefficient ranges from − 1 to + 1. Given X and Y as the paired classes, consisting of k pairs, sxyp can be presented as
where
Here \(\hat{x}_{i}\), \(\hat{y}_{i}\) represents the individual sample points of the class, \(\bar{x}_{v}\), \(\bar{y}_{v}\) are their respective mean k denotes the sample size, j is the number of elements in two classes and \(s_{xyp}\) is the PCC value.
-
(E)
t-Test (Student’s t-test)
Like ANOVA, T-test also referred to as Student’s T-test is used to check whether the mean of two groups are equal or not. To analyze this, T-score is calculated which is the difference between two groups divided by the difference between both groups. A small value of T-score indicates similarity between groups and vice versa. The particular choice of t-test depends on whether two samples are unpaired (independent) or paired (dependent) [11, 40, 48, 49, 87, 94, 102, 135].
Thus, T-test can be classified as: Independent (unpaired) [32, 124] which requires two samples to be tested at once so it is necessary to firstly determine the variance for both groups and the other is Dependent (paired) [131] in which one group is tested twice. So, before and after conditions encountered in this test.
-
(F)
Mean and Standard Deviation (SD)
Mean being an important statistical measure provides the average of given data observations [11, 44, 103, 114, 134]. E.g., X is the dataset having values \({\text{x}}_{1},{\text{x}}_{2} \ldots x_{{n_{v}}}\), then mathematically, it can be given as
where \(\hat{X}\) represents the individual value of data, \(n_{v}\) denotes the number of observations of data and \(\bar{X}_{m}\) is the mean value.
Similarly, SD gives an estimate of variability in data indicating how much value is far or close to the central mean. A small value of SD means closeness of data go mean and vice versa. If \(\hat{X}\) denotes the individual value of dataset X1, X2 … Xn and \(\bar{X}_{m}\) is the mean of the whole dataset; SD can be presented as
Here, nv refers to the number of values in the dataset.
-
(G)
Kolmogorov–Smirnov Test (KS)
Commonly known as KS test, is a non-parametric statistical test and is entirely agnostic. Given two sets of a dataset, KS test tries to examine whether the considered dataset varies significantly or not [35, 116, 118, 124, 128]. This test don’t require the data to strictly follow the normal distribution assumption. Thus, the basic purpose is to determine overall shape differences of the two samples, considering univariate and continuous data. The test statistic \(D_{ks}\) can be defined as
where NT is used to represent total count of data for distribution, i0 denotes the frequency of observation and \(F_{T} \left({\hat{Y}_{{i_{0}}}} \right)\) symbolize input numbers.
-
(H)
Kruskal–Wallis Test (KW)
KW test, a non-parametric test also named as one-way ANOVA on ranks have one dependent and one independent variable. In the situation where data fails to fulfill the assumption of one-way ANOVA, this test is applied [47, 122]. The test determines significant differences between two or more groups, making no specific supposition about normality. Mathematically,
where
Here, \({\text{n}}_{j}\) symbolizes the number of observations in group j, \({\text{S}}_{jv}\) denotes the rank of observation ‘v’ from group ‘j’, \(N_{p}\) is the total number of observations, \(\bar{S}_{j}\) represents average range of all observations in group ‘j’ and \(\bar{S}\) is the average of all the \(S_{jv}\).
-
(I)
Confusion Metrics
From recent years, a number of classification models have been developed such as SVM, Decision Trees etc. for KOA diagnosis. To evaluate the performance of such models, confusion matrices are the most widely used measures.
Confusion matrix involves four important identities [31, 88, 89, 107]:
-
True Positive (XTP): total number of positives truly classified as positive.
-
True Negative (XTN): total number of negatives truly classified as negative.
-
False Positive (XFP): total number of positives wrongly classified as positive.
-
False Negative (XFN): total number of negatives wrongly classified as negative.
In general, these metrics can be represented as
Here Eqs. (18)–(23) represents True Positive Rate (TPR), True Negative Rate (TNR), Positive Predicted Value (vP), Negative predicted Value (NPV), False Negative Rate (FNR) and False Positive Rate (FPR).
Based on these evaluation metrics parameters, accuracy and F-score can be easily determined and given as
-
(J)
F-Score is the beneficial performance measure for multiclass classification. Taking precision and recall into consideration, Total F-score is measured [135]. Highest value can be 1 implies higher predictive capability of classifier and the lowest can be 0 i.e. \(0 \le F_{SC} \le 1\). In scientific terms, it can be presented as
$$F_{SC} = 2 * \left({\frac{{v_{P} * v_{R}}}{{v_{P} + v_{R}}}} \right)$$(25)where \(v_{P}\) and \(v_{R}\) denotes precision and recall. Therefore, confusion metric [31] (error metric) gives the estimate of performance by calculating positives and negatives in data. When some conducted to analyze the performance of a model, the probability of occurrence of Type-1 (α) (discarding a claim when it is true) and Type-2 (β) (accepting a claim when it is false) errors get increased. In this case, a formula is applied to correct the error rate known as Bonferroni’s correction (BC) [13, 121, 122, 137]. The use of such correction reduces the size of critical α, thus suppressing the effect of error occurred due to XFP and XFN in data. BC formula can be defined as
$$\alpha_{{BC_{new}}} = \frac{{\alpha_{org}}}{K}$$(26)where \(\alpha_{{BC_{new}}}\) implies new alpha to correct Type-1 error, \(\alpha_{org}\) indicates error alpha and K is the number of comparisons.
Once the statistical performance measures have been applied, the obtained results are analyzed using ROC [31, 34, 95] referred to as Receiver Operating Curve. ROC thus provides the common way to visualize the accuracy of a binary classifier and gives the value called AUC (Area under Curve). The curve is plotted between TPR (drawn on Y-axis) and FPR (drawn on X-axis) i.e. sensitivity versus (1-specificity). A value of 1 represents the best AUC and worst by 0.5. So, higher the AUC, better is the test.
Yuki Ishikawa et al. [31] used ROC curves to analyze the performance of the system on applying planar law for KOA identification, displayed in Fig. 17.

Describes the outcome of existing (blue dotted line) and proposed method (bold purple line) by ROC curve, taken from ref [31]. Y-axis represents specificity and X-axis indicates sensitivity. The threshold change between 0 and 50 considered as 0.01. Upper area (left) shown better differences between the two and coincide condition is depicted by the small dotted black line. (Color figure online)
Various studies included cross-validation [10, 32, 34, 91] as an important statistical validation technique. The scheme provides an estimate for selecting best fit model thus achieving good results.
7 Overview of Machine Learning Techniques (MLT) in KOA Diagnosis
In the present era of automated diagnosis, the use of Machine Learning is increasing day by day. This is the key enabler of Artificial Intelligence (AI) where the purpose is to create intelligent machines like humans, by artificially incorporating knowledge in them. Machine learning techniques consist of a set of algorithms that have the capability to perform different tasks and achieve reliable accuracy by learning through examples.
In a diagnostic system, final stage consists of using a classifier to enable the identification process. The features extracted in previous steps acts as input to train the classifier. The accuracy of the system depends upon how well the training is performed. Machine learning developed its root in various fields to solve important problems such as business, science, industry, medical and other applications. In medical, diagnosis of a disease is a no more difficult task due to high efficiency of machine learning techniques. It has shown its greater usage in recent years to enable accurate detection of KOA and their proper rehabilitation. A pictorial demonstration of percentage usage of different techniques is also presented, from (2007–2017), indicating its potential to provide a robust solution to problem KOA diagnosis.
Machine learning techniques can be broadly categorized into two sub-categories i.e. Supervised and Unsupervised. Supervised Machine Learning techniques (SMLT) are further based on classification techniques [49] and regression learning models. Similarly, unsupervised Machine Learning Techniques (USMLT) include clustering and association methods. Since clustering techniques are used by most of the studies so we will only focus them. Some researchers have combined both types of learning techniques to get enhanced performance, known as Hybrid machine learning technique.
7.1 Supervised Machine Learning Techniques (SMLT)
Supervised machine learning is the task of determining a function from a labeled data (having independent and a dependent variable). It involves the use of a supervisor to train the classifier with a set of inputs as well as their corresponding outputs. The model is trained on the labeled dataset, so it can predict the outcome of out-of-sample data. The main purpose of using this type of learning is to reduce the chance of occurrence of an error. Various classifiers are used under supervised learning such as Supervised Machine Learning (SVM), Random Forests (RF), Decision Trees (DT), Artificial Neural Network (ANN), Regression Models, for KOA classification.
-
Support Vector Machine (SVM) is most commonly used for diagnosis of KOA. It can be viewed as frontier which best segregates two classes of labeled data using the concept of hyper-plane. The main objective is to design a hyper-plane that classifies all training vectors in two classes. They have the greater capability to work with a large number of features without involving complex computations. Phinyomark et al. [41] applied SVM to analyze kinematic differences between male and females for both KOA and healthy and classification accuracy of 98–100% was achieved. In another work, Levinger et al. [34] used the concept of SVM and multiclass SVM to identify people with TKR, KOA and PFPS. According to the study, SVM for data classification can be represented as:
$${\text{S}}_{\text{new}} = \left\{{\left({{\text{u}}_{1},{\text{v}}_{1}} \right),\left({{\text{u}}_{2},{\text{v}}_{2}} \right) \ldots \left({{\text{u}}_{\text{l}},{\text{v}}_{\text{l}}} \right)} \right\}$$(27)where ui is the element of Zn
$${\text{v}}_{\text{i}} = \left\{{1, - 1} \right\}$$Here, ui represents vectors containing gait features, vi denotes corresponding class labels (+ 1 means disease and − 1 indicated healthy). They also employed modified SVM to differentiate data with more than two classes such as the involvement of different subject groups. Considering ‘m’ classes in the dataset, a combination of m (m − 1)/2 SVM classifiers were used to build modified SVM. An accuracy of 85–92% was achieved using SVM. On applying modified SVM, an enhanced accuracy was seen on test data indicating the potential of SVM in KOA detection.
-
Decision Tree (DT): classifier is based on flowchart-like structure where each internal node represents a test on the attribute and each branch indicates the outcome of test. DT have high potential in handling both numerical as well as categorical data and requires very little effort for data preparation. In KOA decision analysis, it can be used to visually and explicitly represent decisions and for identification and classification of KOA. A study by Organero et al. [48] successfully classified KOA patients from healthy controls using different classifiers such as SVM, a combination of LR and MLP, EM clustering and DT. Out of all the classifiers, DT has shown high performance with a classification rate of 100%. Another study by Chen et al. [91] checked rehabilitation accuracy of three different exercises—SAE, SLR and QSM in KOA patients. DT outperformed KNN with an accuracy rate of 98–100% for KOA rehabilitation.
-
Random Forest (RF): are the most popular and powerful SMLT which are capable of performing both classification and regression tasks. RF technique creates a forest with a number of decision trees. This is mostly preferred when a large dataset with higher dimensionality is present. In KOA diagnosis, it is proved to be a successful technique having numerous benefits.
Kotti et al. [10] using RF regressors and cross-validation achieved an accuracy of 72.61% ± 4.24% for identification of KOA and healthy subjects. Results demonstrated the high capability of RF rule-based approach in clinical KOA diagnosis.
Artificial Neural Network (ANN): is based on the biological structure of the human brain. As brain consists of billions of neurons that work in combination with each-other i.e. receiving input, processing it and producing output. Achieving this functioning artificially is known as ANN. In ANN, a node which is the replica of a neuron in the brain, receives input from the external environment, processes it and gives the desired output. In KOA diagnosis, Multi-Layer Perceptron (MLP) ANN are mostly considered due to greater capability to deal with large computation problems. MLP is a perceptron network having multiple layers i.e. input, output, and more than one hidden layers. A research work by Favre et al. [13] applied a feed-forward MLP having one hidden layer for KAM computations in KOA and healthy controls. The network was trained using back propagation algorithm. The similarity between KAM curves of both groups shown the efficiency of ANN for a broader evaluation of KOA. In another study, Koktas et al. [107] proposed a study to analyze several ensemble techniques to develop a semi-automated system for diagnosis of people with KOA. Kinematic and Spatiotemporal features were used to train a set of MLP’s for classification of 110 KOA and 91 healthy subjects. Results demonstrated the efficiency of used MLP’s combination in KOA investigation with success rate of 87–92% was attained.
Again, Koktas et al. [106] presented a study to evaluate the performance of mixed classifiers in identification of KOA using vision and sensor based technologies. A Decision tree (DT) classifier build with the MLP successfully achieved the purpose by giving an accuracy of 80%. Munoz et al. [48] tried to investigate the asymmetry in pressure to analyze the differences in gait of KOA and healthy controls. Sensors embedded shoes were used and evaluation was performed using a bundle of classifiers. The combination of logistic regression and MLP attained an accuracy of 95%, closer to that of DT, reflecting its potential in KOA detection.
Regression Learning Models: are one of the important supervised machine learning algorithms used by various studies to classify KOA patients [10, 44, 125, 127]. Different types of regression models have been used to achieve KOA classification task. A linear regression model having a 1:1 relation between dependent and independent variables applied by Mayera [118] diagnosis. In contrast to the linear model, multiple regression having one dependent and more than one independent variables was used in the study of Matsumoto et al. [104]. They investigate the relation between KOA and variations in gait with a risk of falling in KOA adults.
Another useful classification model in supervised learning is the logistic regression model. In these models, prediction of output is transformed using a non-linear function called the logistic function. Farrokhi et al. [40] used multiple regression to successfully investigate the relation between stability and level of pain in KOA subjects. Similarly, the use of hierarchical regression models which involve running independent variable one at a time or in sets, made by some researchers. A study by Zeni Jr et al. [120] employed hierarchical regression to test the effect of different walking speeds on biomechanical variations in KOA subjects having different severities.
7.2 Unsupervised Machine Learning Techniques (USMLT)
Unsupervised machine learning techniques are considered when data in the training set is unlabeled i.e. there are no training examples available to train the model [49] and no corresponding label that is paired with the samples. In this case, to evaluate the model how well it is performing, other similarity measures such as cosine similarity, Mahalanobis distance [48] can be used. In recent years, several unsupervised clustering techniques are used for the diagnosis of KOA such as K-means, Expectation–maximization (EM) clustering algorithm, Fuzzy models etc. These techniques form clusters of data in dataset based on their similarities and dissimilarities and lead to the diagnosis of diseased and healthy ones.
Chen et al. [91] explored the KNN clustering technique to classify exercise type for KOA patients after rehabilitation using three devices and achieved 94% accuracy. In another study, Organero et al. [48] used EM clustering technique to diagnose early-stage KOA subjects. Similarly, a point cluster technique was applied in a study by Chehab et al. [116] to estimate gait variations among KOA and healthy controls for reliable diagnosis.
Some studies utilized the combination of two or more techniques to achieve an improved accuracy rate. In a work, Koktas et al. [106] proposed to combine decision trees with MLP to achieve better accuracy. A success rate of 80% was achieved on KOA subjects.
7.3 Hybrid Machine Learning Techniques (HMLT)
In spite of combining similar type of machine learning techniques to each-other (e.g. SMLT with another SMLT), a semi-supervised machine learning platform was developed by some researchers using the combination of SMLT and USMLT [49]. This learning approach has the great potential to deal with limited data with high efficacy. A hybrid machine learning approach was adopted by Moustakidis et al. [88] combining fuzzy decision tree-based SVM (Fuzzy DT-SVM) classifier to investigate KOA subjects with different severity levels. The used combination yielded an improved accuracy of 93.44%.
A brief summary of mostly adopted machine learning techniques for KOA diagnosis considering their significant benefits (+) and drawbacks (−) is defined in Table 6.
Based on the available data from 2007 to 2017, usage ratio of machine learning classifiers for identification of KOA, shown in Fig. 18. It is analyzed that about 81% of research focused on using SMLT, 16% on using clustering based USMLT and only 3% towards hybrid techniques. Out of the total percentage usage in SMLT, almost 41% of work done considering regression learning models, 16% on SVM, 9% towards DT. ANN contribution is seen to be approx. 12% and 3% studies used RF for KOA identification.

A pictorial representation of usage rate of different Machine Learning Techniques (in %age) from 2007 to 2017
Therefore, the State-of-art survey indicates the usefulness of SMLT for diagnosis of KOA due to its several benefits such as easiness in understanding, specific nature, well-known input data and more accuracy.
8 Future Perspectives
The necessary prerequisite, fundamental to any research is to qualitatively and quantitatively examine, analyze and explore the existing literature and identify the gaps in the previous studies. This forms the baseline for carrying out research and for proposing a model/approach to overcome the challenges identified. This section provides an insight to the existing methodologies/approaches by doing their critical analysis considering their scope in future. KOA gait recognition though has gained huge popularity due to a plethora of benefits it aims to provide to clinicians but the scope of improvement with the existing approaches still remain large which attracts researchers and academicians towards this field of study to provide better and more robust automated systems. Unresolved issues in KOA analysis that pose main challenge towards effective KOA diagnosis need to be addressed. They are as follows.
-
(A)
Gait Dataset Creation
To initiate any detection or classification task, it is necessary to have a proper set of related data. The performance of the entire system depends on the availability of dataset. Thus, one of the main perspectives is to create a clinical gait dataset and make it public to researchers for further investigations. It is pertinent to mention here that no dataset is publicly available for KOA. Some of the datasets used in earlier studies were self-created and are currently unavailable. Also, they involve some crucial drawbacks such as less number of KOA subjects i.e. very small sample size, consideration of only single gender etc. They are not reliable for pathological gait analysis. In other words, there is less dataset on gait considering pathological diseases compared to other biometric. So, the research can be directed towards the creation of a new dataset including both normal and abnormal KOA gait samples. The clinical records of KOA like many other diseases, exhibit a striking disparity between the genders and reflects females affected adversely with the disease in comparison to male counter parts. Genetic and hormonal factors are the main causes responsible for the disparity. In addition to factors such as knee injury, genetics or obesity that directly influence knee mobility; the aging process too leaves an impression due to changes in the musculoskeletal system that increases the tendency of KOA. Therefore age and gender of subjects is crucial for the study so as to investigate the effect of these parameters on KOA susceptibility and how it affects the knee, over a period to develop KOA.
-
(B)
Self-occlusion Avoidance
In an abnormal gait such as KOA, sometimes the problem of self-occlusion is observed. It refers to a condition when the differentiation between left and right limb becomes very difficult during abnormal walking. Due to self-occlusion, false recognition rate increases that affect the overall classification accuracy. So the focus of researchers can be directed towards solving this problem by splitting the subject under study to multiple components and then reconstructing the occluded body parts using efficient and appropriate approaches.
-
(C)
Background Modelling
Background Modelling is a crucial task in a recognition process. Extraction of foreground from background effectively needs complete and proper understanding of background subtraction techniques and its applicability. In previous work, it is examined that the major cause of inaccurate classification results is due to the use of inappropriate foreground detection methods. Verlekar et al. [37] employed background subtraction cues to extract silhouette images from background for further processing. From extracted silhouette, amount of body movement, COG shifts, Torso Orientation (TO) and feet related features were then extracted and analyzed. Lack of efficiency in earlier steps lead to inaccurate results in later stages. So the future work can be focused towards the use of appropriate background and foreground segmentation methods for effective KOA detection.
-
(D)
Feature Space Reduction
Using a large number of features and achieving good results is not much of worth as it costs on the performance and scalability. Feature space reduction is the process of selecting features in such a way that dropping some of the irrelevant variables among all, does not affect the overall performance of the system.
Kobsar et al. [15] and Derek et al. [115] applied the Principle Component Analysis (PCA) for feature selection to enable better classification accuracy. Another work by Hubley et al. [43] also used PCA to select lower limb features from Ground Reaction Forces (GRF’s) and EMG data. Thus using a single robust and hybrid approach that helps in feature dimensionality reduction by selecting the best optimized features is the major concern of this article.
-
(E)
Severity Level
The proper diagnosis of a disease is not possible unless it is checked for all the severity levels. Factors such as peripheral joint involvement, patient’s assessment of severity of disease, physical examination on the basis of health assessment questionnaire, laboratory tests etc. need to be considered for holistic evaluation and assessment of the severity of the disease. Recent studies indicate that KOA patients show different gait characteristics at different stages of the disease. Several researchers analyzed KOA at only one or two severity levels thus not considering all that need to be focused. Chang et al. [127] conducted a study for diagnosis of KOA considering only early stage patients. Duffell et al. [128] also experimented mild stage patients to analyze knee Osteoarthritis. Therefore, future work should take into consideration the examination and assessment of knee OA disease at different stages of severity in order to cover each and every aspect of abnormal change.
Furthermore, Table 7 summarizes the limitations and future work of some latest KOA articles, in various journals from 2014 to 2018. The table discussed reflects the grey areas that still require deliberations from the side of the research community.
9 Proposed Work
Based on the aforementioned future perspectives, we have planned to direct our efforts on clinical gait recognition considering KOA patients with different severities and normal healthy subjects. Following objectives are considered for the proposed work:
-
1.
Creating a new dataset of KOA subjects having different severity levels and healthy controls based on age and gender.
-
2.
Collecting KOA and healthy gait data considering sagittal plane from left to right and right to left, shown in Fig. 19.
Fig. 19 
Workflow of proposed system for KOA and healthy subject’s identification. Left part of the figure represents gait samples of KOA and healthy subjects with two view directions (left–right and right–left) in the sagittal plane
-
3.
Perform pre-processing by applying a method to remove noise from acquired data (i.e. filtering of data) and segment the object to build a geometrical model.
-
4.
We adopted a model-based approach due to its high efficiency in detecting body joints, no need of color contrast, overcomes background cluttering problem.
-
5.
Extract subjects gait features using model-based approach for identification of diseased and normal persons.
-
6.
Use nature-inspired or hybrid approaches to optimize features for their reliable selection.
-
7.
Perform evaluation of proposed system using a robust classifier giving high and improved accuracy rate for differentiating KOA and healthy ones.
-
8.
Perform comparative analysis for diagnosis of severity level based on proposed model-based approach and clinical radiographic grading score.

10 Conclusion
In clinical practice, automated diagnosis of KOA through biometric gait is an evolving research area drawing the attention of huge researchers. Development of gait biometrics as a diagnostic tool for KOA has changed the face of subjective clinical assessment. This article provides a comprehensive survey that shows the extent of work done on sensor-based, vision-based and hybrid KOA gait recognition highlighting the most significant one.
The survey summarizes the efforts made by major contributors from ancient times to the Modern era in the medical field. The gait acquisition modalities, feature representation approaches, evaluation methods, and machine learning techniques have been discussed in detail.
Data analysis reveal that even vision-based modality for KOA diagnosis is highly accurate and cost-effective but suffers from certain drawbacks such as overlapping, requirement of large space and high precision cameras etc. Sensor-based modality, however, performs well but is also constrained by factors such as high cost, large time and power consumption, wearing difficulty, etc. The survey done on articles published during the period from 2000–2018 on above-mentioned modalities found approximately about 70% research articles, devoted to hybrid modality for KOA study. Among sensor modality, force sensors in particular being the most utilized sensors due to its capability to directly capture the gait data.
Further, the recent research statistics indicate achieving good measures of accuracy when sensor and vision based modalities are used individually. However, an amalgamation of vision and sensor based modalities definitely provide an edge over the modalities when used individually. Higher efficiency in capturing large and more relevant KOA gait data is the key factor attributed to better performance accuracy. Literature thus clearly reveals the potential of combined features for better KOA diagnosis.
Furthermore, extracting a single feature from KOA gait results in average accuracy of around 85 to 90%. This accuracy rate can further be improved by using an appropriate fusion of KOA gait features as it can help in reducing misclassification rates. The article inclusively surveys statistical methods and classification techniques used for KOA analysis. Based on the number of articles received from recent years, most researchers have used supervised learning (regression learning models) to classify KOA and healthy subjects with high performance.
From the state-of-art approaches, tailor made specifically for gait based KOA analysis, it can be concluded that certain gaps exist that open up the scope of further research and investigations required for future work in this direction. Challenges such as absence of publicly available KOA gait dataset, consideration of few severity levels and only medial knee compartment, self-occlusion etc., ignored in the previous studies have to be further deliberated upon. Finally, this article provides useful references to get in-depth insight of research towards KOA diagnosis via gait analysis.
References
Gupta D, Sundaram S, Khanna A, Hassanien AE, de Albuquerque VHC (2018) Improved diagnosis of Parkinson’s disease based on optimized Crow Search Algorithm. Comput Electr Eng 68:412–424. https://doi.org/10.1016/j.compeleceng.2018.04.014
Wang Y, Wang A-N, Ai Q, Sun H-J (2017) An adaptive kernel-based weighted extreme learning machine approach for effective detection of Parkinson’s disease. Biomed Signal Process Control 38:400–410. https://doi.org/10.1016/j.bspc.2017.06.015
Lahmiri S (2017) Parkinson’s disease detection based on dysphonia measurements. Phys A 471:98–105. https://doi.org/10.1016/j.physa.2016.12.009
Nilashi M, Ibrahim O, Ahmadi H, Shahmoradi L, Farahmand M (2018) A hybrid intelligent system for the prediction of Parkinson’s Disease progression using machine learning techniques. Biocybern Biomed Eng 38(1):1–15. https://doi.org/10.1016/j.bbe.2017.09.002
Srivastava A, Goyal V, Sood SK, Sharma R (2018) Reduced saccadic velocity and pupillary width in young onset Parkinson’s disease. Neurol Psychiatry Brain Res 37:17–20. https://doi.org/10.1016/j.npbr.2017.12.005
Kale A et al (2004) Identification of humans using gait. IEEE Trans Image Process 13(9):1163–1173. https://doi.org/10.1109/TIP.2004.832865
Wang L, Tan T, Ning H, Hu W (2003) Silhouette analysisbased gait recognition for human identification. IEEE Trans Pattern Anal Mach Intell 25(12):1505–1518. https://doi.org/10.1109/TPAMI.2003.1251144
Gornale SS, Patravali PU, Manza RR (2016) A survey on exploration and classification of osteoarthritis using image processing techniques. Int J Sci Eng Res 7(6):334–356
Stamford JA, Schmidt PN, Friedl KE (2015) What engineering technology could do for quality of life in parkinson’s disease: a review of current needs and opportunities. IEEE J Biomed Health Inform 19(6):1862–1872. https://doi.org/10.1109/JBHI.2015.2464354
Kotti M, Duffell LD, Faisal AA, McGregor AH (2017) Detecting knee osteoarthritis and its discriminating parameters using random forests. Med Eng Phys 43:19–29. https://doi.org/10.1016/j.medengphy.2017.02.004
Debi R et al (2009) Differences in gait patterns, pain, function and quality of life between males and females with knee osteoarthritis: a clinical trial. BMC Musculoskelet Disord 10(1):127. https://doi.org/10.1186/1471-2474-10-127
Tarnita D, Catana M, Tarnita DN (2013) Experimental measurement of flexion-extension movement in normal and osteoarthritic human knee. Rom J Morphol Embryol 54(2):309–313
Favre J, Erhart-Hledik JC, Andriacchi TP (2014) Age-related differences in sagittal-plane knee function at heel-strike of walking are increased in osteoarthritic patients. Osteoarthr Cartil 22(3):464–471. https://doi.org/10.1016/j.joca.2013.12.014
Creaby MW, Bennell KL, Hunt MA (2012) Gait differs between unilateral and bilateral knee osteoarthritis. Arch Phys Med Rehabil 93(5):822–827. https://doi.org/10.1016/j.apmr.2011.11.029
Kobsar D, Osis ST, Boyd JE, Hettinga BA, Ferber R (2017) Wearable sensors to predict improvement following an exercise intervention in patients with knee osteoarthritis. J Neuroeng Rehabil 14(1):94. https://doi.org/10.1186/s12984-017-0309-z
Rutherford DJ, Baker M (2018) Knee moment outcomes using inverse dynamics and the cross product function in moderate knee osteoarthritis gait: a comparison study. J Biomech 78:150–154. https://doi.org/10.1016/j.jbiomech.2018.07.021
Spasojevic S et al (2015) A vision-based system for movement analysis in medical applications: the example of parkinson disease. In: 10th international conference on computer vision systems, Denmark, pp 424–434, Jul 2015. https://doi.org/10.1007/978-3-319-20904-3_38
Armand S, Decoulon G, Bonnefoy-Mazure A (2016) Gait analysis in children with cerebral palsy. Effort Open Rev 1(12):448–460. https://doi.org/10.1302/2058-5241.1.000052
Sanders RD, Gillig PM (2010) Gait and its assessment in psychiatry. Psychiatry Neurol 7(7):38–43. https://doi.org/10.1017/CBO9781139192309.004
Pirker W, Katzenschlager R (2017) Gait disorders in adults and the elderly. Wien Klin Wochensch 129(3–4):81–95. https://doi.org/10.1007/s00508-016-1096-4
da Silva-Hamu TCD et al (2013) The impact of obesity in the kinematic parameters of gait in young women. Int J Gen Med 6:507–513. https://doi.org/10.2147/IJGM.S44768
Roser M, Ritchie H (2018) Burden of disease (online). https://ourworldindata.org/burden-of-disease. Accessed 28 Oct 2018
Woolf AD (2015) Global burden of osteoarthritis and musculoskeletal diseases. BMC Musculoskelet Disord 16(1):S3. https://doi.org/10.1186/1471-2474-16-S1-S3
World Health Organization (2018) Musculoskeletal conditions: Feb 2018 (online). https://www.who.int/mediacentre/factsheets/musculoskeletal/en/. Accessed 12 Sep 2018
Hoy D et al (2014) The global burden of low back pain: estimates from the Global Burden of Disease 2010 study. Ann Rheum Disord 73(6):968–974. https://doi.org/10.1136/annrheumdis-2013-204428
Storheim K, Zwart J-A (2014) Musculoskeletal disorders and the Global Burden of Disease study. Ann Rheum Disord 73(6):949–950. https://doi.org/10.1136/annrheumdis-2014-205327
Lancet T (2016) Global, regional, and national incidence, prevalence, and years lived with disability for 310 diseases and injuries, 1990–2015: a systematic analysis for the Global Burden of Disease Study 2015. Global Health Metr 388:1545–1602. https://doi.org/10.1016/S0140-6736(16)31678-6
Cross M et al (2014) The global burden of hip and knee osteoarthritis: estimates from the Global Burden of Disease 2010 study. Ann Rheum Disord 73(7):1323–1330. https://doi.org/10.1136/annrheumdis-2013-204763
Kaufman KR, Hughes C, Morrey BF, Morrey M, An KN (2001) Gait characteristics of patients with knee osteoarthritis. J Biomech 34(7):907–915. https://doi.org/10.1016/S0021-9290(01)00036-7
Vos T et al (2012) Years lived with disability (YLDs) for 1160 sequelae of 289 diseases and injuries 1990-2010: a systematic analysis for the Global Burden of Disease Study 2010. Lancet 380:2163–2196. https://doi.org/10.1016/S0140-6736(12)61729-2
Ishikawa Y et al (2017) Gait analysis of patients with knee osteoarthritis by using elevation angle: confirmation of the planar law and analysis of angular difference in the approximate plane. Adv Robot 31(1–2):68–79. https://doi.org/10.1080/01691864.2016.1229217
Cui X, Zhao Z, Ma C, Chen F, Liao H (2018) A Gait character analyzing system for osteoarthritis pre-diagnosis using RGB-D camera and supervised classifier. In: World congress on medical physics and biomedical engineering, IFMBE proceedings, 2018, pp 297–301. https://doi.org/10.1007/978-981-10-9035-6_53
Gait analysis to detect Alzheimer’s disease: May 14, 2018 (online). https://www.dr-hempel-network.com/digital-health-technolg y/gait-analysis-to-detect-alzheimers-disease%E2%80%8B/
Levinger P et al (2007) The application of multiclass SVM to the detection of knee pathologies using kinetic data: a preliminary study. In: 3rd International conference on intelligent sensors, sensor networks and information, Australia, pp. 589–594. https://doi.org/10.1109/issNIP.2007.4496909
Asay JL, Boyer KA, Andriacchi TP (2013) Repeatability of gait analysis for measuring knee osteoarthritis pain in patients with severe chronic pain. J Orthop Res 31(7):1007–1012. https://doi.org/10.1002/jor.22228
Metcalfe AJ et al (2013) The effect of osteoarthritis of the knee on the biomechanics of other joints in the lower limbs. Bone Joint J 95(3):348–353. https://doi.org/10.1302/0301-620X.95B3.30850
Verlekar TT, Soares LD, Correia PL (2018) Automatic classification of gait impairments using a markerless 2D video-based system. Sensors 18(9):2743. https://doi.org/10.3390/s18092743
Astephen Wilson JL, Deluzio KJ, Dunbar MJ, Caldwell GE, Hubley-Kozey CL (2011) The association between knee joint biomechanics and neuromuscular control and moderate knee osteoarthritis radiographic and pain severity. Osteoarthr Cartil 19(2):186–193. https://doi.org/10.1016/j.joca.2010.10.020
Astephen JL, Deluzio KJ (2005) Changes in frontal plane dynamics and the loading response phase of the gait cycle are characteristic of severe knee osteoarthritis application of a multidimensional analysis technique. Clin Biomech 20(2):209–217. https://doi.org/10.1016/j.clinbiomech.2004.09.007
Farrokhi S, O’Connell M, Gil AB, Sparto PJ, Kelley Fitzgerald G (2015) Altered gait characteristics in individuals with knee osteoarthritis and self-reported knee instability. J Orthop Sports Phys Ther 45(5):351–359. https://doi.org/10.2519/jospt.2015.5540
Phinyomark A, Osis ST, Hettinga BA, Kobsar D, Ferber R (2016) Gender differences in gait kinematics for patients with knee osteoarthritis. BMC Musculoskelet Disord 17:157. https://doi.org/10.1186/s12891-016-1013-z
Brunton LR et al (2012) Inertial sensor based gait analysis: a clinical application in patients with osteoarthritis. Osteoarthr Cartil 20(1):S107. https://doi.org/10.1016/j.joca.2012.02.121
Hubley-Kozey CL, Astephen Wilson JL, Costello KE, Stanish WD (2015) Biomechanical and neuromuscular alterations in knee osteoarthritis and asymptomatic controls: a longitudinal study. Osteoarthr Cartil 23(2):A99–A100. https://doi.org/10.1016/j.joca.2015.02.810
Elbaz A et al (2014) Novel classification of knee osteoarthritis severity based on spatiotemporal gait analysis. Osteoarthr Cartil 22(3):457–463. https://doi.org/10.1016/j.joca.2013.12.015
Sims EL et al (2009) Sex differences in biomechanics associated with knee osteoarthritis. J Women Aging 21(3):159–170. https://doi.org/10.1080/08952840903054856
Deluzio KJ, Astephen JL (2007) Biomechanical features of gait waveform data associated with knee osteoarthritis: an application of principal component analysis. Gait Posture 25(1):86–93. https://doi.org/10.1016/j.gaitpost.2006.01.007
Mahmoudian A et al (2017) Changes in gait characteristics of women with early and established medial knee osteoarthritis: results from a 2-years longitudinal study. Clin Biomech 50:32–39. https://doi.org/10.1016/j.clinbiomech.2017.10.004
Munoz-Organero M et al (2017) Identification of walking strategies of people with osteoarthritis of the knee using insole pressure sensors. IEEE Sens J 17(12):3909–3920. https://doi.org/10.1109/JSEN.2017.2696303
Prakesh C, Kumar R, Mittal N (2018) Recent developments in human gait research: parameters, approaches, applications, machine learning techniques and challenges. Artif Intell Rev 49(1):1–40. https://doi.org/10.1007/s10462-016-9514-6
Tao W, Liu T, Zheng R, Feng H (2012) Gait analysis using wearable sensors. Sensors 12(2):2255–2283. https://doi.org/10.3390/s120202255
Muro-de-la-Herran A, Garcia-Zapirain B, Mendez-Zorrilla A (2014) Gait analysis methods: an overview of wearable and non-wearable systems, highlighting clinical applications. Sensors 14(2):3362–3394. https://doi.org/10.3390/s140203362
Ali A, Sundaraj K, Ahmad B, Ahamed N, Islam A (2012) Gait disorder rehabilitation using vision and non vision based sensors: a systematic review. Bosn J Basic Med Sci 12(3):193–202. https://doi.org/10.17305/bjbms.2012.2484
Gait analysis (2018) (online). https://en.wikipedia.org/wiki/Gait_analysis. Accessed 20 Oct 2018
Kharb A, Saini V (2011) YK Jain and Surender Dhiman (2011) A review of gait cycle and its patameters. Int J Comput Eng Manag 13:78–83
Perry J, Burnfield J (2010) Gait analysis normal and pathological function. Slack Incorporated, Thorofare
Understanding normal and pathological Gait (2018) (online). http://www.orthosurgery.gr/parousiasis/basic_science/7.pdf. Accessed 8 Nov 2018
Baker R (2007) The history of gait analysis before the advent of modern computers. Gait Posture 26(3):331–342. https://doi.org/10.1016/j.gaitpost.2006.10.014
Clinical Gait analysis (2018) (online). http://www.clinicalgaitanalysis.com/. Accessed 4 Oct 2018
On the Motion of Animals. Accessed: Oct 3, 2018 (online). https://galileo.ou.edu/exhibits/motion-animals-1680-81
Weber W, Weber EF. Mechanik Der Menschlichen Gehwerkzeuge. Göttingen, Germany: Dieterich, 1836 (online). https://catalog.hathitrust.org/Record/008593866
Muybridge E (1958) The human figure in motion. Coll Art J 11(3):336–337
Marey E (1874) Animal mechanism: a treatise on terrestrial and aerial locomotion. Henry S. King & Co., London
Braune W, Fischer O (1988) Determination of the moments of inertia of the human body and its limbs. Springer, Berlin
Connor P, Ross A (2018) Biometric recognition by gait: a survey of modalities and features. Comput Vis Image Underst 167:1–27. https://doi.org/10.1016/j.cviu.2018.01.007
Inman VT, Ralston H, Todd F (1981) Human walking. Williams & Wilkins, London
Eberhart H, Inman V (1947) Fundamental studies of human locomotion and other information relating to design of artificial limbs. Rep Nat Res Council, University of California, Berkeley, CA, Technical Report 1
Murray MP, Drought AB, Kory RC (1964) Walking patterns of normal men. J Bone Joint Surg 46(2):335–360
Middlesworth M (2018) The Definition and caused of Musculoskeletal disorders (MSDs): May 15 (online). https://ergo-plus.com/musculoskeletal-disorders-msd/. Accessed 30 Nov 2018
Woolf AD, Pfleger B (2003) Burden of major musculoskeletal conditions. Bull World Health Organ 81(9):646–656. https://doi.org/10.1590/S0042-96862003000900007
Arthritis Care (2018) Understanding Arthritis (online). https://arthritiscare.org.uk/assets/000/001/429/Understanding_FINAL_100516_web_original.pdf?1463670233. Accessed 29 Nov 2018
Lancet T (2017) Global, regional, and national incidence, prevalence, and years lived with disability for 328 diseases and injuries for 195 countries, 1990–2016: a systematic analysis for the Global Burden of Disease Study 2016. Global Health Metr 390:1211–1259. https://doi.org/10.1016/S0140-6736(17)32154-2
Apostolos Kontzias, Osteoarthritis (OA): July, 2017. (online). https://www.msdmanuals.com/home/bone,-joint,-and-muscle-disorders/joint-disorders/osteoarthritis-oa. Accessed 16 Sep2018
Arthritis: Jan 7, 2019 (online). https://www.encyclopedia.com/medicine/diseases-and-conditions/pathology/arthritis. Accessed 8 Jan 2019
Turkiewicz A et al (2014) Current and future impact of osteoarthritis on health care: a population-based study with projections to year 2032. Osteoarthr Cartil 22(11):1826–1832. https://doi.org/10.1016/j.joca.2014.07.015
SE Gabriel and KMichaud (2009) Epidemiological studies in incidence, prevalence, mortality, and comorbidity of the rheumatic diseases. Arthritis Res Ther 11(3):229. https://doi.org/10.1186/ar2669
Liikavainio T (2010) Biomechanics of gait and physical function in patients with knee osteoarthritis thigh muscle properties and joint loading assessment. Ph.D. dissertation, Dept Physics and Mathematics, Eastern Finland Univ (13), Kuopio 2010
Vincent TL, Watt FE (2018) Osteoarthritis. Medicine 46(3):187–195
Osteoarthritis of the Knee: Dec 13, 2018 (online). https://www.dovemed.com/diseases-conditions/osteoarthritis-of-the-knee/
Dr Mary Lowth, Patient: Aug 12, 2014 (online). patient.info/doctor/abnormal-gait. Accessed 25 Oct 2018
Kohn MD, Sassoon AA, Fernando ND (2016) Classifications in brief: Kellgren–Lawrence classification of osteoarthritis. Clin Orthop Relat Res 474(8):1886–1893. https://doi.org/10.1007/s11999-016-4732-4
Sutherland DH (2001) The evolution of clinical gait analysis part l: kinesiological EMG. Gait Posture 14(1):61–70. https://doi.org/10.1016/S0966-6362(01)00100-X
Sutherland DH (2002) The evolution of clinical gait analysis Part II: kinematics. Gait Posture 16(2):159–179. https://doi.org/10.1016/S0966-6362(02)00004-8
Culhane KM, O’Connor M, Lyons D, Lyons GM (2005) Accelerometers in rehabilitation medicine for older adults. Age Ageing 34(6):556–560. https://doi.org/10.1093/ageing/afi192
Motion Capture (online). https://en.wikipedia.org/wiki/Motion_capture. Accessed 10 Nov 2018
Motion Capture (online). https://www.revolvy.com/page/Motion-capture. Accessed 18 Nov 2018
Collins AT et al (2011) 180 Knee Kinematics and kinetics of gait are altered by stochastic resonance stimulation and knee sleeve in knee Osteoarthritis. Osteoarthr Cartil 19:S90. https://doi.org/10.1016/S1063-4584(11)60207-0
Liikavainio T, Bragge T, Hakkarainen M, Karjalainen PA, Arokoski JP (2010) Gait and muscle activation changes in men with knee osteoarthritis. Knee 17(1):69–76. https://doi.org/10.1016/j.knee.2009.05.003
Moustakidis SP, Theocharis JB, Giakas G (2010) A fuzzy decision tree-based SVM classifier for assessing osteoarthritis severity using ground reaction force measurements. Med Eng Phys 32(10):1145–1160. https://doi.org/10.1016/j.medengphy.2010.08.006
Mezghani N et al (2008) Automatic classification of asymptomatic and osteoarthritis knee gait patterns using kinematic data features and the nearest neighbor classifier. IEEE Trans Biom Eng 55(3):1230–1232. https://doi.org/10.1109/TBME.2007.905388
Childs JD, Sparto PJ, Kelley Fitzgerald G, Bizzini M, Irrgang JJ (2004) Alterations in lower extremity movement and muscle activation patterns in individuals with knee osteoarthritis. Clin Biomech 19(1):44–49. https://doi.org/10.1016/j.clinbiomech.2003.08.007
Chen K-H, Chen P-C, Liu K-C, Chan C-T (2015) Wearable sensor-based rehabilitation exercise assessment for knee osteoarthritis. Sensors 15(2):4193–4211. https://doi.org/10.3390/s150204193
Tereso A, Martins MM, Santos CP (2015) Evaluation of gait performance of knee osteoarthritis patients after total knee arthroplasty with different assistive devices. Res Biomed Eng 31(3):208–217. https://doi.org/10.1590/2446-4740.0729
Atallah L et al (2014) Gait asymmetry detection in older adults using a light ear-worn sensor. Physiol Meas 35(5):29–40. https://doi.org/10.1088/0967-3334/35/5/N29
McCarthy I, Hodgins D, Mor A, Elbaz A, Segal G (2013) Analysis of knee flexion characteristics and how they alter with the onset of knee osteoarthritis: a case control study. BMC Musculoskelet Disord 14:169. https://doi.org/10.1186/1471-2474-14-169
Bolink S, van Laarhoven SN, Lipperts M, Heyligers IC, Grimm B (2012) Inertial sensor motion analysis of gait, sit–stand transfers and step-up transfers: differentiating knee patients from healthy controls. Physiol Meas 33(11):1947–1958. https://doi.org/10.1088/0967-3334/33/11/1947
Alkjaer T et al (2015) Gait variability and motor control in people with knee osteoarthritis. Gait Posture 42(4):479–484. https://doi.org/10.1016/j.gaitpost.2015.07.063
Hubley-Kozey C, Deluzio K, Dunbar M (2008) Muscle co-activation patterns during walking in those with severe knee osteoarthritis. Clin Biomech 23(1):71–80. https://doi.org/10.1016/j.clinbiomech.2007.08.019
Ling SM et al (2007) Electromyographic patterns suggest changes in motor unit physiology associated with early osteoarthritis of the knee. Osteoarthr Cartil 15(10):1134–1140. https://doi.org/10.1016/j.joca.2007.03.024
Arita H et al (2016) Patient-oriented outcome meadure for knee osteoarthritis is associated with gait analysis data obtained from the novel downsized motion capture technology in patients with the end-stage knee osteoarthritis. Osteoarthr Cartil 24(1):S127. https://doi.org/10.1016/j.joca.2016.01.249
Bergmann JHM et al (2013) An attachable clothing sensor system for measuring knee joint angles. IEEE Sens J 13(10):4090–4097. https://doi.org/10.1109/jsen.2013.2277697
Kiss RM (2011) Effect of severity of knee osteoarthritis on the variability of gait parameters. J Electromyogr Kinesiol 21(5):695–703. https://doi.org/10.1016/j.jelekin.2011.07.011
Metcalfe AJ et al (2017) Abnormal loading and functional deficits are present in both limbs before and after unilateral knee arthroplasty. Gait Posture 55:109–115. https://doi.org/10.1016/j.gaitpost.2017.04.008
Sun J et al (2017) Clinical gait evaluation of patients with knee osteoarthritis. Gait Posture 58:319–324. https://doi.org/10.1016/j.gaitpost.2017.08.009
Matsumoto H et al (2015) Diagnosis of knee osteoarthritis and gait variability increases risk of falling for osteoporotic older adults: the GAINA study. Osteoporosis Sarcopenia 1(1):46–52. https://doi.org/10.1016/j.afos.2015.07.003
Henriksen M, Aaboe J, Bliddal H (2012) The relationship between pain and dynamic knee joint loading in knee osteoarthritis varies with radiographic disease severity: a cross sectional study. Knee 19(4):392–398. https://doi.org/10.1016/j.knee.2011.07.003
Koktas NS, Yalabik N, Yavuzer G, Duin RPW (2010) A multi-classifier for grading knee osteroarthritis using gait analysis. Pattern Recogn Lett 31(9):898–904. https://doi.org/10.1016/j.patrec.2010.01.003
Koktas NS, Yalabik N, Yavuzer G (2006) Ensemble classifiers for medical diagnosis of knee osteoarthritis using gait data. In: 5th international conference on machine learning and applications, IEEE, USA. https://doi.org/10.1109/icmla.2006.22
Surer E, Kose A (2011) Methods and technologies for gait analysis. Computer Analysis of Human Behavior, Springer, New York, Ch. 5. https://doi.org/10.1007/978-0-85729-994-9_5
Middleton L, Buss AA, Bazin AI, Nixon MS (2005) A floor sensor system for gait recognition. In: Fourth IEEE workshop on automatic identification advanced technologies (AutoID’05), USA, pp 171–176. https://doi.org/10.1109/autoid.2005.2
Md Akhtaruzzaman A, Shafie A, Raisuudin Khan M (2016) Gait analysis: systems, technologies, and importance. J Mech Med Biol 16(7):1630003. https://doi.org/10.1142/s0219519416300039
Ko S-U, Ling SM, Schreiber C, Nesbitt M, Ferrucci L (2010) Gait patterns during different walking conditions in older adults with and without knee osteoarthritis—results from the Baltimore longitudinal study of aging. Gait Posture 33(2):205–210. https://doi.org/10.1016/j.gaitpost.2010.11.006
Henriksen M, Graven-Nielsen T, Aaboe J, Andriacchi TP, Bliddal H (2010) Gait changes in patients with knee osteoarthritis are replicated by experimental knee pain. Arthr Care Res 62(4):501–509. https://doi.org/10.1002/acr.20033
Bejek Z, Paroczai R, Illyes A, Kiss RM (2006) The influence of walking speed on gait parameters in healthy people and in patients with osteoarthritis. Knee Surg Sports Traumatol Arthrosc 14(7):612–622. https://doi.org/10.1007/s00167-005-0005-6
Serkan TAS et al (2014) Effects of severity of osteoarthritis on the temporospatial gait parameters in patients with knee osteoarthritis. Acta Orthop Traumatol Turc 48(6):635–641. https://doi.org/10.3944/AOTT.2014.13.0071
Rutherford D, Baker M, Wong I, Stanish W (2017) The effect of age and knee osteoarthritis on muscle activation patterns and knee joint biomechanics during dual belt treadmill gait. J Electromyogr Kinesiol 34:58–64. https://doi.org/10.1016/j.jelekin.2017.04.001
Chehab EF, Favre J, Erhart-Hledik JC, Andriacchi TP (2014) Baseline knee adduction and flexion moments during walking are both associated with 5 year cartilage changes in patients with medial knee osteoarthritis. Osteoarthr Cartil 22(11):1833–1839. https://doi.org/10.1016/j.joca.2014.08.009
Calder KM et al (2014) Knee power is an important parameter in understanding medial knee joint load in knee osteoarthritis. Arthritis Care Res 66(5):687–694. https://doi.org/10.1002/acr.22223
Meyera AJ et al (2013) Are external knee load and EMG measures accurate indicators of internal knee contact forces during gait? J Orthop Res 31(6):921–929. https://doi.org/10.1002/jor.22304
O’Connell M, Farrokhi S, Gil AB, Fitzgerald GK (2013) Severity of coexisting patellofemoral osteoarthritis is associated with altered sagittal-plane gait biomechanics in patients with tibiofemoral osteoarthritis. Osteoarthr Cartil 21:S87. https://doi.org/10.1016/j.joca.2013.02.187
Zeni JA Jr, Higginson JS (2009) Differences in gait parameters between healthy subjects and persons with moderate and severe knee osteoarthritis: a result of altered walking speed? Clin Biomech 24(4):372–378. https://doi.org/10.1016/j.clinbiomech.2009.02.001
Walker CRC, Myles C, Nutton R, Rowe P (2001) Movement of the knee in osteoarthritis: the use of electrogonimetry to assess function. Bone Joint J 83(2):195–198
Hurwitz DE et al (2000) Knee pain and joint loading in subjects with osteoarthritis of the knee. J Orthop Res 18(4):572–579. https://doi.org/10.1002/jor.1100180409
Monil K, Milad M, Lynsey D, Margarita K, Alison M (2018) Comparison of gait biomechanics in patients with and without knee osteoarthritis during different phases of gait. J Orthop Trauma Rehabil 25:11–15. https://doi.org/10.1016/j.jotr.2017.09.005
Na A, Piva SR, Buchanan TS (2018) Influences of knee osteoarthritis and walking difficulty on knee kinematics and kinetics. Gait Posture 61:439–444. https://doi.org/10.1016/j.gaitpost.2018.01.025
Paterson KL et al (2017) The influence of sex and obesity on gait biomechanics in people with severe knee osteoarthritis scheduled for arthroplasty. Clin Biomech 49:72–77. https://doi.org/10.1016/j.clinbiomech.2017.08.013
Preece SJ, Jones RK, Brown CA, Cacciatore TW, Jones Anthony K P (2016) Reductions in co-contraction following neuromuscular re-education in people with knee osteoarthritis. BMC Musculoskelet Disord 17:372. https://doi.org/10.1186/s12891-016-1209-2
Chang AH et al (2015) External knee adduction and flexion moments during gait and medial tibiofemoral disease progression in knee osteoarthritis. Osteoarthr Cartil 23(7):1099–1106. https://doi.org/10.1016/j.joca.2015.02.005
Duffell LD, Southgate DFL, Gulati V, McGregor AH (2014) Balance and gait adaptations in patients with early knee osteoarthritis. Gait Posture 39(4):1057–1061. https://doi.org/10.1016/j.gaitpost.2014.01.005
Farrokhi S et al (2013) Severity of coexisting patellofemoral disease is associated with increased impairments and functional limitations in patients with knee osteoarthritis. Arthr Care Res 65(4):544–551. https://doi.org/10.1002/acr.21866
Simic M, Wrigley TV, Hinman RS, Hunt MA, Bennel KL (2013) Altering foot progression angle in people with medial knee osteoarthritis: the effects of varying toe-in and toe-out angles are mediated by pain and malalignment. Osteoarthr Cartil 21(9):1272–1280. https://doi.org/10.1016/j.joca.2013.06.001
Hubley-Kozey CL, Robbins SM, Rutherford DJ, Stanish WD (2013) Reliability of surface electromyographic recordings during walking in individuals with knee osteoarthritis. J Electromyogr Kinesiol 23(2):334–341. https://doi.org/10.1016/j.jelekin.2012.12.002
Kumar D, Rudolph KS, Manal KT (2012) An EMG-driven modeling approach to muscle force and joint load estimations: case study in knee osteoarthritis. J Orthop Res 30(3):377–383. https://doi.org/10.1002/jor.21544
Esquenazi A, Talaty M (2015) Gait analysis: technology and clinical applications. Phys Med Rehabil 2015, Ch. 5
Falconer J, Hayes KW (1991) A simple method to measure gait for use in arthritis clinical research. Arthritis Care Res 4(1):52–57. https://doi.org/10.1002/art.1790040110
Sacco ICN et al (2012) Joint loading decreased by inexpensive and minimalist footwear in elderly women with knee osteoarthritis during stair descent. Arthritis Care Res 64(3):368–374. https://doi.org/10.1002/acr.20690
Stephanie (2014) Statistics how to: Jan 20, 2014 (online). https://www.statisticshowto.datasciencecentral.com/parametric-and-non-parametric-data/. Accessed 23 Nov 2018
Astephen JL, Deluzio KJ, Caldwell GE, Dunbar MJ (2012) Biomechanical changes at the hip, knee, and ankle joints during gait are associated with knee osteoarthritis severity. J Orthop Res 26(3):377–383. https://doi.org/10.1002/jor.20496
Hall M et al (2017) The knee adduction moment and knee osteoarthritis symptoms: relationships according to radiographic disease severity. Osteoarthr Cartil 25(1):34–41. https://doi.org/10.1016/j.joca.2016.08.014
Paterson KL, Hinman RS, Metcalf BR, Bennell KL, Wrigley TV (2017) Plug-in-Gait calculation of the knee adduction moment in people with knee osteoarthritis during shod walking: comparison of two different foot marker models. J Foot Ankle Res 10(1):8. https://doi.org/10.1186/s13047-017-0187-4
Rutherford D, Baker M, Wong I, Stanish W (2017) The effect of age and knee osteoarthritis on muscle activation patterns and knee joint biomechanics during dual belt treadmill gait. J Electromyogr Kinesiol 34:58–64. https://doi.org/10.1016/j.jelekin.2017.04.001
Khandha A et al (2017) Gait mechanics in those with/without medial compartment knee osteoarthritis 5 years after anterior cruciate ligament reconstruction. J Orthop Res 35(3):625–633. https://doi.org/10.1002/jor.23261
MacLean KFE, Callaghan JP, Maly MR (2016) Effect of obesity on knee joint biomechanics during gait in young adults. Cogent Med 3(1):1173778. https://doi.org/10.1080/2331205X.2016.1173778
Karatsidis A et al (2017) Estimation of ground reaction forces and moments during gait using only inertial motion capture. Sensors 17(1):75. https://doi.org/10.3390/s17010075
Sparling TL et al (2014) Energy recovery in individuals with knee osteoarthritis. Osteoarthr Cartil 22(6):747–755. https://doi.org/10.1016/j.joca.2014.04.004
Author information
Authors and Affiliations
Corresponding author
Ethics declarations
Conflict of interest
The author’s declare that they have no conflict of interest.
Additional information
Publisher's Note
Springer Nature remains neutral with regard to jurisdictional claims in published maps and institutional affiliations.
Appendix
Appendix
The URLs for the images taken from the internet and used in this article are provided below.
Figure 5: http://www.clinicalgaitanalysis.com/https://en.wikipedia.org/wiki/Aristotlehttps://www.leonardodavinci.net/https://www.onthisday.com/people/girolamo-cardanohttps://www.historyonthenet.com/galileo-galilei/https://www.biography.com/people/ren-descartes-37613https://commons.wikimedia.org/wiki/File:Portrait_of_Giovanni_Alfonso_Borelli_Wellcome_L0010325.jpghttps://thomaspjohnston.wordpress.com/category/postage-stamps/page/2/https://www.thefamouspeople.com/profiles/hermann-von-helmholtz-4828.phphttps://en.wikipedia.org/wiki/Eadweard_Muybridgehttps://sheridanphothistory.wordpress.com/page/2/https://me.queensu.ca/People/Deluzio/JAM/files/Baker.pdfhttps://me.queensu.ca/People/Deluzio/JAM/files/Baker.pdfhttps://ouhsc.edu/bserdac/dthompso/web/gait/knmatics/saunders.htmhttps://www.nap.edu/read/4779/chapter/14http://www.clinicalgaitanalysis.com/history/modern.htmlhttps://www.legacy.com/obituaries/sfgate/obituary.aspx?n=david-h-sutherland&pid=17877856https://ptceu.wordpress.com/2013/05/01/in-celebration-of-my-friend-and-mentor-dr-jacquelin-perry/.
Figure 7: https://www.dovemed.com/diseases-conditions/osteoarthritis-of-the-knee/ Figure 8: https://me.queensu.ca/People/Deluzio/JAM/files/Baker.pdfhttps://www.nap.edu/read/4779/chapter/14https://ouhsc.edu/bserdac/dthompso/web/gait/knmatics/saunders.htmhttps://en.wikipedia.org/wiki/Robert_H._Goddardhttp://www.oemupdate.com/feature/kistler-group-acquires-ios-gmbh/http://www.clinicalgaitanalysis.com/history/modern.htmlhttps://www.digitalcommonwealth.org/search/commonwealth-oai:73666c049https://ar-conf.ru/en/news/pochuvstvuyte-virtualnie-obyatya-tesla-suit-na-ar-conference-30543https://news.creativecow.net/company.php?folder=Viconhttps://www.mediaproductionshow.com/exhibitors/ikegami/https://www.dualshockers.com/microsoft-discontinuing-original-kinect-models-for-windows-pc-in-2015/https://www.telegraph.co.uk/education/universityeducation/8742154/Top-UK-universities-in-world-rankings.htmlhttp://physics.kenyon.edu/EarlyApparatus/Static_Electricity/Geissler_Tubes/Geissler_Tubes.htmlhttps://www.mdpi.com/1424-8220/14/2/3362/htmlhttps://www.researchgate.net/publication/301935875_Human_Gait_and_Clinical_Movement_Analysishttp://dynamolab.umed.pl/?page_id=34&lang=enhttps://www.amazon.co.uk/Tobar-01544-Gyroscope-Silver-10cm/dp/B000H6W52Shttps://www.sparkfun.com/products/retired/692https://www.amti.biz/fps-guide.aspxhttp://www.bleng.com/traditional-reflective-markershttps://www.uline.ca/Product/Detail/S-17177/Vinyl-Safety-Reflective-Tapes/Reflective-Tape-3-x-10-yds Red http://www.taheeltech.com/product/goniometers/http://www.phasespace.com/suits.htmlhttps://vizworld.com/2012/08/vicon-showcase-motion-capture-products-siggraph2012/https://www.amazon.in/Camcorders-Camcorder-Digital-External-Microphone/dp/B076DXMXMRhttps://www.dhgate.com/product/2017-anti-blue-light-screen-protector-for/402728044.htmlhttps://www.generationrobots.com/en/401430-microsoft-kinect-sensor.htmlhttps://www.microsoft.com/en-us/research/project/kinect-for-windows-sdk-beta/https://www.ordineinfermieribologna.it/2016/il-futuro-con-gli-wearable-ecco-la-maglietta-che-rileva-il-ritmo-cardiaco-e-lo-trasmette.html.
Figure 37: https://www.shutterstock.com/imagevector/vector-flat-cartoon-lens-photo-camera-777796435.
Rights and permissions
About this article

Cite this article
Kour, N., Gupta, S. & Arora, S. A Survey of Knee Osteoarthritis Assessment Based on Gait. Arch Computat Methods Eng 28, 345–385 (2021). https://doi.org/10.1007/s11831-019-09379-z
Received:
Accepted:
Published:
Issue Date:
DOI: https://doi.org/10.1007/s11831-019-09379-z