
Abstract
Giga-grade martensitic advanced high-strength steels are prone to sub-critical heat-affected zone (SCHAZ) softening during resistance spot welding. The article aims at understanding the role of HAZ softening on the fracture mode, load-bearing capacity, and energy absorption capability of MS1400 resistance spot welds during the cross-tension test. The highest load-bearing capacity was obtained when pullout failure was initiated from the martensitic coarse-grained HAZ. However, more severe HAZ softening and formation of a wider softened zone, promoted at high heat input conditions, encourages strain localization in SCHAZ, promoting transition in failure location to sub-critical HAZ. This change in pullout failure location is responsible for the observed reduction in the weld peak load at high welding currents. Therefore, control of martensite tempering in the HAZ is critical to obtain strong and reliable resistance spot welds in martensitic advanced high-strength steel sheets. To preclude the detrimental effect of the martensite tempering on the weld strength, the minimum welding current, which enables pullout failure mode, should be used for resistance spot welding of MS1400 advanced martensitic steel.
1 Introduction
Advanced high-strength steels (AHSSs) are key materials to address the need for light-weighting in the automotive industry. The use of AHSS in the automotive body in white can simultaneously improve the energy consumption and crash safety of passenger cars.[1,2] The structural reinforcement components in the vehicle’s safety cage are composed of pillars, side sills, rockers, door reinforcement beams, roof rails, and floors and roof cross members. The structural reinforcement components in the vehicle’s safety cage composed of pillars, side sills, rockers, door reinforcement beams, roof rails, and floor and roof cross members require Giga-grade steels (i.e., steels with a tensile strength > 1 GPa). Therefore, extremely high strength steels, typically martensitic steels, and press hardening grades are among the most promising candidates for use in these components.[3,4]
Resistance spot welding (RSW) is the critical joining technology for vehicle manufacturing.[5] The weldability of AHSS causes metallurgical challenges in the automotive industry. The mechanical properties of advanced steels are controlled by microstructure-based thermomechanical processing routes.[6,7,8] However, the rapid heating and cooling during RSW can affect the strengthening/toughening mechanisms of the base metal.[9] The two important phase transformations in the resistance spot welds comprised of AHSS are as follows:
-
(1)
Martensite formation in the fusion zone and coarse-grain heat-affected zone due to the extremely high cooling rate of RSW and the high hardenability of the AHSS: The brittleness of the hard martensite can provide a preferred path for interfacial failure (i.e., weld nugget failure along the sheet/sheet interface) during some loading conditions (e.g., peel and cross-tension tests).[9,10,11,12,13,14,15,16]
-
(2)
Heat-affected zone (HAZ) softening due to martensite tempering in the sub-critical HAZ during welding of martensite-containing AHSS (e.g., dual-phase steels and martensitic steels)[16,17,18,19,20,21]: This softening can promote pullout failure mode, but it may affect the joint strength.
The factors affecting the degree of HAZ softening have been studied in previous works. The following points have been highlighted in the previous works:
-
(1)
Welding with high heat input encourages HAZ softening and increases the size of the softened zone.[22,23,24]
-
(2)
Martensite-containing sheets with greater thickness exhibited larger HAZ softening than the thinner sheets.[5]
-
(3)
The presence of carbide-forming elements (e.g., Cr and Mn) can enhance the resistance to martensite tempering during welding.[25]
-
(4)
The degree of HAZ softening depends on the initial volume fraction of martensite in the base metal. Increasing the initial volume fraction of martensite amplifies the HAZ softening phenomena. For example, it is shown that the average softening ratio, defined as the hardness ratio of the soft HAZ to the BM, in DP600, DP780, DP980, and MS1200 has been reported as 1 (i.e., no softening), 0.95, 0.85, and 0.58, respectively.[16,23] Therefore, it can be expected that the martensitic steels will experience more severe softening in the HAZ compared to the ferrite-martensite dual-phase steels.
The failure behavior and mechanical properties of the resistance spot welds largely depend on the complex interplay among the weld geometry, fusion zone/HAZ/base metal properties, test geometry, and stress state in each weld.[5,26,27] Other works have shown that the presence of HAZ softening can improve the interfacial to pullout fracture mode transition (i.e., achieving nugget pullout at smaller weld nugget size).[16,28] Despite this beneficial effect of HAZ softening, it is shown that it can decrease the load-bearing capacity of the resistance spot welds during the tensile-shear loading. For example, the tensile-shear peak load of the MS1400 (martensitic steel with the tensile strength of 1400 MPa) is reduced by 40 pct compared to the strength expected from the initial base metal microstructure.[29] However, there is no report on the influence of HAZ softening on the strength of the spot welds during the cross-tension test.
It is believed that the loading mode can influence the impact of the HAZ softening on the mechanical properties of the martensitic steels (e.g., tensile-shear loading vs. cross-tension loading). This is due to different failure mechanisms of the spot welds in various loading conditions.[5] It has been shown that the pullout failure mechanism during the tensile-shear loading is the necking of the weld circumferences.[30,31] It has been demonstrated that in the absence of the HAZ softening in steel spot welds, the pullout failure location is the soft BM compared to the hard HAZ.[5,16] Therefore, it is not surprising that HAZ softening can shift the failure location from the BM to the soft SCHAZ.[29] However, the pullout failure in cross-tension generally occurs in the martensitic coarse-grained HAZ.[31,32] Park et al.[10,15] and Chabok et al.[33] outlined that the brittle nature of martensite and low tensile toughness in CGHAZ play a crucial role in crack propagation and mechanical performance during opening loading condition.
Because the pullout failure during the cross-tension test is usually initiated from the martensitic coarse-grained HAZ, the question is whether the softening in the SCHAZ can affect the cross-tension strength of the spot welds. This article aims at addressing this question. The effect of HAZ softening in the martensitic MS1400 steel, which is highly prone to softening during welding, on the cross-tension mechanical properties of the spot welds is investigated and analyzed. This work shows that a pronounced HAZ softening can change the failure location from CGHAZ to SCHAZ, which is accompanied by a reduction in the load-bearing capacity of the spot welds.
2 Experimental
The welding experiments were conducted on uncoated martensitic AHSS sheets (Docol MS1400) with 1.5 mm thickness. Table I shows the chemical composition and tensile properties of MS1400. Resistance spot welds were fabricated using a 120 kVA AC pedestal type RSW machine controlled by a programmable logic controller at 50 Hz. A 45° truncated cone Class II (Cu-Cr) Resistance Welder Manufacturer’s Association (RWMA) electrode with an 8-mm face diameter was used. The electrodes were continuously cooled by water. The water temperature and the flow rate were 20 °C and 6 L/min, respectively. To study the effects of the welding schedules on the weld performance, the welding current was incrementally increased from 7 to 15 kA with a step size of 1 kA. Electrode force, welding time, and holding time were kept constant at 5.5 kN, 0.24, and 0.2 s, respectively, according to the base material’s thickness, strength, and AWS D8.9 Standard. According to previous works,[34,35], baking heat treatment after resistance spot welding can improve the mechanical properties of AHSS resistance spot welds. However, in this study, no post-weld baking was conducted after welding. Four samples were prepared for each welding condition, including one sample for the metallographic study, geometrical measurement and microhardness test and three samples for cross-tension test.
Samples for the metallographic examination were prepared using standard metallography procedures. Nital etching reagent (2 pct nitric acid and 98 pct methanol) was used to reveal the macro- and microstructures of the samples. The microstructure of various zones was observed via optical microscopy (OM) and scanning electron microscopy (SEM). Weld nugget (fusion zone) sizes and electrode indentation were measured for all the samples on the metallographic cross-sections of the welds. A Vickers microhardness measurement was performed using a Bohler microhardness tester with an indenter load of 200 g for 10 s to obtain diagonal profile hardness. According to ASTM E384, the center-to-center distance between micro-hardness indents was selected as > 2.5 times the micro-hardness diameter.
The steel sheets were cut into 150 × 50 mm2 coupons along the transverse direction to the cross-tension test based on the AWS D8.9 standard,[36] and subsequently resistance spot welds were implemented at the center of an overlapped area. The cross-tension tests were performed at a 10 mm min−1 crosshead speed with a universal testing machine in the ambient condition. The metallographic cross section of the failed samples was examined using OM.
3 Results
3.1 Weld Metallurgical Characteristics
Figures 1(a) and (b) illustrates the typical macrostructure and the corresponding microhardness profile of the MS1400 resistance spot weld. Three distinct microstructural zones are created during RSW:
-
(1)
fusion zone (FZ), where the material experiences melting and re-solidification during the welding cycle;
-
(2)
Heat-affected zone (HAZ), where material experiences solid-state phase transformation without melting. This region can be divided into three sub-regions including the upper critical heat-affected zone (UCHAZ), inter-critical heat-affected zone (ICHAZ), and sub-critical heat-affected zone (SCHAZ);
-
(3)
Un-affected base metal (BM).
Figure 2 shows the microstructure gradient in the weldment. The microstructure gradient in the weldment can be well correlated with the peak temperature and the cooling rate experienced by each zone during the welding process and the steel chemistry. The mechanisms of microstructural evolution during the RSW of MS1400 have been well detailed in a previous work.[29] Table II shows the summary of transformation pathways and the resultant microstructure in the fusion and heat-affected zones of MS1400 martensitic steel. The microstructure of the various zones is briefly described as follows:
-
(1)
BM microstructure: The MS1400 steel microstructure, as depicted in Figure 2(a), consisted of very fine packets of martensite lath; the corresponding hardness was about 400 HV.
-
(2)
SCHAZ microstructure: The SCHAZ exhibited a tempered martensite microstructure (Figure 2(b)).
-
(3)
ICHAZ microstructure: The ICHAZ exhibited a dual ferrite-martensite microstructure (Figure 2(c)). The martensitic BM partially transforms to ferrite and austenite during the heating part of the weld thermal cycle. The austenite transforms to martensite during cooling producing a ferrite-martensite microstructure in the ICHAZ.
-
(4)
UCHAZ microstructure: The UCHAZ can be further subdivided into a coarse-grained heat-affected zone (CGHAZ) and fine-grained heat-affected zone (FGHAZ). The microstructures of the CGHAZ and FGHAZ are illustrated in Figure 2(d and e), respectively. Both zones exhibited a martensitic structure, as they experienced full austenitization during heating and rapid cooling. However, the packet size of CGHAZ is significantly larger than that of the FGHAZ. The larger primary austenite grain size and larger packet size of the CGHAZ make this zone a potential failure location during cross-tension loading due to its reduced toughness.
-
(5)
FZ microstructure: The FZ (Figure 2(f)) is almost fully martensitic because of the rapid cooling of the RSW process.
Notably, the hardness of the FZ, UCHAZ, and BM is nearly the same. However, a pronounced softening was observed in the weld hardness profile (see Figure 1(b)). The softening observed in the HAZ is due to ferrite formation in the ICHAZ (Figure 2(c)) and martensite tempering in the SCHAZ (Figure 2(b)).

Typical (a) macrostructure and (b) the corresponding hardness profile of the MS1400 martensitic steel resistance spot welds

SEM micrographs showing the microstructure of (a) base metal (BM), (b) sub-critical heat affected zone (SCHAZ), (c) inter-critical heat affected zone (ICHAZ), (d) fine-grain upper-critical heat affected zone (FGUCHAZ), (e) coarse grain upper-critical heat affected zone (CGUCHAZ), and (f) fusion zone (FZ) in the MS1400 resistance spot welds
3.2 Effect of Welding Current on Weld Geometrical/Metallurgical/Hardness Characteristics
The mechanical properties of the spot welds are governed by weld geometrical factors (fusion zone size and the electrode indentation depth) and the metallurgical/hardness characteristics of the various zone in the weldment. The effect of the welding current on the weld geometrical/metallurgical/hardness characteristics is described as follows:
-
(1)
Effect of welding current on the weld geometrical factors Figure 3(a) schematically shows the definition of fusion zone size, weld penetration, and electrode indentation. Figure 3(b) shows the effect of welding current on the weld geometrical attributes. The observed trends for weld geometrical attributes versus welding current (Figure 3(b)) are predictable based on the Joule heating effect.[5]
Fig. 3 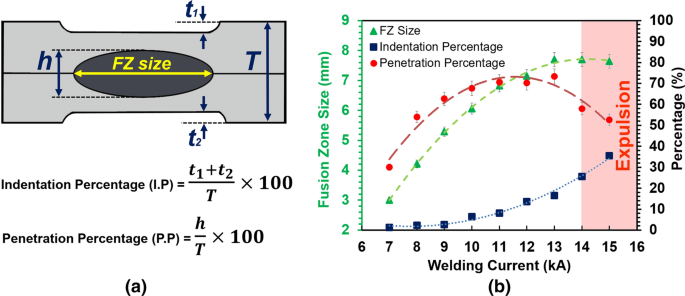
(a) Schematic of resistance spot weld cross-section: sheet thickness (T), fusion zone size (D), indentations depth in sheets (t1 and t2), penetration depth (h), indentation percent (IP), and penetration percent (PP). (b) Effect of welding current on the geometrical attributes of the MS1400 resistance spot welds. The error bars represent the standard deviation of the data
-
(2)
As the heat input (welding current) increases, the volume of the fusion zone expands horizontally along the sheet/sheet interface and vertically in the through-thickness direction. However, the growth of the welding nugget in the through-thickness direction (i.e., weld penetration) is limited by the increase in the electrode indentation depth into the sheet surfaces. Therefore, the maximum weld penetration was obtained at a welding current of 11 to 12 kA. The internal expulsion (i.e., the molten metal ejection from the sheet/sheet interface) occurred at the welding current of 14 and 15 kA.
-
(3)
Effect of welding current on the shape of the weld notch The presence of a natural notch at the sheet/sheet interface is a unique feature of the spot welds. The shape of the weld notch, sharp versus square, can affect the failure behavior of the spot welds. The high stress concentration associated with the sharp notches promotes interfacial failure mode during cross-tension loading.[5] Figure 4 illustrates the influence of welding current on the shape of the welds notch at the sheet/sheet interface. At a welding current of 15 kA, a rounded or square-shaped notch is created where expulsion occurred.
Fig. 4 
Effect of welding current on the shape of the weld notch at the sheet/sheet interface
-
(4)
Effect of the welding current on the size of the HAZ Figure 5 shows the effect of the welding current on the size of the UCHAZ, ICHAZ, SCHAZ, and the total size of the HAZ. The size of each sub-zone depends on the temperature range of the sub-zone, heat input, and heat transfer during welding. The size of ICHAZ is very small compared to the size of the other sub-zones in the HAZ due to its narrow corresponding temperature range (i.e., A3 to A1). It is of note that both ICHAZ and SCHAZ exhibited softening compared to the BM. However, due to the larger size of the SCHAZ compared to ICHAZ, martensite tempering in SCHAZ plays the critical role in HAZ softening of the MS1400 RSW, and it is expected that the SCHAZ plays a more important role in the mechanical properties of the MS1400 spot welds than the ICHAZ.
Fig. 5 
Effect of welding current on the size of the UCHAZ, ICHAZ, and SCHAZ and the total size of the HAZ. The error bars represent the standard deviation of the data
-
(5)
Effect of the welding current on the FZ and CGHAZ hardness Figure 6(a) shows the effect of welding current on the hardness of the FZ and CGHAZ, respectively. The properties of martensitic FZ and CGHAZ depend on several factors, including the primary austenite grain size, inner microstructure of the martensitic structure including the packet, block, and lath sizes, and martensite/austenite constitutes, if present. According to Figure 6(a), the hardness of the FZ and CGHAZ remained unchanged at various welding currents. This indicates that the cooling rate at various welding currents is sufficiently high to produce a martensitic microstructure in the FZs and UCHAZs of the welds made at all conditions. This partially reflects that the local properties of the FZ and CGHAZ are not significantly changed by variation of the welding thermal cycle.
Fig. 6 
Effect of welding current on the average hardness values of the (a) FZ and UCHAZ and (b) SCHAZ. The error bars represent the standard deviation of the data
-
(6)
Effect of the welding current on the SCHAZ hardness Figure 6(b) shows the effect of welding current on the minimum hardness in the SCHAZ and the softening ratio, defined as the hardness ratio of the SCHAZ to the BM. While the hardness of FZ and UCHAZ was almost unchanged at various welding currents, the minimum hardness of the SCHAZ was a function of the welding current. The SCHAZ is featured by precipitation of carbide particles, cementite (Fe3C), which were located along the inter- and intra-lath boundaries of martensite and primary austenite grain boundaries (Figure 7(a)). Hernandez et al.[20, 21] observed similar microstructural features in the SCHAZ of dual-phase steel during non-isothermal tempering. Figure 7(b) through (g) shows the effect of welding current on the microstructure of SCHAZ. According to Figure 7(b) through (g), increasing the welding heat input was observed to increase the number and size of Fe3C carbide particles, leading to more severe tempering phenomena and consequently more pronounced softening in the HAZ. The softening ratio of the welds made at 12 to 15 kA is lower than those in the other welds.
Fig. 7 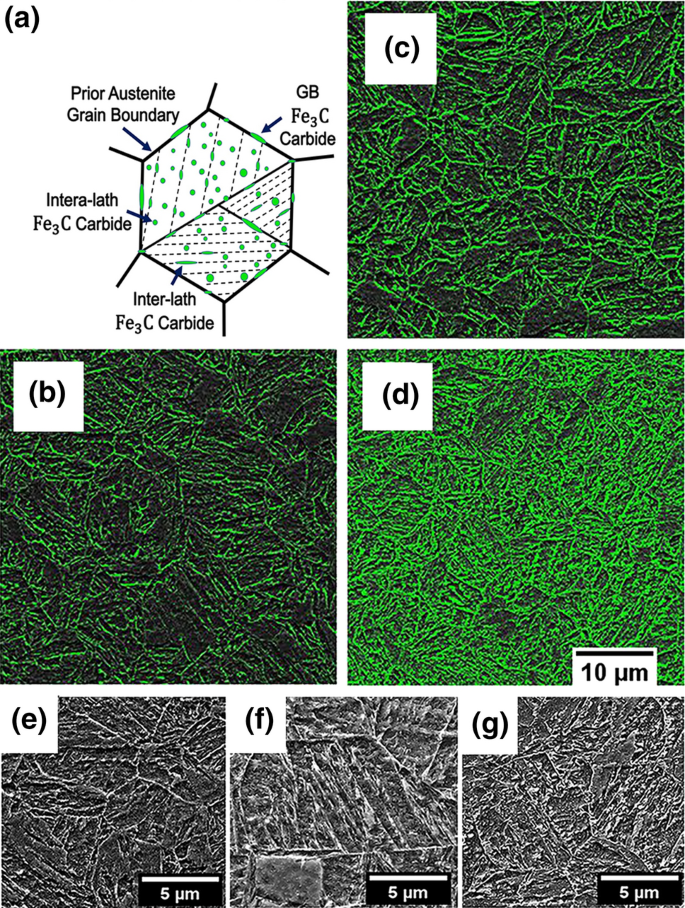
(a) Schematic of the tempered martensite microstructure of the SCHAZ; (b) to (d) effect of welding current on the distribution and amount of carbide particles at 7, 11, and 15 kA, respectively; (e) to (g) magnified images of SCHAZ at 7, 11, and 15 kA, respectively


3.3 Fracture Mode During the Cross-Tension Test
Four distinct fracture modes were observed during the cross-tension loading of the MS1400 resistance spot welds, including full interfacial failure (FIF), partial interfacial failure (PIF) mode, and pullout fracture initiated from UCHAZ (PFUCHAZ) and pullout mode initiated from SCHAZ (PFSCHAZ). Figure 8 shows the schematic representation of the observed fracture mode during the cross-tension test of MS1400 RSWs. Figure 9 shows the metallographic cross-section of the MS1400 spot welds after failure during the cross-tension test. Figure 10 shows the effect of welding current on the plug ratio (i.e., the ratio of the pulled-out zone diameter to the weld nugget diameter). According to Figure 10, increasing welding current decreases the tendency to crack propagation through FZ along the sheet/sheet interface and enlarges the fracture diameter. Based on the initial failure location and the plug ratio, the four fracture modes of MS1400 welds can be described as follows:

Four typical types of fracture mode after cross-tension test in MS1400 resistance spot welds: (a) full interfacial failure (FIF), (b) partial interfacial failure (PIF), (c) pullout failure from UCHAZ (PFUCHAZ), and (d) pullout failure from SCHAZ (PFSCHAZ)

Metallographic cross-section and stereographic image of MS1400 spot welds after the cross-tension test. (a) PIF failure of welds made at 8 kA. (b) PFUCHAZ failure of welds made at 10 kA. (c) PFSCHAZ of welds failing at 12 kA. The sequence of the failure is marked by 1 to 3

(a) Schematic of the resistance spot weld cross-section after the cross-tension test and definition of the plug ratio, Pr. (b) Effect of welding current on the plug ratio of MS1400 during resistance spot welds. The error bars represent the standard deviation of the data
-
(1)
Full interfacial failure (FIF) mode: The failure occurred via crack propagation through the FZ along the sheet/sheet interface. The plug ratio is zero for FIF. Small weld nuggets exhibit a reduced capability to bear normal force during cross-tension loading; therefore, FIF took place frequently at very low welding current (i.e., 7 kA in this research). The crack was initiated from the notch and then propagated into the fusion zone, and finally full interfacial fracture mode occurred. Figure 11(a) shows crack initiating from the notch during the cross-tension test. According to Figures 11(b) through (c), the fracture surface exhibited predominantly cleavage features with very tiny voids indicating the brittle nature of the interfacial failure.
Fig. 11 
(a) Metallographic image of crack initiation and propagation. (b) and (c) SEM fractography images of the interface fracture in the small nugget diameter produced using a welding current of 7 kA during the cross-tension loading of the MS1400 resistance spot weld
-
(2)
Partial interfacial failure (PIF) mode: Figure 9(a) shows that the failure was initiated by crack propagation through the notch along the sheet/sheet interface during the initial stage of the failure process during cross-tension loading. However, the crack redirected in the through-thickness direction along the UCHAZ, resulting in PIF mode. The sequence of failure location is marked by numbers 1 to 3 in Figure 9(a). The plug ration for PIF is 0 < Pr < 1 (see Figure 10). The welds made using low heat input conditions (i.e., welding current of 8 and 9 kA) exhibited a PIF during the cross-tension test.
-
(3)
Pullout mode initiated from UCHAZ (PFUCHAZ): According to Figure 10(b), the plug ratio for the welds failing via PF mode is larger than unity. Figure 9(b) shows the macrograph of the welds made at the welding current of 10 kA after the cross-tension test. According to Figure 9(b), the crack was initiated from the UCHAZ and then propagated in the through-thickness direction along the UCHAZ.
-
(4)
Pullout mode initiated from the SCHAZ (PFSCHAZ): Increasing the welding current beyond 11 kA shifted the pullout failure initiation site from UCHAZ to SCHAZ. According to Figure 9(c), the nugget is pulled out from the SCHAZ.

3.4 Cross-Tension Mechanical Properties
Figure 12 shows the influence of welding current on the load-displacement characteristics of the MS1400 resistance spot welds. As can be seen, the load-displacement shape is significantly affected by the welding current and the fracture mode. The load-bearing capacity (i.e., the peak load, Pmax, which is measured as the peak point at the load-displacement curve) and energy absorption capability (i.e., failure energy which is measured as the area under the load-displacement curve up to the peak point) are two key parameters for describing the mechanical behavior of the resistance spot welds. Figure 13 shows the cross-tension mechanical properties of the MS1400 resistance spot welds. According to Figure 13, increasing the welding current up to 11 kA enhances both the load-bearing capacity and energy absorption capability. Increasing the welding current beyond 11 kA is accompanied by a reduction in the load-bearing capacity and an increase in the energy absorption of the welds. The statistical analysis of data shows that the variation of the average peak load and the average energy absorption of the welds made at a high welding current of 12 to 15 kA is < 7 pct. The average peak load and energy absorption of the welds made at 12 to 15 kA are 7 ± 0.3 kN and 80 ± 3 J, respectively. Therefore, welds made at this high welding current regime exhibited comparable mechanical properties. Despite their larger nugget size, the peak load of the welds made at a high welding current is reduced by about 24 pct compared to the peak load of the welds made at the medium welding heat input region (i.e., 10 to 11 kA). However, the energy absorption of the welds made at high welding current is enhanced by 17 pct compared to the medium welding heat input region welds (i.e., 10 and 11 kA). The changes in mechanical properties of the welds made in the high welding current regime can be explained by the change in failure location, as detailed in the next section.

Effect of the welding current on the load–displacement characteristics of MS1400 martensitic steel resistance spot welds during the cross-tension test

Effect of welding current on the peak load and failure energy of MS1400 martensitic steel resistance spot welds during the cross-tension test. The error bars represent the standard deviation of the data
4 Discussion
The mechanical performance of resistance spot welds is governed by two categories of factors[5]:
-
(1)
Weld geometrical features: The two key weld physical attributes are FZ size and electrode indentation. The FZ size determines the area of the bonding zone that is enabled to support the normal loading in the sheet/sheet interface during the cross-tension test. The depth of the electrode indentation determines the level of stress concentration at the weld indentation wall.
-
(2)
Weld metallurgical features: Rapid heating and cooling during resistance spot welding alter the microstructure characteristics of the BM, which affect the local mechanical properties of the FZ and HAZ. The relative hardness/toughness of the FZ/HAZ compared to the BM is the key to predict the mechanical properties of the resistance spot welds.[5,26,27]
4.1 Factors Affecting Mechanical Properties and Pullout Failure Location of Resistance Spot Welds During the Cross-Tension Test
How the geometrical/metallurgical attributes of the weld affect the mechanical properties of the RSWs is a function of the fracture mode and the failure location. Figure 14(a) schematically illustrates the stress distribution in a spot weld during the cross-tension test. The sheets experience bending deformation in the initial stage of the cross-tension test. Figure 14(b) shows the experienced bending angle during the cross-tension test at different welding currents. The bending angle can be roughly correlated to the weld’s load-bearing capacity, which is controlled by the weld physical attributes, mainly FZ size and weld microstructure, mainly HAZ softening in this case. As a consequence of bending deformation during the cross-tension loading, normal stresses (σNugget and σHAZ) and shear stresses \( \left( {\tau_{\text{HAZ}} } \right) \) are developed, which play a key role in determining the failure characteristics of the joint. The following points should be considered to analyze the mechanical properties of the resistance spot welds in both interfacial and pullout mode:

(a) Normal and shear stress distribution around weld nugget and HAZ; (b) variation of bending angle with welding current for MS1400 martensitic steel resistance spot welds during the cross-tension test
-
(1)
As Figure 14(a) shows, the natural notch of the spot weld experiences Mode I fracture mechanics loading (i.e., opening mode). Therefore, the stress intensity factor in Mode I, \( K_{\text{I}} \) controlled by \( \sigma_{\text{Nugget}} \) and FZ size, is the driving force of the interfacial failure in the fusion zone \( \left( {F_{\text{IF}} } \right) \).[37] When the experienced \( K_{\text{I}} \) by the weld notch reaches \( K_{\text{IC}}^{\text{FZ}} \) (FZ fracture toughness), the spot weld fails under the cross-tension test. According to Chao’s analysis of fracture mechanics,[37] the peak load of interfacial fracture FIF in the cross-tension test can be determined by using the Eq. [1]:
$$ F_{\text{IF}} = 1.25\frac{{K_{\text{IC}}^{\text{FZ}} D^{2.5} }}{t} $$(1)where the t is the thickness of the welded sheet, and D is fusion size. According to Eq. [1], the load-bearing capacity of resistance spot welds in the interfacial failure is controlled by the fusion zone size, sheet thickness, and \( K_{\text{IC}}^{\text{FZ}} \).[5,37]
-
(2)
According to Figure 14(a), the nugget circumference (i.e., BM/HAZ) experiences shear stresses. According to Chao’s analysis,[37] when the shear stress experienced by the weld circumference reaches the fracture shear stress \( \left( {\tau_{\text{f}}^{\text{HAZ}} } \right) \) of the material, the spot weld fails under pullout mode. Therefore, the pullout peak load PIF can be determined using the following relationship:
$$ F_{PF} = tD\tau_{f}^{HAZ} $$(2)According to Eq. [2], the load-bearing capacity of resistance spot welds in pullout mode is controlled by the fusion zone size, sheet thickness, and shear strength of the failure location. Notably, the normal stress in the HAZ can also play a role in pullout failure during the cross-tension test.
-
(3)
The pullout failure location during the cross-tension is primarily dictated by the stress concentration associated with the weld notch. Radakovic and Tumuluru[32], using finite element modeling, showed that the location of maximum tensile stress during pullout failure in the cross-tension test of the spot welds is in the weld notch, and the direction of the maximum stress is nearly perpendicular to the loading direction. Based on the work of Radakovic and Tumuluru,[32] Figure 15 shows the plastic strain distribution that occurs in the pullout failure mode during the cross-tension test of a high-strength steel grade. According to Figure 15, the failure is initiated at the weld notch. This can explain why the pullout failure in the cross-tension test generally occurs at the FZ/CGHAZ boundary,[31,32,38] as was observed in the current study for welds made at welding currents of 10 and 11 kA. However, when there is significant HAZ softening, the strain localization in the tempered martensite zone promotes failure from the SCHAZ, as was observed in the current study for welds made at welding currents > 11 kA. The minimum hardness of the SCHAZ in welds made at 12–15 kA is lower than that of welds made using a lower welding current. Moreover, the soft SCHAZ in welds made at 12–15 kA is wider than that of welds made using a lower welding current. Both factors encourage failure initiation from the SCHAZ.
Fig. 15 
Plastic strain distribution during the pullout failure mode of the spot welds during the cross-tension test. This image from an article in the January 2012 issue of the Welding Journal, “An evaluation of the cross-tension test of resistance spot welds in high-strength dual-phase steels,” by D.J. Radakovic and M. Tumuluru is republished with permission from the American Welding Society (AWS).[32]

4.2 The Effect of HAZ Softening on the Peak Load of Spot Welds
Figure 16 presents the correlation among the cross-tension peak load, weld physical attributes (i.e., weld nugget size and electrode indentation), hardness values of the SCHAZ, and welding current. According to the preceding discussion, the cross-tension properties of the martensitic advanced high-strength welds can be justified based on the amount of heat input and consequently metallurgical characteristics of the welds, as follows:

Correlation among cross-tension peak load, minimum hardness in SCHAZ, FZ size, indentation percent, and welding current in MS1400 resistance spot welds
-
(1)
Low heat input regime (7 to 9 kA) In the low heat input regime, failure occurs via FIF or PIF mode. The welds made at a welding current of 7 kA exhibited the lowest bending angle during the cross-tension test (Figure 14(b)), generally reflecting its low load-bearing capacity. The low bending angle observed in this sample indicates that the weld experienced high \( \sigma_{\text{Nugget}} \) during loading. Therefore, at a welding current of 7 kA, where the FZ size is also small, the stress intensity factor experienced at the notch located at the sheet/sheet interface is sufficiently high to enforce full interfacial failure via crack propagation through FZ. The presence of hard martensite in the FZ provides a low fracture-toughness path to encourage interfacial failure. Notably, the presence of a sharp notch at the sheet/sheet interface in welds made at 7 kA also encouraged interfacial failure. Increasing the welding current to 8 to 9 kA enlarges the FZ size, which in turn decreases the driving force for crack propagation during Mode I. The experienced stress intensity factor is still sufficiently high to promote crack propagation through the FZ. However, as the failure progresses, the crack was redirected in the through-thickness direction resulting in PIF mode. Mechanical properties of welds failing in the FIF and PIF mode, respectively, depend on the FZ size and fracture toughness of the FZ. Since the FZ hardness is nearly constant for all of the welding currents and equals 400 ± 8 HV, the enhancement of mechanical performance of spot welds in this welding regime can be directly correlated to the enlargement of the FZ size. The welds made at a welding current of 8 to 9 kA exhibited a higher bending angle during the cross-tension, reflecting their improved mechanical performance compared to the weld failed at FIF.
-
(2)
Medium heat input regime (10 to 11 kA): In this welding heat input regime, pullout failure occurred during the cross-tension test. According to the results presented in Figure 13, the minimum welding current required to ensure the pullout failure mode is 10 kA. The occurrence of PF mode in this regime is a function of its larger FZ size. The larger FZ size decreases the stress intensity factor experienced by the weld notch at the sheet/sheet interface,[37] promoting the pullout fracture mode. Based on the observation of the failed samples and according to the experimental results (see Figures 13 and 2), the critical FZ size required to ensure the IF-to-PF fracture mode transition was about 6.5 mm in the 10 kA welding current. The experimental critical FZ size is well above the conventional thickness-based weld sizing criteria (i.e., 4t0.5,[5] t refers to the thickness of the spot-welded sheet in mm). Notably, according to Chao’s analysis,[37] the critical FZ size to ensure pullout failure mode during the cross-tension test is dictated by the sheet thickness and the ratio of the HAZ shear strength to the FZ fracture toughness. The failure location in the weld made at this welding current regime is located in the CGHAZ. In this welding current range, the failure location is dictated by the high-stress concentration associated with the weld notch, as was predicted by using the finite element models.[32]
-
(3)
High heat input regime (12 to 15 kA) Increasing the welding current beyond 11 kA led to a reduction in the load-bearing capacity of the weld by 24 pct compared to welds made with currents of 10 to 11 kA. The welds made with welding currents of 12 to 15 kA exhibited slightly lower bending angles during cross tension compared to the welds made using medium welding currents. The FZ size of welds made in the high heat input regime is larger than the welds made at medium heat input conditions. Therefore, in this welding current range, the high HAZ softening ratio, i.e., 0.53 (see Figure 6(b)), coupled with the formation of a wider HAZ softened zone size (see Figure 5), encourages strain localization in the SCHAZ, which in turn promotes a transition in failure location from the CGHAZ to the SCHAZ, where there is softening compared to the base metal. Therefore, failure of welds made in the high welding current regime occurred via crack initiation and crack propagation through the SCHAZ along the through-thickness direction. While the reduction of the load-bearing capacity of welds at high welding currents can be attributed mainly to HAZ softening, the high weld indentation can also play a detrimental role at a very high welding current (i.e., 15 kA). Therefore, it can be concluded that the positive effect of a larger FZ size on the joint peak load can be compromised by the detrimental effect of the severe softening in the HAZ. Despite higher indentation associated with welding using high heat input conditions, the energy absorption capability of the welds made at 12 to 15 kA did not decrease compared to the welds made using medium heat input welding (see Figure 13). This is due to the higher ductility of the pullout failure location in this welding regime (SCHAZ) compared to the pullout failure location in welds made with medium heat input conditions (i.e., CGHAZ).
5 Conclusion
The research question was whether the softening in the sub-critical heat-affected zone (SCHAZ) due to martensite tempering could affect the spot weld’s cross-tension strength in advanced high-strength martensitic steels. It is generally assumed that the pullout failure during the cross-tension test occurs from the martensitic coarse-grained upper-critical heat-affected zone (UCHAZ) because of the stress concentration associated with the presence of the weld's natural notch. Therefore, at first sight, it seems that softening in the SCHAZ cannot affect the weld’s load-bearing capacity. In this research, the role of HAZ softening on the pullout failure path and mechanical properties of the MS1400 advanced high-strength martensitic steel resistance spot welds is studied. The following conclusions can be drawn from this study:
-
1.
The pullout failure location during the cross-tension test is determined by the competition between the stress concentration associated with the weld notch, which promotes failure from the martensitic coarse-grained UCHAZ, and the strain localization related to the HAZ softening, which helps failure from the SCHAZ.
-
2.
The highest load-bearing capacity was obtained at a medium heat input welding regime (i.e., welding at 10 to 11 kA) when the pullout failure location of MS1400 resistance spot welds was the coarse-grained UCHAZ.
-
3.
Despite the larger FZ size of the welds made at high heat input conditions (i.e., welding at 12 to 15 kA) compared to the welds made at medium heat input conditions, their average peak load was reduced by 24 pct. In the high heat input welding regime, the increase in the degree and extent of the HAZ softening can lead to a pullout fracture mode transition from coarse-grained UCHAZ to SCHAZ, which is accompanied by a reduction in load-bearing capacity of the welds.
-
4.
Controlling HAZ softening is a key factor in producing high-performance resistance spot welds in martensitic advanced high-strength steel sheets. The minimum heat input required to avoid the interfacial failure mode and guarantee achieving pullout failure should be used to avert the detrimental effect of HAZ softening on the weld peak load.
References
[1] C. Lesch, N. Kwiaton, and F. B. Klose: Steel Res. Int., 2017, 88, pp. 1-21.
[2] H. Safari, H. Nahvi, and M. Esfahanian: Int. J. Crashworthiness, 2018, vol. 23, pp. 645–659.
[3] B. K. Zuidema: JOM, 2012, vol. 64, pp. 1039–1047.
[4] C. M. Tamarelli: Steel Mark. Dev. Institute, Michigan, 2011, pp. 1-42.
[5] M. Pouranvari and S. P. H. Marashi: Sci. Technol. Weld. Join., 2013, vol. 18, pp. 361–403.
[6] N.D. Raath, D. Norman, I. Mcgregor, S. Hepple, R. Dashwood and D.J. Hughes: Metall. Mater. Trans. A, 2018, vol. 49, pp. 1536–51.
[7] M. Sheikhi, M. ValaeeTale, GH.R. Usefifar and A. Fattah-Alhosseini: Metall. Mater. Trans. A, 2017, vol. 48, pp. 5415–23.
[8] H. Rezayat, H. Ghassemi-Armaki, S. Sriram, and S. S. Babu: Metall. Mater. Trans. A, 2020, vol. 51, pp. 2209–21.
[9] M. Bemani and M. Pouranvari: Mater. Sci. Eng. A, 2020, vol. 773, pp. 1-9.
[10] G. Park, K. Kim, S. Uhm, and C. Lee: Mater. Sci. Eng. A, 2019, vol. 766, pp. 1-11.
[11] S.S. Beni, M. Atapour, M.R. Salmani, and R. Ashiri: Metall. Mater. Trans. A, 2019, vol. 50, pp. 2218-34.
[12] Z. Ling, T. Chen, L. Kong, M. Wang, H. Pan, and M. Lei, 2019: Metall. Mater. Trans. A, vol. 50, pp.5128-42.
Kalashami AG, DiGiovanni C, Razmpoosh MH, Goodwin F, Zhou NY: Metall. Mater. Trans. A, 2020, 51, 2180–91.
[14] J. E. Gould, S. P. Khurana, and T. Li: Weld. J, 2006, vol. 85, pp. 111-116.
[15] G. Park, K. Kim, S. Uhm, and C. Lee: Mater. Sci. Eng. A, 2019, vol. 752, pp. 206–216.
[16] M. Pouranvari and S. P. H. Marashi: Mater. Sci. Eng. A, 2011, vol. 528, pp. 8337–43.
[17] H. Aghajani, and M. Pouranvari: Metall. Mater. Trans. A, 2019, vol. 50, pp. 5191-5209.
[18] D. C. Saha, E. Biro, A. P. Gerlich, and Y. Zhou: Metall. Mater. Trans. A, 2020, vol. 51A, pp. 3772–77.
[19] S. Vignier, E. Biro, and M. Hervé: Weld. World, 2014, vol. 58, pp. 297–305.
[20] V. H. B. Hernandez, S. K. Panda, Y. Okita, and N. Y. Zhou: J. Mater. Sci., 2010, vol. 45, pp. 1638-47.
[21] V. H. B. Hernandez, S. S. Nayak, and Y. Zhou: Metall. Mater. Trans. A, 2011, vol. 42, pp. 3115-29.
[22] D. S. Safanama, S. P. H. Marashi, and M. Pouranvari: Sci. Technol. Weld. Join., 2012, vol. 17, pp. 288–294.
[23] M. Pouranvari, S. Sobhani, and F. Goodarzi: J. Manuf. Process., 2018, vol. 31, pp. 867–874.
[24] E. Biro, J. R. McDermid, J. D. Embury, and Y. Zhou: Metall. Mater. Trans. A, 2010, vol. 41, pp. 2348-56.
[25] S. S. Nayak, V. H. B. Hernandez, and Y. Zhou: Metall. Mater. Trans. A, 2011, vol. 42, pp. 3242-48.
[26] M. Pouranvari: Sci. Technol. Weld. Join., 2018, vol. 23, pp. 520–526.
[27] M. Pouranvari: Mater. Sci. Eng. A, 2017, vol. 680, pp. 97–107.
[28] V. H. B. Hernandez, M. L. Kuntz, M. I. Khan, and Y. Zhou: Weld. Join., 2008, Vol. 13, pp. 769-776.
[29] M. Tamizi, M. Pouranvari, and M. Movahedi: Sci. Technol. Weld. Join., 2017, vol. 22, pp. 327-335.
[30] S. Zuniga and S. D. Sheppard: ASTM International, 1997, Vol. 27, pp. 469-489.
[31] Y. J. Chao, J. Eng: Mater. Technol., 2003, vol. 125, pp. 125-132.
[32] D. J. Radakovic and M. Tumuluru: Weld. J., 2012, vol. 91, pp. 8-15.
[33] A. Chabok, E. van der Aa and Y. T. Pei: Mater. Sci. Eng. A, 2020, vol. 788, pp. 1-13.
[34] M. Tumuluru, Weld. J, 2010, vol. 89, pp. 91-100.
P. Eftekharimilani, E. M. Van der Aa, R. Petrov, M. J. M. Hermans, I. M. Richardson: Metall. Mater. Trans. A, 2018, vol. 49, pp. 6185-6196.
American National Standard Institute, American Welding Society, AWS D8.9M, 2012, pp. 43–45.
[37] Y. J. Chao: Sci. Technol. Weld. Join., 2008, vol. 8, pp. 133–137.
[38] S. Dancette, D. Fabrègue, V. Massardier, J. Merlin, T. Dupuy, and M. Bouzekri: Eng. Fract. Mech., 2011, vol. 78, pp. 2259-2272.
Acknowledgments
The authors offer their special thanks to SSAB Company, Swedish-Finnish Company, for supplying martensitic advanced high strength steel (Docal M1400) for this scientific work.
Author information
Authors and Affiliations
Corresponding author
Additional information
Publisher's Note
Springer Nature remains neutral with regard to jurisdictional claims in published maps and institutional affiliations.
Manuscript submitted July 6, 2020; accepted November 5, 2020.
Rights and permissions
About this article

Cite this article
Tamizi, M., Pouranvari, M. & Movahedi, M. The Role of HAZ Softening on Cross-Tension Mechanical Performance of Martensitic Advanced High Strength Steel Resistance Spot Welds. Metall Mater Trans A 52, 655–667 (2021). https://doi.org/10.1007/s11661-020-06104-5
Received:
Accepted:
Published:
Issue Date:
DOI: https://doi.org/10.1007/s11661-020-06104-5