
Abstract
To deeply understand the failure characteristics of defective rock under actual stress condition, impact tests were conducted on prismatic granite containing two rectangular holes with different axial static pre-stresses by a modified split Hopkinson pressure bar (SHPB), and uniaxial compression tests were also carried out for comparison. Combined with digital image correlation (DIC), the dynamic damage and fracture process of specimens were observed by low-speed and high-speed cameras. Moreover, the energy evolution characteristics of specimens were analyzed to further understand the failure mechanism. The results indicate that the pre-stress has dual effects on the dynamic mechanical behavior of rock specimens, and the transition mechanism of the effect of pre-stress can be revealed by the elastic deformation limit. Observations show that the failure of specimens under different loads is caused by the growth of secondary cracks at hole corners. However, with the increase in pre-stress, the crack mode tends to shear and the strain localization tends to concentrate on sidewalls, resulting in severe rock bursting and extensive fracturing. Four coalescence modes around two rectangular holes were summarized: diagonal shear coalescence under static load, no coalescence under dynamic load, shear coalescence inside the middle rock bridge area under the pre-stress of 25–55% UCS, and indirect coalescence outside the rock bridge area under the pre-stress of 75% UCS. The specimen with the pre-stress of 75% UCS releases the internal strain energy during dynamic failure process, while the specimen with lower pre-stress absorbs the external impact energy. Finally, some insights are provided for deep rock engineering based on the test results.
1 Introduction
Rock mass is a complex geological medium containing various initial defects, such as joints, fissures and pores. Under external loads, new cracks may initiate and propagate from tips or corners of these defects due to stress concentration, and finally coalesce with each other into macro cracks, leading to the failure and instability of rock structures such as tunnels and pillars [14, 18]. The strength and deformation behaviors of rock material are highly dependent on the crack propagation around the flaws [60]. Therefore, the investigation on the mechanical behavior and fracture evolution of rock with flaws are of great significance to understand the failure mechanism of rock since it is highly related to the stability of rock engineering.
In the past decades, the mechanical properties and cracking behavior of rock or rock-like specimens containing single flaws under static compression have been systematically studied by experimental, numerical and theoretical methods [4, 16, 20, 34, 39, 54, 60, 68, 69]. Results indicated that strength attenuation and failure process of rock are controlled by a series of factors, such as the flaw geometries, the material properties and the loading conditions. It is generally recognized that, for a single crack-like flaw under uniaxial compression, wing cracks first initiate from the flaw tip and propagate towards the major stress direction, and then secondary cracks occur at the flaw tip and propagate in the coplanar or oblique direction with the flaw [39, 54, 60]. For a single hole-like flaw, three types of cracks can be observed around a circular hole: primary cracks resulting from tensile stress concentration at roof and floor, secondary cracks distributed at corners and slabbing cracks induced by compressive stress at sidewalls [4, 16, 34, 68, 69]. Moreover, as the confining stress increases, both the primary crack and secondary crack will be arrested and disappear gradually [20]. Great efforts have also been devoted to double or multiple flaws, and the cracking behavior and coalescence pattern are strongly affected by the interaction of flaws [3, 15, 17, 35, 36, 43, 44, 47, 52, 53, 55, 58, 59, 65, 67]. Wong and Chau [52] summarized crack coalescence between double crack flaws into three modes: shear cracks between flaws, mixed shear/tensile cracks within the bridge area and wing tensile cracks from tips of flaws. Crack patterns in rock with multiple flaws can also be classified as wing cracks and secondary cracks, and the formation of different crack coalescence modes is a consequence of competition of mechanisms in tensile or shear [3, 15, 35, 43]. For double or multiple hole-like flaws, Sammis and Ashby [44] proposed the theoretical analysis of the brittle failure of solids containing multiple holes. Zhu et al. [67], Zhou et al. [65] and Wu et al. [55] investigate the mechanical behavior and fracture evolution of rock containing double circular holes, rectangular holes and inverted U-shaped holes with different layouts under uniaxial compression by DIC and AE techniques. Yang et al. [59] summarized four distinct modes around two oval flaws: no crack coalescence failure, indirect crack coalescence outside the bridge area failure, single crack coalescence inside the bridge area failure and tensile crack coalescence outside the bridge area failure. Tang et al. [47], Lin et al. [36] and Huang et al. [17] further studied the cracking behavior of specimens containing multiple circular holes. They found that the rock failure was induced by the coalescence of partial holes, and the coalescence behavior was controlled by rock material, hole geometry and load condition.
Apart from static loading condition, rock fracture under dynamic loading has attracted the attention of many scholars in recent years. To study the influence of flaw inclination angle and loading condition on dynamic crack propagation, Li and Wong [29] carried out numerical study on rock with a pre-existing flaw by means of finite element method (FEM) and non-linear dynamics method, and the numerical results were later verified by similar experiments on marble [31, 71] and gypsum [72] using a split Hopkinson pressure bar (SHPB). They found that the mechanical properties of rock under dynamic load were significant higher than that of under static load, and showed rate-dependent. In addition, shear cracks initiated from flaw tips appeared earlier than tensile wing cracks and dominated the rock failure under dynamic loading. Li et al. [23] further investigated the effects of flaw angle and ligament angle on coalescence behaviors of rock with double flaws in SHPB tests, and nine types of crack coalescence behaviors are identified. The failure mode of the flawed specimens under dynamic compression is mainly the shear failure in “X” shape regardless of the flaw inclination angle, which is quite different from that of the rock failure dominated by tensile splitting under static loading.
The above efforts provide strong evidence to reveal the failure mechanisms of defective rocks under different stress states. However, most of them were focused on the effect of flaw geometry on crack process of rock under static or dynamic compression, while the effect of pre-stress on dynamic mechanical behavior and fracture evolution of rock, as well as the crack coalescence between rectangular holes were rarely discussed. Essentially, underground rock structures are likely to be subjected to both in-situ stress and dynamic disturbances induced by blasting, drilling or earthquakes [41]. Inspired by this, the dynamic stress concentration, mechanical response and failure process of intact rock or defective rock under coupled static-dynamic loads were investigated [2, 9, 25, 30, 50, 56, 63] based on the modified SHPB system developed Li et al. [33]. It was concluded that the mechanical behavior and failure characteristics of rock under coupled loads were quite different from that solely under either static or dynamic load, and were affected by both static pre-stress and dynamic load. Virtually, the energy partition of rock with different pre-stresses is different, and the failure process of rock structures is controlled by the combined effects of the strain energy stored in rock and the external dynamic disturbance [63]. Hence, it is great practical significance to investigate the fracture and energy evolution characteristics of defective rock that are subjected to coupled static and dynamic loads.
In view of this, uniaxial compression tests and coupled static-dynamic loading tests were conducted on prismatic granite specimens with double rectangular holes. The effect of static pre-stress on dynamic mechanical behavior of rock was investigated. The damage and fracture process (especially crack coalescence) of specimens under different loads were observed and analyzed in detail by using low-speed and high-speed cameras with digital image correlation (DIC) method. Moreover, the energy evolution characteristics were studied for better understanding the failure mechanism.
2 Test methodology
2.1 Material characterization
In this study, granite collected from a quarry in Zhangzhou city, Fujian Province of China, was used as the rock material. A thin section of the granite was examined with a petrographic microscope under plane polarization light (PPL) and cross polarization light (CPL), as shown in Fig. 1. The mineral composition and grain size distribution of the granite are listed in Table 1. Optical microscopy analysis revealed that the rock is classified as fine-grained quartz diorite with holocrystalline texture and massive structure. Some basic physical and mechanical parameters of the tested granite are tabulated in Table 2. The uniaxial compressive strength (UCS) and Brazilian tensile strength (BTS) of the granite are 181.73 and 11.08 MPa, respectively, and the ratio of UCS to BTS is about 16, which indicates that the granite rock is a typical brittle rock [10].

Polarized light micrographs of the tested granite: a PPL; b CPL. (The letters Pl, Q, Bt, Px and Hbl represent plagioclase, quartz, biotite, pyroxene and hornblende, respectively)
2.2 Specimen preparation
In order to obtain more explicit observations of the fracture evolution [40], a single granite block with good geometrical integrity and petrographic uniformity was sliced to obtain prismatic specimens with average height, width and thickness of 45, 45, and 20 mm, respectively, and the feasibility and validity of prismatic rock specimens in SHPB test have been proved [32]. Then two rectangular holes with height of 12 mm and width of 9 mm were cut through on each specimen by a high-pressure water-jet cutting machine. The geometries of the pre-holed specimen and stress conditions are sketched in Fig. 2. For a better comprehension, figures of the specimen in coupled loading test have been rotated to the left by 90° to make the longitudinal axis of the hole consistent with the vertical direction. The region of interest (ROI) is the specimen surface observed by the camera, and the solid arrow indicates the direction of applied loads. In the uniaxial compression test, the axial static load is applied on the upper end of the specimen. In the coupled static-dynamic loading test, the axial static pre-load is first applied on the lower end of the specimen, and then the dynamic load is applied on the upper end of the specimen. After cutting, the loading ends of all specimens were then polished smooth in accordance with the standards of the International Society for Rock Mechanics (ISRM) [66].

Geometries of specimen with double rectangular holes and stress conditions
Specimens were prepared in five groups with three in each. The detailed geometrical sizes and mechanical parameters of various groups of specimens are listed in Table 3. Among them, Group D is the specimen under coupled static-dynamic loads. Group S is the specimen under static uniaxial compression, and the average UCS of the pre-holed specimen is 114.23 MPa. Prior studies suggested that the static pre-stress should not exceed 80% UCS due to the abrupt failure tendency of specimen before impact [21, 33]. The reason probably lies in the fact that the stiffness of coupled static–dynamic loading system is lower than that of conventional servo-hydraulic loading system, resulting in the reduction of the apparent strength of specimen. When the pre-stress reaches 80% UCS, the specimen may reach or even exceed its failure stress, further decreasing the stability of the specimen and system. Therefore, before the dynamic load with the constant gas pressure of 0.45 MPa, the axial static pre-stresses for these specimens are set to 0, 28.89, 62.78 and 86.63 MPa, respectively, which is approximately equivalent to 0%, 25%, 55%, 75% of UCS. Before testing, an artificial speckle field was made on the specimen surface due to the utilization of DIC method, which relies on a contrasting random texture [46]. Due to the different test conditions and the resolution of the camera used in the static and dynamic tests, the typical speckle patterns on specimen surface in these two groups of tests are shown in Fig. 2.
2.3 Testing setup and method
In order to understand the mechanical behavior of the granite specimen under static compression and coupled static-dynamic compression, two series of tests were conducted by a servo-hydraulic loading system and a modified split Hopkinson pressure bar (SHPB), respectively. During the test, the damage and fracture evolution on the specimen surface were simultaneously recorded and analyzed by DIC technology combined with a low-speed (LS) camera or a high-speed (HS) camera. Details for respective testing procedures are introduced in the following parts.
2.3.1 Uniaxial compression test
Uniaxial compression test was carried out using a MTS-322 servo-hydraulic loading system manufactured by the MTS System Corporation in the Advanced Research Center at Central South University. The system consists of hydraulic power unit, hydraulic wedge grip and system electronics, with a maximum axial load capacity of 500 kN. Before applying the load, in order to minimize the friction effect, rigid metallic plates were placed on the loading ends of specimens, and the contact surfaces were lubricated with some grease. Under displacement-controlled condition, the axial force was applied on the end of the specimen at a constant vertical loading speed of 0.6 mm/min (strain rate of 2.22 × 10⁻⁴ s−1) to ensure the quasi-static equilibrium of the specimen during the test. In this test, under the illumination of two LED lights (ZF-3000) with a brightness of 2800 Lumens, a complementary metal oxide semiconductor (CMOS) sensor-based LS camera (Point Gray Research Inc.-GS3-U3-123S6M-C) was placed perpendicularly to the front surface of the specimen so as to simultaneously capture the images that were stored in a computer for subsequent processing. The resolution of the camera is 4096 × 3000 pixels with an 8-bit digitization for gray levels, and the length-pixel ratio of the imaging system is 0.0613 mm/pixel. The CMOS camera was programmed to capture the images automatically at a frame rate of 10 fps (frames per second).
2.3.2 SHPB test
A modified SHPB system at Central South University was adopted to load the specimens with coupled static-dynamic loads. The photographic view of the experimental setup is shown in Fig. 3. It can be seen that the experimental setup mainly consists of a coupled static-dynamic loading system and a LS/HS photography system. The coupled loading system consists of a gas gun, a cone-shaped striker, an incident bar, a transmitted bar, a momentum bar, a set of axial static pressure device and a data acquisition system (a SDY2107A super dynamic strain meter coupled with a DL850E digital oscilloscope). The striker and bars are made of high-strength 40Cr alloy steel. The diameter, elastic modulus, P-wave velocity and density of the bars are 50 mm, 233 GPa, 5458 m/s and 7817 kg/m3, respectively. For more detailed information about this system please refer to Li et al. [33]. In SHPB tests, specimens were sandwiched between the incident bar and transmitted bar with some lubricant on the contact surfaces of the specimen and the bars to minimize the end friction effect. Based on the one-wave propagation theory, the axial stress \(\sigma (t)\), strain \(\varepsilon (t)\) and strain rate \(\dot{\varepsilon }(t)\) are derived by the following equations [21]:
where \({A}_{\mathrm{e}}\), \({C}_{\mathrm{e}}\) and \({E}_{\mathrm{e}}\) are the cross-sectional area, P-wave velocity and Young’s modulus of the elastic bar, respectively. \({A}_{s}\) and \({L}_{s}\) are the cross-sectional area and length of the specimen, respectively. \({\varepsilon }_{\mathrm{I}}(t)\), \({\varepsilon }_{\mathrm{R}}(t)\) and \({\varepsilon }_{\mathrm{T}}(t)\) are incident, reflected and transmitted strain pulses, respectively.

Experimental setup for SHPB test
In coupled static-dynamic loading test, the loading process is divided into two parts: static pre-load and dynamic load. Therefore, the damage process of rock under static pre-load was recorded by a LS camera (as used in Sect. 2.3.1). A CMOS sensor-based HS camera (Vision Research Inc.-Phantom V711), mounted with the lens of Nikon AF Zoom-Nikkor 80–200 mm f/2.8D ED, was used to capture the fracture process of specimens under dynamic load. The resolution was set as 256 × 256 pixels at a frame rate of 79,161 fps with 6 μs exposure time. The specimen was illuminated from the front by two LED spotlights (Visual Instrumentation Corp.-Model 900420H) with intensity controlled by a Video Flood controller source (Visual Instrumentation Corp.-Model 201240A). The HS camera and the oscilloscope were both triggered by a transistor-transistor logic (TTL) signal generated by the strain gage on the incident bar. Thus, the number of captured images before the stress wave arrived at the specimen end could be obtained as follows [61]:
where \({t}_{\mathrm{s}}\) is the time-of-arrival of the specimen; \({t}_{\mathrm{In}}\) is the time-of-arrival of the incident wave; \({t}_{\mathrm{TTL}}\) is the time triggered by a TTL signal that is determined from the incident wave data; \({t}_{\mathrm{frame}}\) is the inter-frame time of the HS camera. From Eq. (4), the time matching with microsecond accuracy between high-speed image and loading stress could be achieved.
2.3.3 Digital image correlation method
DIC belongs to a class of non-contact methods that acquire images of an object, store images in digital form and perform images analysis to extract full-field shape, deformation or motion measurements [46]. Conceptually, DIC is simply a particle tracking method that can be used to determine displacements of speckles in a digital image. This calculation technique starts with a reference image taken before loading, coupled with a series of pictures during the loading period. An assumption is proposed that the gray value of the images remains the same before and after the deformation. First of all, select a region of interest (ROI) on the specimen surface; and then, divide this region into numbers of subsets; calculate the initial displacements of these subsets; search for the corresponding subsets after deformation based on the assumption and calculate the displacements; finally, the deformation fields of specimens were then obtained and analyzed by post-processing.
The calculation configurations of VIC-2D software in DIC post-processing are as follows [57]: subset: 17, step: 1, subset weights: Gaussian weights, interpolation: optimized 8-tap, correlation criterion: normalized squared differences. During the correlation, the confidence margins (error tolerance during the matching) were under 0.05 pixel controlled by a computing threshold, and the filter size was chosen to be 5 in the strain computation.
3 Uniaxial compression test results and analyses
In order to study the deformation and fracture process of intact and pre-holed specimens under static uniaxial compression, the typical intact specimen S-Int-2 and pre-holed specimen S–H-1 are taken as an example to discuss and analyze in this section. The stress–strain curves and final failure patterns of the intact and pre-holed specimens under uniaxial compression are shown in Fig. 4. Based on the evolution process of strain fields on the specimen surface, the stress–strain curve of the pre-holed specimen under uniaxial compression can be roughly divided into five stages [68]: I stage (0%-25% UCS) is the pore compaction stage; II stage (25%-55% UCS) is the elastic deformation stage; III stage (55%-75% UCS) is the stable crack growth stage; IV stage (75%-100% UCS) is the unstable crack growth stage; V stage (100%-0% UCS) is the post-peak stage.

Stress–strain curves a and final failure patterns b of intact specimen and pre-holed specimen under uniaxial compression
By comparison, it can be found that the stress–strain behavior of the intact specimen and the pre-holed specimen both show plastic-elastic deformation characteristics before the peak stress. The difference is that the length and slope of the elastic deformation stage in the stress–strain curve of the intact specimen are obviously larger than that of the pre-holed specimen, and the strength and deformation properties of the rock are significantly deteriorated due to the holes. The specific mechanical parameters are listed in Table 3. The results show that the peak stress and elastic modulus of the intact specimen are 217.34 MPa and 22.13 GPa, respectively, while those of the pre-holed specimens are 114.23 MPa and 14.89 GPa, which are reduced by 47.44% and 32.72%, respectively. In the post-peak region, the crack propagates rapidly from the upper right corner of the intact specimen to the lower end, and the stress drops rapidly to 0 MPa, accompanied by a loud sound, showing obvious brittle failure characteristics. However, for the pre-holed specimen, there are several secondary cracks around the holes at 90% UCS after the peak, but the specimen has not been penetrated by the cracks. Subsequently, with the rapid propagation of secondary cracks around the holes and shear crack in the middle rock bridge, the rock structure loses its structural integrity.
Figure 5 presents the major principal strain fields of the pre-holed specimen at the six stress points in the uniaxial compression test. A positive value of the strain in Fig. 5 corresponds to a tensile strain, while a negative value denotes compression [46]. It can be seen that there exists a significant pore compaction stage in the initial stage of the stress–strain curve. When the stress increases to 25% of UCS, the strain feature on the specimen surface is randomly distributed around the holes, and most areas are subjected to compression strain (Fig. 5a). After that, the stress–strain curve turns into the elastic deformation stage with the increase in the axial loading. When the stress reaches 55% of UCS, it can be observed from Fig. 5b that, the high strain zones first appear at the top and bottom locations surrounding the holes due to tensile stress concentration [51]. Therefore, the stress of 55% UCS can be considered as the critical stress of tensile crack initiation. As the stress increases from 55 to 75% UCS, the stress–strain curve is in the stable crack growth stage, and both of the crack density and length increase steadily with stress. It can be seen from the comparison between Fig. 5b and c that the high strain zones widen, intensify and lengthen along the loading direction, and a potential inclined shear band with low strain intensity initiates from the lower corner of the hole. After that, the stress–strain curve turns into the unstable crack growth stage, and a secondary crack growth characterized by strain localization appears near the upper left corner of the left hole as the stress increases to 90% UCS (Fig. 5d).

Major principal strain fields of specimen S–H-1 at corresponding stress stages
As the stress rises to the peak, it can be seen from Fig. 5e that, strain localizations gradually occur at the other corners of the holes as a result of high compression-shear stress concentration [51], while tensile cracks at the top or bottom of the holes are forced to be closed by the nucleation and propagation of localized zones [4, 34]. Meanwhile, sidewall slabbing is observed in the left wall of the left hole, which is just like the rib slabbing in underground tunnel engineering [7]. In addition, high strain concentrates along the right sidewall of the middle rock bridge, which eventually evolves into slabbing or spalling in the post-peak stage. Subsequently, as the stress drops to 90% UCS, the rapid growth of secondary cracks and far-field cracks can be observed on the specimen surface (Fig. 5f). Finally, with the further development and coalescence of high strain localizations or visible cracks, the specimen is destroyed, accompanied with a dramatic stress drop and a loud sound during the dropping. The failure of rock bridge is caused by the diagonal coalescence of shear cracks initiated from the lower corner of the hole, with the upper corner of another hole, i.e., shear coalescence [59]. Notably, the failure of load-bearing structure of the specimen is mainly caused by the secondary crack propagation at the hole corners, rather than the tensile cracks at the top and bottom locations of the holes, showing a mixed tensile-shear failure.
4 Dynamic test results and analyses
4.1 Dynamic stress equilibrium
For an effective SHPB test, dynamic stress equilibrium should be achieved prior to rock failure, which can be verified by comparing the dynamic stress histories on both ends of the specimen. In particular, the cone-shaped striker invented by Li et al. [26] was used in this test, which can generate a slow-rising half-sine wave to eliminate Pochhammer-Chree oscillation, minimize dispersion effect, overcome premature failure and achieve constant strain rate on brittle materials [66]. Figure 6a presents stress histories on both ends of the typical specimen D-H-0–3. The dynamic stress on the incident side of the specimen is the sum of the incident stress and reflected stress, and the dynamic stress on the transmitted side is the transmitted stress. Obviously, the dynamic stresses on both sides are almost the same during the whole loading process, indicating that the dynamic stress equilibrium condition can be achieved and maintained for the specimen with double rectangular holes during the dynamic loading. Since there is no global force difference in the specimen which induces inertial force, the axial inertial effect can be ignored [6]. In addition, the evolution process of strain fields in y-direction on the specimen surface was obtained by DIC method to verify the strain uniformity of the specimen under dynamic load, as shown in Fig. 6b. It can be seen that the strain fields on the specimen surface before the peak stress (t = 104 μs) are basically uniform. The above results indicate that the stress balance and strain uniformity of the specimen in the SHPB test are reliable, and thus the SHPB test results are validated to be effective.

Dynamic stress equilibrium a and strain uniformity b in specimen D-H-0–3
4.2 Dynamic stress–strain behavior
In SHPB tests, the dynamic strength of rock material is dependent on the strain rate [62]. Therefore, the dynamic strength of rock is comparable only at similar strain rates. In order to characterize the dynamic loading of each test, the strain rate of the specimen was determined from the strain rate history using Eq. (3) according to the ISRM suggested method for rock dynamics [66]. The time evolution of strain rate and dynamic stress of the typical specimen D-H-25–3 is shown in Fig. 7. It can be seen that there exists an approximate plateau lasting from 47 to 92 μs before the peak stress, indicating that the rock specimen deforms at a constant speed during this stage. The average value of the plateau can be defined as the strain rate of the specimen.

Histories of strain rate and dynamic stress of specimen D-H-25–3
The typical dynamic stress–strain curves and final failure patterns of intact specimen and pre-holed specimens under dynamic loading are plotted in Fig. 8. Compared with the static stress–strain curve in Fig. 4, it can be seen that the pore compaction stage is not involved in the dynamic stress–strain curve, which is mainly due to the compaction effect of axial pre-load on initial micro-cracks in rock. On the other hand, initial micro-cracks are not closed timely under dynamic load due to the extremely short impulse duration, resulting in the pre-peak region of dynamic ones is nearly linear without a compaction stage [33]. The dynamic stress–strain behavior of intact and pre-holed specimens show elastic–plastic deformation characteristics before the peak stress, which can be roughly divided into three typical stages: (1) the linear elastic deformation stage, where the stress increases linearly with the increasing strain; (2) the crack growth stage, where the stress–strain curve deviates from the linearity, and micro-cracks begin to initiate, nucleate and propagate; (3) the macro failure stage, where the stress–strain curve enters the decreasing part after the peak stress, and the further development of cracks leads to rock failure.

Dynamic stress–strain curves a and failure patterns b of intact specimen and pre-holed specimens under dynamic loading
Consistent with the static results, the length and slope of the elastic deformation stage in the dynamic stress–strain curve of the intact specimen are obviously larger than that of the pre-holed specimen, and the dynamic mechanical properties of the rock under dynamic loading are significantly deteriorated due to the holes. The specific mechanical parameters are listed in Table 3. The results show that the dynamic strength and elastic modulus of the intact specimen are 283.07 MPa and 63.46 GPa, respectively, while those of the pre-holed specimens are 130.18 MPa and 28.61 GPa, which are reduced by 54.01% and 54.92%, respectively. In addition, it can be seen from the final failure patterns that, different from the mixed tensile-shear failure of the specimen under static compression, the failure of intact specimen and pre-holed specimen under dynamic loading is mainly caused by multiple tensile cracks parallel to the loading direction. The tensile cracks in the pre-holed specimen mainly initiate at the roof, floor or corners of the holes due to stress concentration and propagate to the end of the specimen, while most of the tensile cracks in the intact specimen propagate from the incident end to the transmitted end.
4.3 Dynamic mechanical properties
Figure 9 further gives the dynamic strength and combined strength of specimens with different pre-stresses under the same dynamic load. The detailed results of the testing specimens are listed in Table 3, in which \({\sigma }_{\mathrm{as}}\) and \({\sigma }_{\mathrm{d}}\) are defined as the axial static pre-stress and dynamic strength of specimens respectively, and the definition of combined strength \({\sigma }_{\mathrm{cs}}\) is the sum of the axial static pre-stress and dynamic strength [30]. The strain rate of the specimens is maintained at about 50–60 s−1, which can be regard as a constant strain rate range. However, it may be due to the test operation problems that the strain rate and mechanical parameters of specimens D-H-0–1 and D-H-55–1 differ greatly from the average values of the same group of specimens, so the corresponding test results have been excluded.

Influence of pre-stress on dynamic strength and combined strength
It can be seen from Fig. 9 that, the static strength of the specimen is 114.23 MPa, while the dynamic strength of the specimen without pre-stress jumps to 130.18 MPa, increased by 13.96%. Under coupled static and dynamic loads, as the pre-stress increases, the dynamic strength of the specimen increases first and then decreases, and reaches the maximum value of 170.67 MPa when the pre-stress is 25% UCS, which is 31.10% higher than that of the specimen without pre-stress. When the pre-stress is 75% UCS, the dynamic strength has a significant reduction to 118.59 MPa, even 8.90% lower than that under pure dynamic load. It also can be seen that the combined strength of the specimen increases with the pre-stress until the pre-stress reaches 75% UCS, but the combined strength of the specimen with pre-stress of 75% UCS is still 57.64% higher than that of the specimen without pre-stress.
Figure 10 depicts variations in dynamic elastic modulus and peak strain versus pre-stress. The tangent modulus is defined as the dynamic elastic modulus of the specimen, which is the slope of a straight line segment or an approximate straight line segment in the dynamic stress–strain curve, and the strain at dynamic peak strength is defined as the dynamic peak strain. With the increase in pre-stress, the dynamic elastic modulus has the same change trend as the combined strength. The maximum value is 46.03 GPa at the pre-stress of 55% UCS, which is 60.89% higher than that of the specimen without pre-stress. However, the dynamic peak strain decreases with the increase in pre-stress. Especially, when the pre-stress ranges from 0 to 55% UCS, the dynamic peak strain seems to decrease linearly as the pre-stress increases, which is due to the elastic deformation during this stage. According to the second strength theory [1], the critical strain of material controls its failure. The static pre-stress exerting on the rock specimen induces the initial static strain. The greater the static pre-stress, the larger the initial static strain of rock, which results in a descending trend of dynamic peak strain.

Influence of pre-stress on dynamic elastic modulus and peak strain
The above results show that the pre-stress has dual effects on mechanical behavior of granite specimen. When it is at a lower level, the ability of the specimen to bear the combined loads and its stiffness increase sharply, which can be considered as the enhancing effect of the axial pre-load on rock [33]. However, the enhancing effect is limited and gradually decreases with the increase in pre-stress. As the pre-stress exceeds the critical value (55% UCS in this study), the weakening effect emerges, resulting in the decrease of strength and elastic modulus. This phenomenon is consistent with the previous researches on siltstone [33] and sandstone [63]. The transition mechanism of the effect of the axial pre-stress can be revealed by the elastic deformation limit under uniaxial compression (see Fig. 4).
When no axial pre-stress exerts on the rock specimen, the compressive stress wave will be reflected as a tensile wave on the surface of the initial micro-cracks, driving the crack propagation, especially for the crack with a perpendicular direction to the axial load [21]. When the axial pre-stress value reaches the elastic deformation stage (25–55% of UCS), the initial micro-cracks will be closed entirely, and thus the stress wave can be transmitted through the closed crack without reflection, which greatly inhibits the deterioration of rock material [33, 63]. In addition, the crack closure reduces the porosity of rock specimen, which enhances the deformation resistance of the specimen [11]. That is why the strength and elastic modulus of rock specimens are significantly improved under the pre-stress of 25–55% UCS. However, as the axial static load exceeds the elastic deformation limit of the rock, i.e., the crack initiation stress threshold, the closed initial cracks will open again and slide along the crack surface, and the secondary cracks will be generated at crack tips under greater pre-stress, which provides abundant reflected surfaces for the stress wave, further promoting crack propagation, nucleation and coalescence under dynamic loading. The intense crack density in the rock dramatically deteriorates its mechanical properties, which is the reason why the dynamic strength and elastic modulus of the specimen are the weakest under the pre-stress of 75% UCS.
4.4 Full-field strain and fracture analysis
In this study, special attentions are paid to the fracture process around rectangular holes under coupled static and dynamic loads. During the test, LS and HS cameras were used to record the static pre-load and dynamic load process of specimens respectively, and then the captured images were post-processed by the VIC-2D software. Table 4 summarizes the major principal strain fields. The relative stress level at each stage is calculated by normalizing the respective stress level when those particular cracks develop, with the peak stress. The relative stress level and its corresponding time are reported below every image. In addition, the crack modes are marked on the final image, where T represents tensile crack; S represents shear crack; TS represents a mixture of tensile crack and shear crack and B represents rock ejection or bursting.
4.4.1 Specimen under pure dynamic load
As can be seen from Table 4, for the specimen under pure dynamic load, i.e., the static pre-stress is 0% UCS, when the dynamic stress reaches 61.19% of the peak value, tensile cracks first initiate from the roof and the corner of the holes due to local tensile stress concentration [51]. The initiation position of the cracks is similar to that of the specimen under static uniaxial compression (Fig. 5), but the corresponding crack initiation stress level and the strain value are higher than that under static compression. Subsequently, with the increase in dynamic load, more secondary cracks are generated at the hole corners, and propagate to the ends of the specimen along the loading direction. After the peak stress, two remote tensile cracks appear in the middle of ends of the specimen, and the middle rock bridge is finally penetrated by the coalescence of them. However, there is no crack coalescence between the two holes, which is consistent with the results observed by Zhou et al. [65]. Notably, compared with the static compression results, the failure of rock structure under dynamic load is also mainly caused by secondary crack propagation, but the difference is that the specimen under dynamic load is tensile failure, excluding shear cracks, which is quite different from the dynamic failure dominated by shear cracks around crack-like flaws [23, 31, 71, 72].
4.4.2 Specimen under coupled loads
For the specimen under coupled static and dynamic loads, previous studies have paid little attention to the deformation and damage of specimen under pre-stress. However, in this study, through the joint application of LS camera and DIC technique, the major principal strain fields on specimen surface under pre-stress are obtained. It can be seen from Table 4 that the specimens have undergone varying degrees of deformation and damage under different pre-stress levels compared with the specimen without pre-stress. With the increase in pre-stress, the number of cracks and the value of strain localizations on the specimen surface increases. Especially when the pre-stress is 75% UCS, the crack density and damage degree increase greatly, which proves that the dynamic strength of rock with high pre-stress will decrease under the dynamic load. Furthermore, the cracks mainly initiate from the roof and floor of the holes, and propagate parallel to the loading direction in the form of tensile cracks, which strongly indicates that tensile cracks do appear earlier than shear cracks under coupled loads, since the tensile strength of the test granite is about a sixteenth of its compressive strength. It is noteworthy that, under the same static stress level, the damage and crack extent of specimens under pre-stress are more severe than that under uniaxial compression. This is mainly due to the fact that the loading rate loaded by the axial static pressure device of SHPB system is not constant, and the stiffness of the SHPB system is lower than that of MTS-322 servo-hydraulic material testing machine, which reduces the apparent strength of the rock specimen [33].
Through careful observation, it is found that compared with the specimen under pure dynamic load, the tensile cracks initiated from the roof and floor of the holes under the static pre-stress almost disappear during the dynamic load process and will not further expand into macro fractures. In addition, the final failure of the specimen under coupled loads is also caused by the initiation and propagation of secondary cracks at the corners of the holes, but the mode of cracks around the holes tends to shear with the increase in pre-stress, which agrees with the previous researches [30, 50]. For instance, under the static pre-stress of 55% UCS, tensile cracks initiated from the roof and floor of the holes have propagated to a certain distance. However, when the dynamic stress reaches 52.30% of the peak value, there are no obvious tensile cracks characterized by high strain zones around the holes. When the dynamic stress increases to 93.61% of the peak, a pair of strain localized bands first concentrate at the upper corners of the upper hole, and then strain localizations with low intensity also appear at the other corners and the sidewalls of the holes as the stress reaches its peak.
In the post-peak stage, the strain localization zones around the holes further concentrate, and an inclined shear band emerges at the lower left corner of the lower hole where compression-shear stress concentrates. When the dynamic stress drops to 67.54% of the peak, the overall strain distribution on the rock surface evolves into compressive strain, and only high strains concentrate on the sidewalls of the holes. At this time, the strain localized bands at the upper corners of the upper hole incline to the upper end of the specimen, forming TS cracks composed of tensile cracks and shear cracks [50]. Finally, with the growth of two macro TS cracks and one macro shear crack towards the loading ends, the specimen is penetrated by them and loses its structure integrity. Meanwhile, the strain energy accumulated in the middle rock bridge and the sidewalls of the openings are rapidly released, resulting in sidewall extensive fracturing and the ejection of rock fragments.
By comparison, it is found that as the increase in pre-stress, the localization degree of high strain zones around the holes increases after the dynamic peak stress, and tends to concentrate on the sidewalls of the holes, resulting in more severe rock bursting and extensive fracturing. Therefore, the influence of dynamic disturbance should be considered in the design of support and reinforcement systems of deep underground structures. In addition, due to the effect of pre-stress, the failure of the specimen under coupled static and dynamic loads is dominated by shear cracks. The difference is that under the pre-stress of 25–55% UCS, the failure of the middle rock bridge is caused by shear coalescence inside the bridge area, while under the pre-stress of 75% UCS, it is the indirect coalescence outside the bridge area with a U shape.
4.5 Energy evolution characteristics
Under coupled static and dynamic loads, the energy evolution of specimens can be divided into two stages according to the loading mode: The first stage is the static pre-load stage. In this stage, the specimen is deformed by axial pre-load, and the work done by the pre-load is mainly transformed into strain energy \({E}_{S}\) stored in rock, which can be calculated according to Eq. (5).
The second stage is the dynamic load stage. In the process of stress wave propagation, the original static pre-stress and dynamic impact stress are coupled to work on the specimen and destroy it. Among them, a part of energy is dissipated in the form of reflected wave and transmitted wave, and even some energy is dissipated in the form of rock ejection, acoustic emission, electromagnetic radiation, etc., which can be negligible in this study because it is relatively small and cannot be effectively calculated.
When the energy of the static pre-load acting on the specimen is not considered, using the one-dimensional stress wave theory and the results from the SHPB tests, the incident energy \({E}_{\mathrm{I}}\), the reflected energy \({E}_{\mathrm{R}}\), the transmitted energy \({E}_{\mathrm{T}}\), the absorbed energy \({E}_{\mathrm{A}}\) and the energy absorption ratio \({R}_{\mathrm{A}}\) in the rock failure process under dynamic load are expressed as follows [37]:
where \({\sigma }_{\mathrm{I}}(t)\), \({\sigma }_{\mathrm{R}}(t)\) and \({\sigma }_{\mathrm{T}}(t)\) are the incident, reflected and transmitted stress at time t, respectively and \({\rho }_{\mathrm{e}}{C}_{\mathrm{e}}\) is the wave impedance of the bars.
When considering the energy of the static pre-load acting on the specimen, the combined absorption energy \({E}_{\mathrm{CA}}\) and combined energy absorption ratio \({R}_{\mathrm{CA}}\) of the specimen under coupled loads are calculated as follows:
The calculated results of energy properties of specimens under coupled static and dynamic loads are listed in Table 5. Among them, the energy absorption ratio \({R}_{A}\) of rock represents the effective energy utilization of rock fragmentation when a stress wave propagates across the rock [12], and the combined energy absorption ratio \({R}_{CA}\) represents the effective utilization ratio of energy input jointly by static pre-load and dynamic load for rock deformation and fracture.
The \(R_{{\text{A}}}\) and \(R_{{{\text{CA}}}}\) of specimens with different pre-stresses under dynamic load are plotted in Fig. 11. It can be seen that, \(R_{{\text{A}}}\) and \(R_{{{\text{CA}}}}\) increase slightly with the increase in pre-stress from 0 to 25% UCS, which means that the rock rupture primarily absorbs external impact energy. However, when the pre-stress increases from 25 to 75% UCS, \(R_{{\text{A}}}\) and \(R_{{{\text{CA}}}}\) decrease rapidly, indicating that the utilization rate of impact energy involved in rock failure is low when the pre-stress is at a high level. In addition, at each pre-stress level, \(R_{{{\text{CA}}}}\) is always higher than \(R_{{\text{A}}}\). Especially when the pre-stress is 75% UCS, the \(R_{{{\text{CA}}}}\) is 15.67% and the \(R_{A}\) is −1.53%, which means that the failure of specimen with high pre-stress under dynamic load does not need to absorb energy, but releases the strain energy stored in itself. The main function of dynamic load is to trigger the rapid release of strain energy stored in rock specimens, and the kinetic energy of the rock fragments ejected from the sidewall is mainly derived from the strain energy input by pre-stress, which is similar to triggered rock burst in deep rock engineering.

Energy absorption ratio and combined energy absorption ratio of specimens with different pre-stress levels
Figure 12 presents the dynamic stress curve and energy evolution of specimens with different pre-stress under dynamic load. For the specimen under pure dynamic load, the evolution behavior of absorbed energy can be mainly divided into three stages (see Fig. 12a): non-linear stage, where the slowly increasing energy is mainly used for the stable growth of pre-existing micro-cracks inside the rock; linear stage, where energy accumulates rapidly to promote the nucleation, propagation and coalescence of new cracks; platform stage, where the dominated macro cracks have been formed, and thus the energy remains unchanged with the increase in time. For pre-stressed specimens, it can be seen from Fig. 12(b)-(d) that the evolution curves of absorbed energy increase first and then decrease with the time, and the decreasing magnitude and speed increase with the increase in pre-stress, even negative value occurs under the pre-stress of 75% UCS, which demonstrates again that the failure of rock with high pre-stress under dynamic load is mainly caused by the rapid release of strain energy stored in the rock. In contrast, the increasing magnitude and cumulative speed of the reflected energy increase greatly as the pre-stress exceeds 55% UCS, which is mainly because the pre-stress of 75% UCS far exceeds the elastic deformation limit of rock, thus forming potential shear planes and numerous micro-cracks in rock [63]. Once they are activated by the stress wave, a small part of stored strain energy is dissipated for crack development, while the remaining part is mainly reflected into the elastic bar as reflected energy.

Dynamic stress-time curves and energy evolutions of specimens with different pre-stresses under dynamic load: a 0% UCS; b 25% UCS; c 55% UCS; d 75% UCS
5 Implications for deep rock engineering
As the rock excavation goes deep, the stress environment for deep rock engineering is no longer a single static or dynamic stress state, but a complex stress state, i.e., coupled static and dynamic loading state. The test results in this study can provide some insights into the engineering design and disaster prevention for deep rock engineering.
5.1 Deep rock engineering design
In this study, the strength, stiffness and the crack initiation stress level of granite specimen under dynamic load are higher than that under static load. Therefore, the traditional design and construction of rock engineering based on the static mechanical properties of rock have relatively conservative safety, but may not be suitable for deep rock engineering applications. The experimental results reveal that when the static pre-stress exceeds the elastic deformation limit (55% UCS), the dynamic strength and elastic modulus of granite specimen decrease with the increase in pre-stress. Especially when the pre-stress reaches the crack damage value (75% UCS), the dynamic strength of rock is lower than that under pure dynamic load, and it may even be lower than its static strength with the further increase in pre-stress [63]. On the other hand, the observation of the failure process shows that with the increase in pre-stress, the sidewalls of the openings are more prone to severe rock bursting and extensive fracturing under dynamic load, which indicates that the support structure such as rock pillars are more vulnerable to dynamic disturbance when they are at greater buried depth. Obviously, it is dangerous to continue to adopt the static mechanical properties as the only reference for deep rock engineering design. Therefore, it is necessary to establish a new standard to consider the coupled static-dynamic loads effect in the support design and construction of highly stressed underground structures.
5.2 Failure pattern identification of rock pillar at different depths
Most researchers studied the failure mechanism of large-scale engineering rock structures through numerical simulation [19, 24, 38, 49] or physical model test [28, 42, 70]. However, some researchers also used small-scale rock specimens to simulate the mechanical response of underground pillars in laboratory tests [5, 13, 64]. In this paper, since the static or dynamic load is applied axially on the specimen, it can be roughly considered that the middle rock bridge reserved between the two rectangular holes is subjected to axial static or dynamic compression, which can be verified by comparing the failure modes of the middle rock bridge and the intact specimen under static or dynamic loading. To a certain extent, it may provide some explanation and reference for the failure characteristics of underground rock pillars by observing the failure modes of the middle rock bridge in the specimen under different stress states [22]. The failure process of rock structures is the result of the combined effects of the strain energy stored in rock and the external dynamic disturbance. Therefore, according to the level of the strain energy input by static pre-stress, from low to high, and the analysis of failure pattern, the failure of rock pillar in underground engineering are divided into the following categories:
-
(1)
The rock pillar at shallow depth can be considered to be in the state of no pre-stress or low pre-stress, and very low strain energy is stored in rock. If the rock is to be broken, it must absorb external energy, and thus the energy absorption ratio under pure dynamic load is at a relatively high level (see Fig. 11). When the incident energy of dynamic load is large enough, splitting failure caused by the propagation and coalescence of tensile cracks occurs in the pillar, which is consistent with the failure mode of hard rock pillars summarized by Li et al. [27] (Fig. 13a). In addition, high-speed ejection of rock fragments may be found from the sidewalls or corners of the pillar, in which the kinetic energy of the flying fragments mainly comes from the external dynamic load.
Fig. 13 
Failure modes of mine pillars summarized by Li et al. [27]
-
(2)
The rock pillar at moderate depth can be considered that the pre-stress lies in the elastic deformation stage or the initial stable crack growth stage. In this condition, the strain energy stored in rock is high, but it is still not enough for crack propagation and coalescence. When the incident energy is input from dynamic disturbance, splitting fractures occur first at and near the pillar wall, and then superficial damage (i.e., rock bursting and extensive fracturing) starts at the wall and develops inwards forming arch-shaped surfaces, eventually leading to the pillar failure induced by the internal coalescence of shear planes. According to Li et al. [27], it is the most commonly seen failure mode of underground rock pillars (Fig. 13b). This kind of pillar failure was also observed by Esterhuizen et al. [8] in the underground rock pillars of the Eastern and Midwestern United States. As shown in Fig. 14a, the rock pillar failed and finally formed an hourglass shape due to rib spalling. In addition, based on the underground investigation by Zvarivadza and Sengani [45], it was found that all the in-stope pillars that were located closer to the source of the seismic events were associated with extensive scaling, pillar bursts, extensive fracturing and pillar budging along the full length, height and widths of the pillar, an there was also a significant amount of broken rocks, both large and small in size (Fig. 15). In this failue process, a part of impact energy is released as the kinetic energy of rock fragments bursting out from the free surfaces of the pillar, which can be defined as the induced rock burst [7]. Although some energy is released by the rock burst, the absorbed energy of rock from the dynamic disturbance is greater than the energy released from itself, so it shows positive finally (Fig. 12c).
Fig. 14 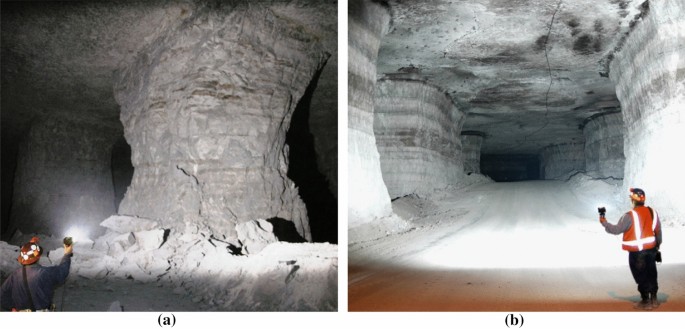
Failure modes of underground rock pillars observed by Esterhuizen et al. [8]: a Typical hourglass shaped pillar; b Pillars at deeper stone mines
Fig. 15 
Damage and failure modes of rock pillars after seismic events [45]
-
(3)
The rock pillar at ultra-deep depth can be considered that the pre-stress lies in the unstable crack propagation stage, with large rock deformation and considerable strain energy storage. Because the pre-stress exceeds the crack damage value, a large number of micro-cracks and potential shear planes are developed in rock, and the rock structure is on the brink of collapse [63]. In one case, once a pulse wave activates the internal cracks, the rock failure is caused by releasing the strain energy stored in itself rather than absorbing the external energy (Fig. 11). A small part of the stored strain energy is dissipated for crack propagation and coalescence, and most of it is released as the kinetic energy of rock fragments, which can be defined as the triggered rock burst [48]. In another case, once the in-situ stress exceeds the UCS of rock, or the rock performance is deteriorated by groundwater, weathering and other factors [2], the rock pillar becomes unstable. Minor spalling results in concave pillar ribs (Fig. 14b), and eventually shear failure caused by the potential shear planes in pillar occurs.


6 Conclusions
-
(1)
Under the same dynamic load, the strength and elastic modulus of granite specimen increase first and then decrease with the increase in pre-stress, which is closely related to the elastic deformation limit of rock. When the pre-stress lies in the elastic deformation stage, the moderate axial pre-stress has obvious enhancing effect on rock due to crack closure. However, the weakening effect emerges as the pre-stress exceeds the elastic deformation limit due to crack growth and coalescence. Besides, the dynamic peak strain of specimen decreases with the increase in pre-stress, which is due to the greater pre-stress induces larger initial static strain.
-
(2)
The damage caused by pre-stress has a certain effect on the dynamic crack mode of rock. However, no matter under static, dynamic or coupled loads, initial tensile cracks first initiate from the roof and floor of the hole where tensile stress concentrates, and the failure of the specimen is caused by the growth of secondary cracks at hole corners. Different from mixed tensile-shear failure under static load and splitting failure under dynamic load, the failure pattern of specimens under coupled loads is dominated by shear cracks. In addition, four coalescence modes between two rectangular holes were summarized: diagonal shear coalescence under static load, no coalescence under dynamic load, shear coalescence inside the bridge area under the pre-stress of 25–55% UCS, and indirect coalescence outside the bridge area under the pre-stress of 75% UCS.
-
(3)
The energy evolution feature of specimen under dynamic load can be divided into three stages, but it is more complex for the specimens under coupled loads and it is distinctly influenced by the pre-stress. With the increase in pre-stress from 0 to 25% UCS, the energy absorption ratio increases slightly, and then decreases rapidly with the further increase in pre-stress, even negative value occurs under the pre-stress of 75% UCS, which means that the failure of highly pre-stressed specimen under dynamic disturbance does not need to absorb external energy, but releases the strain energy stored in itself. It is observed that with the increase in pre-stress, the strain localization degree increases and tends to concentrate on the sidewalls, and the sidewalls are more prone to severe rock ejection and bursting, in which the source of kinetic energy of the flying fragments changes from the external dynamic load to internal strain energy with pre-stress.
-
(4)
Based on the analysis of the test results of granite specimens with double rectangular holes under solely static, dynamic load and coupled loads, some implications and insights are provided for rock engineering applications, including deep rock engineering design and failure pattern identification of rock pillar at different depths. It is noted that these conclusions are based on specific granite specimens at small scale. Similar dynamic disturbance tests will be further carried out for middle-large scale rock or rock-like model under high pre-stress to enhance the observations.
References
Brown ET (1981) Fundamentals of rock mechanics. Tectonophysics 38:367–368
Cai X, Zhou ZL, Du XM (2020) Water-induced variations in dynamic behavior and failure characteristics of sandstone subjected to simulated geo-stress. Int J Rock Mech Min Sci 130:104339
Cao RH, Cao P, Lin H, Pu C, Ou K (2016) Mechanical behavior of brittle rock-like specimens with pre-existing fissures under uniaxial loading: experimental studies and particle mechanics approach. Rock Mech Rock Eng 49:763–783
Carter BJ, Lajtai EZ, Yuan Y (1992) Tensile fracture from circular cavities loaded in compression. Int J Fracture 57(3):221–236
Chen ZH, Tang CA, Huang RQ (1997) A double rock sample model for rockbursts. Int J Rock Mech Min Sci 34:991–1000
Dai F, Huang S, Xia KW, Tan Z (2010) Some fundamental issues in dynamic compression and tension tests of rocks using split Hopkinson pressure bar. Rock Mech Rock Eng 43:657–666
Deng J, Gu DS (2018) Buckling mechanism of pillar rockbursts in underground hard rock mining. Geomech Geoeng 13:168–183
Esterhuizen GS, Dolinar DR, Ellenberger JL (2011) Pillar strength in underground stone mines in the United States. Int J Rock Mech Min Sci 48:42–50
Feng P, Dai F, Liu Y, Xu NW, Fan PX (2018) Effects of coupled static and dynamic strain rates on mechanical behaviors of rock-like specimens containing pre-existing fissures under uniaxial compression. Can Geotech J 55:640–652
Hajiabdolmajid V, Kaiser PK, Martin CD (2002) Modelling brittle failure of rock. Int J Rock Mech Min Sci 39:731–741
Hamiel Y, Lyakhovsky V, Agnon A (2004) Coupled evolution of damage and porosity in poroelastic media: theory and applications to deformation of porous rocks. Geophys J Int 156:701–713
Han ZY, Li DY, Zhou T, Zhu QQ, Ranjith PG (2020) Experimental study of stress wave propagation and energy characteristics across rock specimens containing cemented mortar joint with various thicknesses. Int J Rock Mech Min Sci 131:104352
He MC, Zhao F, Cai M, Du S (2015) A novel experimental technique to simulate pillar burst in laboratory. Rock Mech Rock Eng 48:1833–1848
Horii H, Nemat-Nasser S (1985) Compression-induced microcrack growth in brittle solids: axial splitting and shear failure. J Geophys Res 90:3105–3125
Huang CC, Yang WD, Duan K, Fan LD, Wang L, Bo CJ (2019) Mechanical behaviors of the brittle rock-like specimens with multi-nonpersistent joints under uniaxial compression. Constr Build Mater 220:426–443
Huang YH, Yang SQ, Hall MR, Tian WL, Yin PF (2018) Experimental study on uniaxial mechanical properties and crack propagation in sandstone containing a single oval cavity. Arch Civ Mech Eng 18:1359–1373
Huang YH, Yang SQ, Tian WL (2019) Cracking process of a granite specimen that contains multiple pre-existing holes under uniaxial compression. Fatigue Fract Eng Mater Struct 42:1341–1356
Jeon S, Kim J, Seo Y, Hon C (2004) Effect of a fault and weak plane on the stability of a tunnel in rock-a scaled model test and numerical analysis. Int J Rock Mech Min Sci 41:486–486
Kaiser PK, Tang CA (1998) Numerical simulation of damage accumulation and seismic energy release during brittle rock failure-Part II: Rib pillar collapse. Int J Rock Mech Min Sci 35:123–134
Lajtai EZ, Lajtai VN (1975) The collapse of cavities. Int J Rock Mech Min Sci Geomech Abstr 12:81–86
Li XB (2014) Rock dynamics: fundamentals and applications. Science, Beijing
Li XB, Gong FQ, Tao M, Dong LJ, Du K, Ma CD et al (2017) Failure mechanism and coupled static-dynamic loading theory in deep hard rock mining: A review. J Rock Mech Geotech Eng 9:767–782
Li DY, Han ZY, Sun XL, Zhou T, Li XB (2018) Dynamic mechanical properties and fracturing behavior of marble specimens containing single and double flaws in SHPB tests. Rock Mech Rock Eng 52:1623–1643
Li X, Konietzky H (2015) Numerical simulation schemes for time-dependent crack growth in hard brittle rock. Acta Geotech 10:513–531
Li XB, Li CJ, Cao WZ, Tao M (2018) Dynamic stress concentration and energy evolution of deep-buried tunnels under blasting loads. Int J Rock Mech Min Sci 104:131–146
Li XB, Lok TS, Zhao J (2005) Dynamic characteristics of granite subjected to intermediate loading rate. Rock Mech Rock Eng 38:21–39
Li CL, Prikryl R, Nordlund E (1998) The stress-strain behaviour of rock material related to fracture under compression. Eng Geol 49:293–302
Li XB, Qiu JD, Zhao YZ, Chen ZH, Li DY (2020) Instantaneous and long-term deformation characteristics of deep room-pillar system induced by pillar recovery. Trans Nonferrous Met Soc China 30:2775–2791
Li H, Wong LNY (2012) Influence of flaw inclination angle and loading condition on crack initiation and propagation. Int J Solids Struct 49:2482–2499
Li DY, Xiao P, Han ZY, Zhu QQ (2020) Mechanical and failure properties of rocks with a cavity under coupled static and dynamic loads. Eng Fract Mech 225:106195
Li XB, Zhou T, Li DY (2017) Dynamic strength and fracturing behavior of single-flawed prismatic marble specimens under impact loading with a split-Hopkinson pressure bar. Rock Mech Rock Eng 50:1–16
Li XB, Zhou T, Li DY, Wang ZW (2016) Experimental and numerical investigations on feasibility and validity of prismatic rock specimen in SHPB. Shock Vib 2016:1–13
Li XB, Zhou ZL, Lok TS, Hong L, Yin TB (2008) Innovative testing technique of rock subjected to coupled static and dynamic loads. Int J Rock Mech Min Sci 45:739–748
Li DY, Zhu QQ, Zhou ZL, Li XB, Ranjith PG (2017) Fracture analysis of marble specimens with a hole under uniaxial compression by digital image correlation. Eng Fract Mech 183:109–124
Lin QB, Cao P, Cao RH, Lin H, Meng JJ (2020) Mechanical behavior around double circular openings in a jointed rock mass under uniaxial compression. Arch Civ Mech Eng 20:1–18
Lin P, Wong RHC, Tang CA (2015) Experimental study of coalescence mechanisms and failure under uniaxial compression of granite containing multiple holes. Int J Rock Mech Min Sci 77:313–327
Lundberg B (1976) A split Hopkinson bar study of energy absorption in dynamic rock fragmentation. Int J Rock Mech Min Sci Geomech Abstr 13:187–197
Muaka JJM, Duma S, Mushangwe P, Gardner L, Chindedza T, Walls J, Joughin WC (2017) Modelling hard rock jointed pillars using a distinct element and discrete fracture network approach considering the effect of a clay-filled shear structure. Proceed Eighth Int Conf Deep High Stress Min: Aust Centre Geomech 2017:311–328
Niu Y, Zhou XP, Berto F (2020) Evaluation of fracture mode classification in flawed red sandstone under uniaxial compression. Theor Appl Fract Mech 107:102528
Nolen-Hoeksema RC, Gordon RB (1987) Optical detection of crack patterns in the opening-mode fracture of marble. Int J Rock Mech Min Sci Geomech Abstr 24:135–144
Ortlepp WD (2001) The behaviour of tunnels at great depth under large static and dynamic pressures. Tunn Undergr Sp Technol 16:41–48
Qiu JD, Li XB, Li DY, Zhao YZ, Hu CW, Liang LS (2020) Physical model test on the deformation behavior of an underground tunnel under blasting disturbance. Rock Mech Rock Eng. https://doi.org/10.1007/s00603-020-02249-2
Sagong M, Bobet A (2002) Coalescence of multiple flaws in a rock-model material in uniaxial compression. Int J Rock Mech Min Sci 39:229–241
Sammis CG, Ashby MF (1986) The failure of brittle porous solids under compressive stress states. Acta Metall 34:511–526
Sengani F (2018) The performance of bolt-reinforced and shotcreted in-stope pillar in a rockburst prone areas. Int J Mining Geo-Eng 52(2):105–117
Sutton MA, Orteu JJ, Schreier H (2009) Image correlation for shape, motion and deformation measurements. Springer, New York
Tang CA, Wong RHC, Chau KT, Lin P (2005) Modeling of compression-induced splitting failure in heterogeneous brittle porous solids. Eng Fract Mech 72:597–615
Wang SF, Huang LQ, Li XB (2020) Analysis of rockburst triggered by hard rock fragmentation using a conical pick under high uniaxial stress. Tunn Undergr Sp Tech 96:103195
Wang SY, Sloan SW, Huang ML, Tang CA (2011) Numerical study of failure mechanism of serial and parallel rock pillars. Rock Mech Rock Eng 44:179–198
Weng L, Li XB, Taheri A, Wu QH, Xie XF (2018) Fracture evolution around a cavity in brittle rock under uniaxial compression and coupled static-dynamic loads. Rock Mech Rock Eng 51:531–545
Weng L, Wu ZJ, Li XB (2018) Mesodamage characteristics of rock with a pre-cut opening under combined static-dynamic loads: A nuclear magnetic resonance (NMR) investigation. Rock Mech Rock Eng 51:2339–2354
Wong RHC, Chau KT (1998) Crack coalescence in a rock-like material containing two cracks. Int J Rock Mech Min Sci 35:147–164
Wong LNY, Einstein HH (2009) Crack coalescence in molded gypsum and carrara marble: part I-macroscopic observations and interpretation. Rock Mech Rock Eng 42:475–511
Wong LNY, Einstein HH (2009) Systematic evaluation of cracking behavior in specimens containing single flaws under uniaxial compression. Int J Rock Mech Min Sci 46:239–249
Wu H, Zhao GY, Liang WZ (2019) Mechanical response and fracture behavior of brittle rocks containing two inverted U-shaped holes under uniaxial loading. Appl Sci 9:5327
Zhu QQ, Ma CD, Li XB, Li DY (2021) Effect of filling on failure characteristics of diorite with double rectangular holes under coupled static–dynamic loads. Rock Mech Rock Eng. https://doi.org/10.1007/s00603-021-02409-y
Xing HZ, Zhang QB, Ruan D, Dehkhoda S, Lu GX, Zhao J (2018) Full-field measurement and fracture characterisations of rocks under dynamic loads using high-speed three-dimensional digital image correlation. Int J Impact Eng 113:61–72
Yang SQ (2011) Crack coalescence behavior of brittle sandstone samples containing two coplanar fissures in the process of deformation failure. Eng Fract Mech 78:3059–3081
Yang SQ, Huang YH, Tian WL, Zhu JB (2017) An experimental investigation on strength, deformation and crack evolution behavior of sandstone containing two oval flaws under uniaxial compression. Eng Geol 217:35–48
Yang SQ, Jing HW (2011) Strength failure and crack coalescence behavior of brittle sandstone samples containing a single fissure under uniaxial compression. Int J Fracture 168:227–250
Zhang QB, Zhao J (2013) Effect of loading rate on fracture toughness and failure micromechanisms in marble. Eng Fract Mech 102:288–309
Zhang QB, Zhao J (2014) A review of dynamic experimental techniques and mechanical behaviour of rock materials. Rock Mech Rock Eng 47:1411–1478
Zhou ZL, Cai X, Li XB, Cao WZ, Du XM (2019) Dynamic response and energy evolution of sandstone under coupled static–dynamic compression: insights from experimental study into deep rock engineering applications. Rock Mech Rock Eng 53(3):1305–1331
Zhou ZL, Chen L, Zhao Y, Zhao TB, Cai X, Du XM (2017) Experimental and numerical investigation on the bearing and failure mechanism of multiple pillars under overburden. Rock Mech Rock Eng 50:995–1010
Zhou ZL, Tan LH, Cao WZ, Zhou ZY, Cai X (2017) Fracture evolution and failure behaviour of marble specimens containing rectangular cavities under uniaxial loading. Eng Fract Mech 184:183–201
Zhou YX, Xia KW, Li XB, Li HB, Ma GW, Zhao J, Zhou ZL, Dai F (2012) Suggested methods for determining the dynamic strength parameters and mode-I fracture toughness of rock materials. Int J Rock Mech Min Sci 49:105–112
Zhu TT, Jing HW, Su HJ, Yin Q, Du M (2015) Mechanical behavior of sandstone containing double circular cavities under uniaxial compression. Chin J Geotech Eng 37:1047–1056
Zhu QQ, Li DY (2020) Experimental investigation on crack behavior and stress thresholds of sandstone containing a square inclusion under uniaxial compression. Appl Sci 10(21):7621
Zhu QQ, Li DY, Han ZY, Li XB, Zhou ZL (2019) Mechanical properties and fracture evolution of sandstone specimens containing different inclusions under uniaxial compression. Int J Rock Mech Min Sci 115:33–47
Zhou ZL, Chen L, Cai X, Shen BT, Zhou J, Du K (2018) Experimental investigation of the progressive failure of multiple pillar-roof system. Rock Mech Rock Eng 51:1629–1636
Zou C, Wong LNY (2014) Experimental studies on cracking processes and failure in marble under dynamic loading. Eng Geol 173:19–31
Zou C, Wong LNY, Jin JL, Gan BS (2016) Different mechanical and cracking behaviors of single-flawed brittle gypsum specimens under dynamic and quasi-static loadings. Eng Geol 201:71–84
Acknowledgments
The work was financially supported by the National Natural Science Foundation of China (No. 52074349, 51474250), the Distinguished Youth Science Foundation of Hunan Province of China (No. 2019JJ20028) and the Fundamental Research Funds for the Central Universities of Central South University (No. 2019zzts884).
Author information
Authors and Affiliations
Corresponding author
Ethics declarations
Conflict of interest
The authors declare that they have no conflict of interest.
Additional information
Publisher's Note
Springer Nature remains neutral with regard to jurisdictional claims in published maps and institutional affiliations.
Rights and permissions
About this article

Cite this article
Zhu, Q., Li, D., Han, Z. et al. Failure characteristics of brittle rock containing two rectangular holes under uniaxial compression and coupled static-dynamic loads. Acta Geotech. 17, 131–152 (2022). https://doi.org/10.1007/s11440-021-01196-8
Received:
Accepted:
Published:
Issue Date:
DOI: https://doi.org/10.1007/s11440-021-01196-8