
Abstract
Nowadays, a wide range of enterprises are faced with big data processing in different domains such as transaction operations, business calculations and analytical computations. Large-scale computing is an approach for big data processing. Due to the cost of large-scale computing and limitations of enterprise budgets, it is hardly possible to process all the input data and therefore the Quality of Result (QoR) may be affected. SAIR is an approach to improve QoR of big data processing for aggregative usages based on significance variety when there is a budget constraint. In this paper, the most significant data portions have been assigned to the most efficient resources in terms of time and cost. If the budget is still available, other data portions have been assigned to remaining resources. In this approach, statistical methods and a sampling technique with a 95% of the confidence interval and 5% of error margin are used to identify the most and least significant data portions. By using this method, the users are able to improve QoR with respect to budget constraint and preferred finishing time. In the evaluation phase, applications from different domains such as document and text, transaction data and system logs are used. Our results indicate that SAIR improves QoR while meeting budget constraint for considered usages. This approach improves the QoR up to 15%, compared with the state of the art.
1 Introduction
Quality of Result is a key concern in big data processing. One of the solutions for big data processing is warehouse scale processing in data center [1, 2]. Since a huge capacity of large-scale computing is required for big data processing, the cost of big data processing is of great value. Limitations of enterprise budgets may prevent them from processing all of the data and cause a reduction in QoR.
Aggregative applications are used widely in transaction operations, business calculations and analytical computations. An aggregative function is a function where some multiple values grouped together to form a single value, such as sum or average function. In this paper, we focus on aggregative applications and present an approach to improve QoR in big data processing in case of budget constraint and preferred finishing time.
In previous work [3], we have shown that various portions of data from one or different sources have various significance in determining the final outcome. In current paper, we offer an approach to overcome the limitation of budget/time and improve the QoR.
Some previous works have also addressed Quality of Result. The most important categories of them are as follows:
Improving QoR Some researchers have introduced frameworks to help the programmers and users for progressive analytics [4]. Our approach also is a framework to help improving QoR in big data processing. Approximate computing is a kind of computation that generates acceptable QoR using fewer resources such as time or cost [5]. CPU energy reduction with acceptable QoR is considered in [6] where the authors run less significant tasks on unreliable hardware and more significant ones on the most reliable hardware. Researchers in [7] have offered a framework for increasing QoR for cloud providers. Using hardware accelerators to improve QoR is discussed in [8, 9]. Some works find other techniques for increasing the QoR in big data processing [10]. Many prior researches tried to address the efficient resource management [11]. Definition of progress interval by data sampling is the main concept of [12]. Authors in [13] have changed the MapReduce architecture to generate an approximate result in a progressive manner. Similar to our research, some researchers have introduced frameworks to help the programmers and users in progressive analytics [4].
Resource allocation Resource allocation is one of the approaches used for increasing QoR and managing the processing cost [7, 14]. Our approach also assigns more significant data portions to the most efficient resource to increase QoR.
Approximation The approximation is a solution to increase the performance of big data processing. Authors in [5, 13, 15, 16] use approximation for big data processing. In these researches, a certain QoR is expected.
Code, task and variable variety Code, task and variable variety are considered in [17], and some techniques and tools have been introduced to detect the most significant portion of code and variable in output quality. Selecting desirable split of data for feeding the pipeline is considered in [13].
Nevertheless, the effect of significance variety of various portions of input data to improve QoR in case of budget limitation has not been previously explored. The input data consist of various data types from multiple resources. This fact leads to the different significance of various portions of data in the final result.
Based on the idea which is presented in paper [3], now we present “SAIR,” Significance-aware Approach to Improve quality of Result, which is an approach to improve QoR in case of budget constraint and preferred finishing time in big data processing. For this goal, more significant data portions have been assigned to the most efficient resource in terms of time and cost. If the budget is still available, other data portions have been assigned to existing resources.
As Fig. 1 depicts, the high-level design of SAIR consists of three main parts. In the first part, the Significance Measure is defined to judge the difference between data portions. Significance Measure should be defined based on the functionality of the application. We use Significance Measure to define the significance of each portion. In the second part, a sampling method is presented to determine the significance of each portion. In the third part, the data portions are assigned to the servers based on the budget/time constraint. Our algorithm estimates processing time and cost for each portion on the candidate server. The data portions are assigned to the servers, in such a way that, despite the time and budget constraints, the best quality of response is obtained. Finally, our approach is evaluated and is shown its performance in different application types.

SAIR overview
1.1 Challenges
There are important parts of our proposed approach. These parts are explained below.
Targeted applications Our proposed approach can manage the QoR of aggregative applications and other similar functions effectively. These applications calculate aggregate functions such as Average, Sum, Count, Ratio and some other statistical calculations. In this application type, different parts of input data are independent of each other. Due to this independency, sampling can be used to determine the significance of each data portion.
Significance determination This is the main part of our approach. Significance Measure is determined per application based on its functionality. To judge the different impacts of data portions on the final result, the Significance Measure must be properly defined.
Sampling method A kind of sampling method is used to reduce amount of data needed to be processed. For achieving a meaningful difference between portions, desirable portion size is determined.
QoR-aware allocation Finally, in the Allocation section, the data portions are assigned to the efficient resources in terms of cost and time. Based on the significance variety, the data portions must be allocated to proper servers. This allocation achieves maximum QoR and meets the constraints.
1.2 Evaluation
Applications from several domains are used for SAIR evaluation. Domains like document and text, transaction data, system logs and some others are used in our evaluations. Specifications and price of servers are obtained from Amazon EC2. Experiments are run on three types of machines, an Intel Core-i7 2 core CPU at 2.8 GHz with 2 GB of RAM, an Intel Core-i7 4 core CPU at 2.8 GHz with 4 GB of RAM and an Intel Core-i7 8 core CPU at 2.8 GHz with 8 GB of RAM.
In Sect. 5, representative experimental results for some of these applications have been presented. These results show that SAIR allows users to meet budget limitations in an acceptable finishing time and achieve a desirable QoR.
1.3 Contributions
In summary, the following contributions are made in this paper: (1) We propose a general set of mechanisms to improve QoR when having low budgets or finishing time limit, (2) we define the concept of “significance” for each application to illustrate the difference between data portions, (3) We define targeted applications for this approach based on their intra-data/program dependencies, (4) we benefit from different impact of various portions on the final result, and (5) via our experiments, we show that SAIR is applicable to many applications and it can significantly improve QoR when there is budget constraint.
1.4 Organization
The rest of the paper is organized as follows: Sect. 2 surveys the previous works. Section 3 presents some examples to show the motivation of research. Section 4 presents and discusses the SAIR approach. Section 5 shows the experimental results. Finally, the paper is concluded and future works are discussed in Sect. 6 and 7.
2 Related works
Improving QoR Similar to our work, some of the previous works have also focused on improving the Quality of Results. Approximate computing generates acceptable Quality of Result using less resources [5, 15]. Our approach also can provide a progressive approximation of result. By processing more significant data portions in the early steps, SAIR provides a fast approximation of the outcome. Authors in [18] have used sampling to overcome the resource limitation and have succeeded in improving Quality of Result. The authors in [19] have used an approximation to reduce computational requirements without significant reduction in Quality of Result. They have used their approach to compute scientific processing and have considered users preferences such as Quality of Result, Deadline and Budget. The authors in Sapprox [20] have noted the weakness of ApproxHadoop [15] and tried to offer a way to overcome it. They have used cluster sampling with unequal probability theory. It is very hard for users to define suitable Sampling Interval for the various condition of skew. Approaches and researches in approximate query processing are presented in [21]. BlinkDB [22] offers a solution to select samples for each query column set and uses samples to answer online queries in the distributed file system.
QoR-aware resource allocation Our approach has used a QoR-aware resource allocation algorithm for improving the QoR. Some of the previous works also have paid attention to this issue.
CPU energy reduction with acceptable Quality of Result is considered in [6]. Running less significant tasks on unreliable hardware and more significant ones on reliable hardware, with five benchmarks, had been evaluated. The benchmarks have different computational characteristics. In [23], the authors have performed a quantitative study of OS behavior on scale-out data center workloads, taking into account the interferences between micro-architecture and OS execution. This investigation has shown that the performance of data center workloads is significantly dominated by preemptive OS activities in contemporary OS design. Accordingly, the authors have recommended that multi-kernel structure with more local resource allocation could be a leading trend for future OS design. Detecting DDoS attack with URL counting is the main concept of [24]. The authors have shown the impact of different Hadoop clusters on the performance of the counter-based detector. Researchers in [7] also have offered a framework for Big Data Analytic Applications. This paper has presented an approach for maximizing resource utilization by assigning queries to existing VMs and reducing resource cost by executing queries on VMs with lower cost first. This approach reduces the load on expensive servers. The authors have recommended this approach to cloud providers and have predicted that their market share will be increased by using this method. Authors in [25] have described the Data Warehousing and Analytics Infrastructure at Facebook. Our approach has also focused on the challenge of the impact of Data Variety on the cost of big data processing. Actually, a limited number of studies exist in this area.
Authors in [26] consider the characteristics of data for resource allocation. In this article, input data consist of text, image, video and audio. Authors presented an approach for sampling and estimating the volume and velocity of various types of input data. Resources are allocated to input data based on its functionality and requirement. In our paper, aggregate applications have been considered and the impact of a variety of input data on the result has been evaluated. Variety that is one of the 4Vs of Big Data is considered in our paper. Authors in [26] showed that the allocation should be changed whenever data characteristics change in terms of type, volume or velocity. Our paper shows that the allocation should be changed whenever data characteristics change in terms of variety or source. The authors in [27] have considered a trade-off between the efficient resource allocation and the topology throughput. They have not considered the data variety in their work and their definition for throughput. Authors in [28] have presented a framework for obtaining and managing quality of answer for online data-intensive services. They first provide fast interactive result by processing data from available and fast components and then improve Quality of Result by processing other data. The authors in [29] have considered the differences between the Cloud job tasks. They also have considered the user’s demands and have increased the users’ satisfaction. The problem of imbalanced sub-datasets and inefficient sampling on sub-datasets over a Hadoop cluster has been investigated [30]. They have offered a solution to overcome the uneven sub-datasets distribution and balance workload among computational nodes. They have increased the performance of parallel data analysis.
Progressive processing Our solution has the ability to generate progressive results. There are other related researches in this area. Authors in [13] have changed the MapReduce architecture to generate an approximate result in a progressive manner. They have introduced Hadoop Online Prototype (HOP) that is the pipelined version of Hadoop. They have discussed the advantages and features of this framework in big data processing. Selecting desirable split of data for feeding the pipeline can increase the performance of this framework. Our research has focused on the selection of suitable data portions to utilize the servers and decrease the total cost and time of processing. Some works have focused on pruned large input data space, for example, dimension reduction for progressive processing [31,32,33]. Our approach also focuses on the impact of data variety on the outcome and therefore defines significance for each application. The authors in [34] have proposed the combination of both the approximate and incremental computing, in order to use the benefits from the two. Their approach relies on computing over a subset of data items instead of the entire dataset to achieve low latency and efficient cluster utilization. By this approach, the users can manage the budget and accuracy of their processing. Our approach also helps users to improve the QoR of their processing in case of time and budget limitations.
Definition of progress interval by data sampling is the main concept of [12]. By this approach, the authors have introduced a scalable progressive computation. Our approach uses sampling for ranking data portions to have more efficient allocations. None of the works mentioned has used significance variety for increasing Quality of Result. Similar to our research, some researchers have introduced the frameworks to help the programmers and users for progressive analytics [4]. Our proposed approach also is a framework to help the management of big data processing in terms of time, cost and performance.
Code and task variety Code, task and data variety have a visible impact on generating the result. The authors in [17] have focused on the code and variable variety for increasing Quality of Result. They have offered an approach for software-based approximate computing. They have provided techniques and tools that capture the significance of various operations with respect to the output of applications. In contrast, our approach has focused on the data variety which causes significance variety. By processing the most significant portions of data with high-configuration resources, the final result is generated faster. In [35], a comparison between Spark and COMPSs is done. The authors have described the functionality of Spark with a focus on TRANSFORMATIONs and ACTIONs. WordCount, Kmeans and Terasort are considered in this paper. The authors have suggested their algorithm to be used for adapting and rewriting the applications. Spark platform is used in our approach for our experiments.
Deadline- and budget-aware Scheduling Our important constraints in this article are the budget constraint and processing time limits. Some related works also addressed these issues. The main contribution of [14] is the scheduling issues with respect to deadline and limitation of the budget. This article has optimized the scheduling of MapReduce jobs at task level with respect to budget constraints. In this paper, the authors have focused on two aspects of optimization in scheduling.
-
Given a fixed budget, how to select the machine from a candidate set efficiently, for each task, so that the total scheduling length of the job is the shortest length without breaking the budget.
-
Given a fixed deadline D, how to select the machine from a candidate set efficiently for each task, so that the total monetary cost of the job has the lowest cost without missing the deadline.
The authors in [36] focused on the reduction of the energy cost of clouds. They have offered a pricing policy to cloud providers for increasing the profit. The authors in [37] present an approach to select the most cost-effective configuration in a way that resource costs are minimized while the service level agreements (SLAs) associated with the workload are met. Our approach also has offered an approach to improve the Quality of Result while meeting time and budget limitations of the problem. The authors in [38] have presented an optimization approach to allocate a MapReduce job with a priori deadline guarantees.
No one has yet used the data variety for scheduling of Big Data jobs to improve QoR with respect to budget and expected finishing time constraints. In this paper, a novel data variety-aware approach to improve the QoR in case of budget and finishing time constraint has been presented.
3 Motivation
Observations which motivated us for this research and idea have been presented in this section. For presenting motivation, some applications are used. These applications are derived from BigDataBench [39] and some other sources. First, input data are divided into 0.5 GB portions, and then, all of the permutations of portions are analyzed. The incremental outcome after processing of each portion has been measured. By this reordering approach, the speed of generating outcome differs depending on the sequence of data portions. Figure 2 represents our observations. The vertical axis shows the “Normalized Quality of Result,” and the horizontal axis shows the “amount of data processed.” As Fig. 2 shows, there is a large difference between the best and the worst sequences.

Quality of result of processing the data portions in various orders for WordCount benchmark with 0.5 GB as the size of data portions
In Fig. 2, the blue line and the red line show the incremental result of the best and worst sequences of processed data portions. In WordCount application, when half of the data is processed, the result of the worst sequence is still 73% far from the final outcome, whereas the best sequence resulted in only 27% far. This large gap is due to the difference in the “significance” of each data portion. This fact can be used to increase the QoR in case of time and budget limitations. Similar behavior is observed for other aggregative applications that are considered in this paper.
In big data processing, limitation of time and/or cost is a common problem. So processing all of the data may be impossible. We came to the idea of using this difference in significance value to give different priorities to data portions. According to this priority, various portion sequences may be selected to be processed on heterogeneous servers. We worked on choosing these data portions and assigning them to the appropriate servers to overcome the lack of time and/or budget.
4 Proposed approach
In this section, our SAIR approach is presented. Our objective is to increase the Quality of Result while the budget constraint and finishing time limitations are met. Considering the available budget and preferred finishing time, it may not be possible to process all of the input data, so the Quality of Result (QoR) may be affected. Our proposed approach, SAIR, consists of three parts:
Significance definition step In the first step, the Significance Measure is determined for each application, based on its functionality. In this paper, aggregative applications have been considered (e.g., counting accesses to Web pages from a log file).
Sampling step Then, the sampling method is used. In this step, the input data are divided into some same-sized portions and the sampling technique is used to determine the significance of each data portion.
Allocation step Finally, in the Allocation section, each portion is assigned to an appropriate server, based on the objectives. Figure 1 shows our approach in general. These steps have been described in detail below:
4.1 Significance definition
A measure is needed for comparing different data portions according to their impact on the final result. So, the Significance Measure is defined for each application based on its mathematical operation.
Significance definition for each application Table 1 describes defined Significance Measures for each application. The Significance Measure should indicate the amount of output generated and the degree of proximity to the final answer. For example, for applications that identify and count a particular pattern, the number of those specific patterns is considered as the Significance Measure. In Sorting and Indexing applications, the size of the produced middle file as the measure can be selected.
4.2 Sampling
Cochran sampling technique with a 95% confidence interval and 5% of error margin [40] has been used as the sampling technique. For example, in normal distribution, 385 samples should be selected to have 95% confidence interval and 5% of error margin. In our approach, 0.5 GB has been considered as portion size. Figure 3 shows how to divide the data into equal size portions and divide the portions into frames that are equal in size. Since each frame is a 1 KB data and each frame is considered as one sample, the overhead of processing these samples is less than 1%. Due to the small size of frames, the distribution of intra-frame data can be considered as uniform distribution.

Sampling of portions
This formula is valid, where N0 is the sample size, z2 is the abscissa of the normal curve that cuts off an area α at the tails (1 − α equals to the desired confidence level, e.g., 95%), e is the desired level of precision, p is the estimated proportion of an attribute that is present in the population, and q is 1 − p. The value for z is found in statistical tables, which calculates the area under the normal curve.
4.3 Allocation
In the Allocation step, according to the QoR, budget limitation and preferred finishing time, each portion is assigned to the appropriate server. The allocation algorithm has been described first.
4.3.1 Allocation algorithm
Algorithm 1 describes our approach in Allocation Step.
4.3.1.1 Problem definition
Our problem is the allocation of different data portions to servers to maximize the Quality of Result with the preferred finishing time and the budget available. The notation is represented in Table 2.
4.3.1.2 Problem statement
Due to the budget limitation and preferred finishing time, the Quality of Result should be maximized.
-
Quality of Result The quality of the result consists of the significance of each single portion. The objective is maximizing the QoR [formula (2)].
$${\text{QoR}} = \mathop \sum \limits_{i = 1}^{NP} \left( {{\text{Significance}}_{i} *Y_{i} } \right)$$(2) -
Finishing time Data portions may be processed in parallel. So, the total finishing time is the finishing time of the longest processing. Formulae (3)–(5) indicate the processing time. Based on the formula (1), processing time of each data portion depends on its server type. Formula (4) indicates that finishing time is the sum of processing time and latency time. Formula (5) presents the mathematical equation for finishing time.
$${\text{PT}}\left( {P_{i} } \right) = \mathop \sum \limits_{j}^{NS} Y_{i} *{\text{Cap}}_{j} *X_{i,j} *{\text{PT}}_{i,j}$$(3)$${\text{FT}}\left( {P_{i} } \right) = {\text{PT}}\left( {P_{i} } \right) + {\text{LT}}\left( {P_{i} } \right)$$(4)$${\text{FT}} = {\text{MAX}}\left( {{\text{FT}}\left( {P_{i} } \right)} \right)$$(5) -
Budget required for processing The budget required for processing is composed of the budget required for processing each data portion. The processing cost of each data portion is different according to the server on which it is processed. Based on formula (6), the “Budget Required for Processing” for each portion is dependent on the associated server type and the processing time.
$${\text{BRP}} = \mathop \sum \limits_{i = 1}^{{\rm NP}} \mathop \sum \limits_{j = 1}^{{\rm NS}} {\text{Cap}}_{j} *C_{j} *Y_{i} *X_{i,j} *{\text{PT}}_{i,j}$$(6)
4.3.1.3 Problem formulation
Formula (7) is the objective function, which should be maximized. Formulae (8) and (9) represent the constraints on budget limitation and preferred finishing time. The controllable parameter is “which portions are processed” and “assigning the portions to the servers” which are determined by the Algorithm 1 presented in the following subsection.
Subject to:
And,
Based on the formula (7), the Quality of Result should be maximized as objective function. Based on the formulae (8) and (9), two constraints exist in the problem. 1. Budget required for processing should be less than or equal to available budget. 2. Finishing time should be less than or equal to preferred finishing time.
4.3.1.4 SAIR allocation algorithm
The heuristic presented below assigns data portions to appropriate servers to obtain improved QoR. Pseudo-code of the algorithm is given in Algorithm 1.

Lines 1–3 of the algorithm are initialization of variables. The loop in lines 4–13 keeps running for the heuristic algorithm to satisfy the constraints and meet the objective function. Line 5 of our algorithm estimates the Quality of Result, finishing time and the budget required for processing of any portion on each server type. In lines 6–8, due to the budget constraint of the problem, if it is not possible to process all portions, we remove the less significant portions to meet the constraints. In lines 9–12, due to the finishing time constraint, we move the most significant portion in Time Critical Path to a higher configured server.
Feasibility analysis
-
Due to the removal mechanism (line 7), this algorithm will certainly have result if the solution space is not empty. This algorithm removes the less significant portions so that the problem constraints are satisfied.
-
If there is a solution to this problem, this algorithm will find it. However, it does not find all of the solutions to solve the problem.
-
The solution found by this algorithm is not necessarily the optimal solution to this problem. This algorithm removes less important portion, and if there is a budget constraint, it does not check their significance. In the case of time constraint, this algorithm moves the most significant data portion in Time Critical Path to the stronger processing server.
Complexity analysis The algorithm time complexity in the worst case is of O (nm) where n represents the number of server types and m represents the number of data portions.
As line 3 of the algorithm indicates, all data portions have been assigned to the Least Expansive Server. The two mechanisms in our algorithm used to overcome the lack of time and budget are demonstrated in Fig. 4. In case of lack of budget, amount of the least significant portion has been removed and in case of lack of time the most significant portion in TCP has been moved to the higher configured server.

Two mechanisms in the algorithm to overcome the lack of time and budget
Time Critical Path is demonstrated in Fig. 5. Server with Time Critical Path is the server with maximum finishing time. As Fig. 5 shows, the finishing time of Server 2 determines the TCP.

Time Critical path
4.3.2 Multi-stage MapReduce
SAIR approach has been implemented as a kind of MapReduce that consists of some partial MapReduce. MapReduce is a programming model that is used widely for passive processing [41]. Hadoop and Spark are the best-known, publicly available implementations of MapReduce [42,43,44]. In this study, Apache Spark and Scala language have been used to implement this multi-stage MapReduce.
After the first action (Scala operation) on the input data, it is converted into Resilient Distributed Dataset (RDD). These RDDs consist of (Key, value) pairs which make it possible to break a large MapReduce into smaller ones. The intermediate RDDs are stored in the storage and combined with other RDDs to produce the intermediate result or final outcome. Some actions in Scala programming language have been used for merging the RDDs, for example the “union” function combines different RDDs [43, 44]. Using union function, the RDDs do not transfer on the network, and this function just combines the address of RDDs to generate a new RDD [44]. Figure 6 shows the two-stage MapReduce. In this example, the input data are divided into two parts. Merging the RDDs is possible after the Map phase.

Overall view of multi-stage MapReduce processing in SAIR
5 Evaluation
In this section, the experimental setup and the analysis of the results have been described.
5.1 Experimental setup
In the evaluation of our SAIR approach, six applications and three types of server configurations have been used. Spark version 2.0 on Ubuntu12.04 is used as the framework of experiments. In the following paragraphs, the applications and datasets and then the server configurations and prices will be introduced.
Applications Some applications from BigDataBench and other sources are used to evaluate the SAIR approach. The followings are the name and a brief introduction of the mentioned applications:
-
WordCount: This application counts the number of words in the file.
-
Grep: It searches and counts a pattern in a file.
-
InvertedIndex: This application is an index data structure storing a mapping from content to its locations in a database file.
-
Health: This application calculates the number of heartbeats of volunteers.
-
Investment: This application calculates the volume of investment in different states.
-
URLCounting: It counts a certain URL in the input file.
Datasets Six benchmarks are used in evaluation step. Three of them are from BigDataBench suite [45] and three from other sources.
Our dataset is comprised of 50 GB of data from four different sources. This dataset is used in WordCount, Grep and InvertedIndex applications. The four data sources are IMDB, Gutenberg, Quotes and Wikipedia.
In our evaluation phase, health dataset [46] is also used, which consists of chest movements data, gathered from acceleration sensors attached to the human body. It also used Investment dataset [47] that surveys investments of various companies in different states in the USA. Log server dataset has been used in URLCounting application. For Health and Investment applications, the bootstrapping method is used for generating 50 GB data as the input dataset [48].
We ran experiments on three types of machines, an Intel Core-i7 2 core CPU at 2.8 GHz with 2 GB of RAM, an Intel Core-i7 4 core CPU at 2.8 GHz with 4 GB of RAM and an Intel Core-i7 8 core CPU at 2.8 GHz with 8 GB of RAM.
Server configuration Table 3 represents the configuration of servers we mentioned. We obtained the specifications and prices of servers from Amazon EC2 [49].
5.2 Experimental results
We ran some scenarios to show our solution’s performance and compared it with other approaches. SAIR presented as a significance variety-aware approach and ApproxHadoop is its state of the art.
Naïve approaches are also used to compare with our approach. “NSVOS1” presents significance-variety-oblivious process of naïve MapReduce on the least expensive server (LES). “NSVOS2” presents significance-variety-oblivious process of naïve MapReduce on a medium server. “NSVOS3” presents significance-variety-oblivious processes of naïve MapReduce on the most expensive server (MES).
Figure 7 shows the QoR in all used benchmarks. We consider 70% of finishing time of naïve MapReduce on LES and 70% of Budget of naïve MapReduce on MES as the finishing time and available budget constraints. This scenario is shown in Fig. 7 as a normal status. As Fig. 7 illustrates, our approach improves the QoR of the mentioned workloads up to 12% compared with the state of the art and up to 26% compared with significance-variety-oblivious approaches. Therefore, our proposed approach can achieve better Quality of Result. The sensitivity analysis of the proposed approach is presented below.

Comparison of variety-oblivious and variety-aware resource allocations for all benchmarks
-
Sensitivity to Budget and Finishing Time constraint
Figure 8 shows different conditions of time and budget constraints. T1 is the finishing time of naïve MapReduce on the least expensive of available resources. B1 is the budget required for processing of naïve MapReduce on the most expensive of available resources. The SAIR approach is presented for every condition in Area1. In Area2, only time constraint exists, and therefore, more expensive (and configured) servers can be used for processing. In Area4, only budget constraint exists, so less expensive (and configured) servers can be used. In Area3, there is no constraint. We also define three classes of constraints in the SAIR area and show these classes in Fig. 8. The Hard constraint is an area with extreme limitations. The Normal constraint has the normal limits, and the Soft constraint is the constraint with low limitations.

Different time and budget constraints
The proposed approach has been examined in different classes in terms of available budget and preferred finishing time. We have considered some values for AB and PFT in Soft, Normal and Hard areas. We consider 50%, 70% and 90% of T1 and B1 for Hard, Normal and Soft limitations. These values have been used for our experiments. In Hard constraint area, as user faced with more restrictions, our variety-aware approach makes a better result. In the Soft state, our approach improves QoR of workloads up to 5% compared with the state of the art and up to 22% compared with the significance-variety-oblivious approaches. Figure 7 shows the result of our experiments. In the Normal state, our approach improves QoR of proposed applications up to 12% compared with the state of the art and 26% compared with the significance-variety-oblivious approaches. Furthermore, in the Hard state, the QoR of considered workloads has been improved up to 15% compared with the state of the art and up to 28% compared with the significance-variety-oblivious approaches. Generally, our approach makes better Quality of Result in case of more restrictions, compared to other approaches.
-
Sensitivity of “Amount of data needed to be processed” to data portions variance
In this section, the impact of data portions variance on the amount of data needed to be processed will be examined. ApproxHadoop [15] has been considered as the state of the art. In ApproxHadoop approach, a two-level sampling method and the Student’s t-distribution have been considered and a small amount of input data have been sampled and processed [50]. However, the accuracy of the method depends on the data portions variance. In case of uneven distribution and multi sources, the variance between input data has been increasing. This issue causes increase in volume of samples. Our approach can dominate this issue. Based on the two-level sampling formula, we should select small portion size and select some small data frames (based on Fig. 3) of all portions as the sample to reduce intra-portion variance [50]. By this approach, based on the two-level sampling formula, we decrease the intra-portion size and dominate the effect of inter portion variance. So, amount of data needed to be processed are decreasing and acceptable Quality of Result is achieved by processing a small amount of data.
As Sect. 3 shows, when the data are composed of several sources, the variance between them is high and therefore their effect on the final answer will be different. In order to demonstrate the efficiency of our method, the following two scenarios have been designed:
-
1.
In Fig. 9, input data are generated from the Wikipedia source in BigDataBench. This causes a small amount of data portions variance. As Fig. 9 shows, in this case, ApproxHadoop has acceptable performance.
Fig. 9 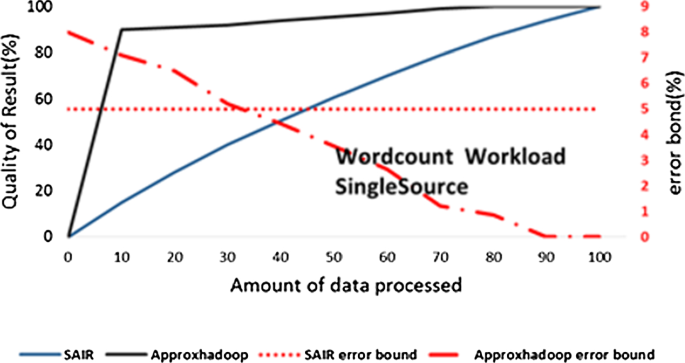
Compare SAIR and ApproxHadoop with data from single sources
-
2.
In Fig. 10, data are collected from four sources. These sources are IMDB, Gutenberg, Quotes and Wikipedia. In this case, the intra- and inter-portions variance is a considerable amount and causes the accuracy of the ApproxHadoop method to reduce. The presented solution in ApproxHadoop [15] in case of very small amount of data portions variance generates acceptable result, but in case of high value of data, portions variance cannot generate a proper result. So, our significance variety-aware approach can generate better Quality of Result in case of high value of inter/intra portions variance. Figure 10 also shows that ApproxHadoop does not guarantee an acceptable error bound in case of multi-source input data.
Fig. 10 
Compare SAIR and ApproxHadoop with data from various sources


ApproxHadoop presents an approach with undefined sample size. This approach in case of uniform distribution has acceptable results. But data variety is one of main features of Big Data that causes data skew, and ApproxHadoop is not accurate against this feature. We also present our approach that has acceptable results in every condition of data distribution and data variety. Our approach can surpass ApproxHadoop in case of data variety and skew.
As illustrated in Fig. 7, by SAIR approach that process data in a significance variety-aware way on the heterogeneous servers, our approach is able to achieve higher Quality of Result. Our approach permits the user to manage the process with regard to his limitations of processing.
The conclusion is that SAIR is successful in meeting preferred finishing time and budget constraints and it can achieve the highest Quality of Result. Unlike SAIR, ApproxHadoop, the significance variety oblivious and naïve MapReduce lack effective use of resources, and hence, they achieve a lower Quality of Result compared with our approach.
As additional conclusion, SAIR can surpass the traditional approaches in case of uneven distribution and impressive data variety. Previous works did not pay enough attention to the data variety. So, the users can use SAIR in such conditions.
6 Conclusion
In this paper, we presented a significance-aware approach for increasing QoR in case of budget and time constraints for big data processing. We have considered aggregative functions including sum, count, average and ratio in this paper. The proposed approach tries to allocate the most efficient resource to more significant portions of data. By this approach, we are able to meet budget and preferred finishing time constraints. Experiments on the benchmarks demonstrated that our approach has superior performance comparing to its state of the art and some other approaches.
Definition of application type and the significance for each application are the first step of this approach. Sampling of data portions according to their significance is the other step of this approach. The last step is the allocation algorithm. Our approach presents a solution for big data processing in case of budget limitation with regard to the preferred finishing time.
Advantages and disadvantages of SAIR and its state of the art are described below.
Advantages and disadvantages of SAIR:
-
Good performance in every conditions of distribution and data skew
-
Low overhead in every conditions of input data
-
Simple to implement
Advantages and disadvantages of ApproxHadoop:
-
Good performance in case of uniform distribution
-
Unacceptable result in case of uneven distribution
-
High overhead in case of uneven distribution
7 Future research
Many interesting directions exist for future research. First of them is estimating the total and partial processing capacity for all data or each data portion. By this approach, the user is able to rent suitable processing capacity. The user should consider the amount of CPU usage, the memory usage and processing time for each portion on servers. Another area for future work is analyzing the impact of intra-/inter-portion variance on Quality of Result in case of budget limitation.
Significance of our work We expected our work to be useful for many purposes: (a) Increasing QoR of big data processing in case of budget limitations, (b) a suitable approach for resource provisioning and allocation, (c) as a platform for approximate computing based on data variety and accelerating processing of the most significant data portions and (d) reducing time for generation of significant part of results.
References
Barroso LA, Clidaras J, Hölzle U (2013) The datacenter as a computer: an introduction to the design of warehouse-scale machines, vol 8.3, 2nd edn. Morgan & Claypool, San Rafael, pp 1–154
Gantz J, Reinsel D (2012) The digital universe in 2020: big data, bigger digital shadows, and biggest growth in the far east. IDC iView IDC Anal Future 2007:1–16
Ahmadvand H, Goudarzi M (2017) Using data variety for efficient progressive big data processing in warehouse-scale computers. IEEE Comput Archit Lett 16(2):166–169
Fekete J-D, Primet R (2016) Progressive analytics: a computation paradigm for exploratory data analysis. arXiv preprint arXiv, vol. 1607.05162
Mittal S (2016) A survey of techniques for approximate computing. ACM CSUR 48:62
Parasyris K, Vassiliadis V, Antonopoulos CD, Lalis S, Bellas N (2017) Significance-aware program execution on unreliable hardware. ACM TACO 14(2):12
Zhao Y, Calheiros RN, Gange G, Ramamohanarao K, Buyya R (2015) SLA-based resource scheduling for big data analytics as a service in cloud computing environments. In: 2015 44th International Conference on Parallel Processing (ICPP)
Honjo T, Oikawa K (2013) Hardware acceleration of hadoop mapreduce. In: 2013 IEEE International Conference on in Big Data
Shan Y, Wang B, Yan J, Wang Y, Xu N, Yang H (2010) FPMR: MapReduce framework on FPGA. In: Proceedings of the 18th Annual ACM/SIGDA International Symposium on Field Programmable Gate Arrays
Polato I, Ré R, Goldman A, Kon F (2014) A comprehensive view of Hadoop research—a systematic literature review. J Netw Comput Appl 46:1–25
Mashayekhy L, Movahed Nejad M, Grosu D, Zhang Q, Shi W (2015) Energy-aware scheduling of mapreduce jobs for big data applications. IEEE Trans Parallel Distrib Syst 26(10):2720–2733
Chandramouli B, Goldstein J, Quamar A (2013) Scalable progressive analytics on big data in the cloud. Proc VLDB Endow 6:1726–1737
Condie T, Conway N, Alvaro P, Hellerstein JM, Elmeleegy K, Sears R (2010) MapReduce online. In Nsdi
Wang Y, Shi W (2013) On optimal budget-driven scheduling algorithms for MapReduce jobs in the hetereogeneous cloud. Technical report TR-13–02, Carleton University
Goiri I, Bianchini R, Nagarakatte S, Nguyen TD (2015) Approxhadoop: bringing approximations to mapreduce frameworks. ACM SIGARCH Comput Archit News 43:383–397
Ahmadvand H, Goudarzi M, Foroutan F (2019) Gapprox: using Gallup approach for approximation in big data processing. J Big Data 6(1):20
Vassiliadis V, Riehme J, Deussen J, Parasyris K, Antonopoulos CD, Bellas N, Lalis S, Naumann U (2016) Towards automatic significance analysis for approximate computing. In: 2016 IEEE/ACM International Symposium on Code Generation and Optimization (CGO)
Chen Y, An A (2016) Approximate parallel high utility itemset mining. Big Data Res 6:26–42
Zamani AR, AbdelBaky M, Balouek-Thomert D, Rodero I, Parashar M (2017) Supporting data-driven workflows enabled by large scale observatories. In: IEEE 13th International Conference on e-Science (e-Science), Auckland, New Zealand
Zhang X, Wang J, Yin J (2016) Sapprox: enabling efficient and accurate approximations on sub-datasets with distribution-aware online sampling. Proc VLDB Endow 10(3):109–120
Li K, Li G (2018) Approximate query processing: what is new and where to go? Data Sci Eng 3(4):379–397
Agarwal S, Mozafari B, Panda A, Milner H, Madden S, Stoica I (2013) BlinkDB: queries with bounded errors and bounded response times on very large data. In: Proceedings of the European Conference on Computer Systems (EuroSys)
Zheng C, Zhan J, Jia Z, Zhang L (2013) Characterizing os behavior of scale-out data center workloads. In: The Seventh Annual Workshop on the Interaction amongst Virtualization, Operating Systems and Computer Architecture (WIVOSCA 2013)
Lee Y, Lee Y (2011) Detecting ddos attacks with hadoop. In: Proceedings of The ACM CoNEXT Student Workshop
Thusoo A, Shao Z, Anthony S, Borthakur D, Jain N, Sarma JS, Murthy R, Liu H (2010) Data warehousing and analytics infrastructure at Facebook. In: Proceedings of the 2010 ACM SIGMOD International Conference on Management of Data
Kaur N, Sood SK (2017) Efficient resource management system based on 4Vs of big data streams. Big Data Research
Jiang Y, Huang Z, Tsang DHK (2018) Towards max–min fair resource allocation for stream big data analytics in shared clouds. IEEE Trans Big Data 4(1):130–137
Kelley J, Stewart C, Morris N, Tiwari D, He Y, Elnikety S (2017) Obtaining and managing answer quality for online data-intensive services. ACM TOMPECS 2(2):11
Li C, Zhu L, Liu Y, Luo Y (2017) Resource scheduling approach for multimedia cloud content management. J Supercomput 73(12):5150–5172
Wang J, Zhang X, Yin J, Wang R, Wu H, Han D (2018) Speed up big data analytics by unveiling the storage distribution of sub-datasets. IEEE Trans Big Data 4(2):231–244
Papadias D, Tao Y, Fu G, Seeger B (2005) Progressive skyline computation in database systems. ACM TODS 30:41–82
Tan K-L, Eng P-K, Ooi BC (2001) Efficient progressive skyline computation. VLDB 1:301–310
Zhang D, Du Y, Xia T, Tao Y (2006) Progressive computation of the min-dist optimal-location query. In: Proceedings of the 32nd International Conference on Very Large Data Bases
Krishnan DR, Quoc DL, Bhatotia P, Fetzer C, Rodrigues R (2016) IncApprox: a data analytics system for incremental approximate computing. In: Proceedings of the 25th International Conference on World Wide Web. International World Wide Web Conferences Steering Committee
Conejero J, Corella S, Badia RM, Labarta J (2018) Task-based programming in COMPSs to converge from HPC to big data. Int J High Perform Comput Appl 32(1):45–60
Qiu C, Shen H, Chen L (2018) Towards green cloud computing: demand allocation and pricing policies for cloud service brokerage. IEEE Trans Big Data. https://doi.org/10.1109/TBDATA.2018.2823330
Mian R, Martin P, Vazquez-Poletti JL (2012) Provisioning data analytic workloads in a cloud. Future Gen Comput Syst 29(6):1452–1458
Malekimajd M, Ardagna D, Ciavotta M, Gianniti E, Passacantando M, Rizzi AM (2018) An optimization framework for the capacity allocation. J Supercomput 74(10):5314–5348
BigDataBench. http://prof.ict.ac.cn/. Accessed 15 Feb 2019
Cochran WG (2007) Sampling techniques. Wiley, Hoboken
Dean J, Ghemawat S (2008) MapReduce: simplified data processing on large clusters. Commun ACM 51(1):107–113
Welcome to Apache™ Hadoop®! http://hadoop.apache.org/. Accessed 15 Feb 2019
Apache Spark™—lightning-fast cluster computing. http://www.spark-project.org/. Accessed 15 Feb 2019
RDD Programming Guide. https://spark.apache.org/docs/latest/rdd-programming-guide.html. Accessed 15 Feb 2019
Wang L, Zhan J, Luo C, Zhu Y, Yang Q, He Y, Gao W, Jia Z, Shi Y, Zhang S, Zheng C, Lu G, Zhan K, Li X, Qiu B (2014) Bigdatabench: a big data benchmark suite from internet services. In: 2014 IEEE 20th International Symposium on High Performance Computer Architecture (HPCA)
UCI Machine Learning Repository. https://archive.ics.uci.edu/ml/datasets/MHEALTH%20Dataset. Accessed 15 Feb 2019
Sample CSV Data. https://support.spatialkey.com/spatialkey-sample-csv-data/. Accessed 15 Feb 2019
Efron B, Tibshirani R (1986) Bootstrap methods for standard errors, confidence intervals, and other measures of statistical accuracy. Stat Sci 1(1):54–75
Amazon EC2 Dedicated Instances. https://aws.amazon.com/ec2/purchasing-options/dedicated-instances/. Accessed 15 Feb 2019
Lohr SL (2009) Sampling: design and analysis. Cengage Learning, Boston
Author information
Authors and Affiliations
Corresponding author
Additional information
Publisher's Note
Springer Nature remains neutral with regard to jurisdictional claims in published maps and institutional affiliations.
Rights and permissions
About this article

Cite this article
Ahmadvand, H., Goudarzi, M. SAIR: significance-aware approach to improve QoR of big data processing in case of budget constraint. J Supercomput 75, 5760–5781 (2019). https://doi.org/10.1007/s11227-019-02797-7
Published:
Issue Date:
DOI: https://doi.org/10.1007/s11227-019-02797-7