
Abstract
Purpose
To compare the published results of studies on the genotype association of ARMS2/LOC387715 A69S, CFH Y402H, and CFH I62V in cases diagnosed as retinal angiomatous proliferation (RAP) versus neovascular age-related macular degeneration (AMD) or healthy controls.
Methods
Heterogeneity of studies was evaluated using Cochran’s Q test and I-square index. To modify the heterogeneity in the variables, we used random effects model. Meta-analysis was performed using STATA.
Results
Four studies were included with 1076 neovascular AMD patients, 222 RAP cases, and 2276 control subjects. Pooled overall odds ratios for RAP/AMD were 1.15 (95% CI 0.60–2.18) for GT versus GG, 3.52 (95% CI 1.25–9.91) for TT versus GG ARMS2, 0.98 (95% CI 0.22–4.29) for GA versus AA, 1.00 (95% CI 0.25–4.02) for GG versus AA CFHI62V, 0.57 (95% CI 0.35–0.93) for CT versus TT CFH Y402H, and 0.40 (95% CI 0.22–0.74) for CC versus TT CFH Y402H. Regression analysis showed that ARMS2 TT genotype has a statistically significant effect on RAP versus AMD compared to CFH genotypes (P < 0.001).
Conclusion
This meta-analysis disclosed a stronger effect of ARMS2 genotypes in RAP cases compared with CFH Y402H and I62V genotypes.
Introduction
Age-related macular degeneration (AMD) is the primary cause of irreversible central visual loss in the geriatric population with deleterious global effect on the quality of life [1]. Retinal angiomatous proliferation (RAP) is a rare variant of neovascular AMD which is characterized by intraretinal neovascularization and retinal–retinal and retinal–choroidal anastomosis [2, 3]. The exact developmental mechanism of RAP remains unclear and its natural history is characterized by a rapid loss of vision and resistance to various treatments [4, 5]. Two major genetic loci which have been described in association with an increased risk of AMD are the age-related maculopathy susceptibility 2 (ARMS2)/LOC387715 locus mapped on chromosome 10q26 and the complement factor H (CFH) gene mapped on chromosome 1q31 [6–8].
Thinner subfoveal choroidal thickness with resultant compromised choroidal perfusion has highlighted the role of sub-retinal pigment epithelium (RPE) tissues in the development of RAP [9]. Some authors have suggested that, with regard to the location of neovascular lesions, the effect of the CFH polymorphism is weaker for RAP than for typical neovascular AMD, while the risk genotypes of the ARMS2 may have stronger effect [10, 11]. They theorized that the location of characteristic neovascularization corresponds to the location of susceptible gene expression in each subtype of AMD, while CFH may play a major role beneath the RPE (primarily in the RPE, drusen, and choroidal capillaries) [7], and ARMS2 would have a major role above the RPE (shown by some authors to be expressed in the ellipsoid region of the photoreceptor cells) [10, 12]. In accordance with Yannuzzi et al. [2] who proposed that the origin of RAP neovascularization is the neural retina, the above-mentioned authors also postulated the major role of ARMS2 gene compared to CFH gene in the pathogenesis of RAP. According to this theory, increased systemic complement activation has been shown in neovascular AMD but not in RAP cases [13]. Common pathway of mechanism between ARMS2 and CFH genes in AMD pathogenesis through complement system [14], development of choroidal neovascularization in the course of RAP [3], and Gass et al.’s [15] theory which suggested the choroidal origin of these vessels further complicate the clarifying role of sub- or supra-RPE tissues in this disease.
One of the major limitations of the studies on RAP is its rarity and limited genotype information, though in this study we decided to perform a meta-analysis to pool the published results of studies on ARMS2/LOC387715 A69S, CFH Y402H, and CFH I62V genotypes in RAP versus neovascular AMD or healthy controls to evaluate the magnitude of the effect of each gene in RAP pathogenesis.
Materials and methods
Search strategy
To understand the significance of the observed associations across the ARMS2/LOC387715 (rs10490924), CFH Y402H, and CFH I62V (rs800292) genotypes in RAP versus neovascular AMD or healthy controls in different studies, we designed a meta-analysis with the calculation of the estimated odds ratios (OR). The included studies were based on a literature search in PubMed in February 2016 with the phrases (RAP or retinal angiomatous proliferation) and (ARMS or age-related maculopathy susceptibility or age related maculopathy susceptibility or LOC387715 or CFH or complement factor H) in title or abstract.
Data extraction
Two retina specialists (MHJB and MS) identified relevant studies and reviewed all titles/abstracts and full-text manuscripts of the identified studies separately in order to select those for inclusion. Any human-based association study, regardless of ethnicity or sample size, was included if it met the following criteria: the main outcome of interest or one of the study outcomes was RAP; there were at least 2 comparison groups (RAP vs. control group or neovascular AMD or both); and there were sufficient results for the extraction of data. Summary data were extracted independently and in duplicate by two of the authors (MHJB and MS) using a standardized data extraction form. Other data such as mean age, gender, and proportion of smokers were also extracted for analysis. Any disagreements between these authors were resolved by consensus. The articles were restricted to the English language. Figure 1 illustrates the summary of study search and selection in this meta-analysis.

Summary of study search and selection in this meta-analysis. There is one non-English review article
Statistical analysis
To present data, we used mean, standard deviation, range, frequency, and percent. In order to determine whether SNP was in the Hardy–Weinberg equilibrium (HWE), a Chi square test was performed in all groups of studies.
We used forest plots for the estimation of the effect of each study and pooled effect of all studies with their confidence interval (CI) to provide a visual summary of the data. Heterogeneity of studies was evaluated using Cochran’s Q test and I-square index, and P < 0.05 was considered as heterogeneity. To modify the heterogeneity in the variables, we used random effects model. Meta-analysis was performed using STATA (StataCorp. 2013. Stata Statistical Software: Release 13. College Station, TX: StataCorp LP). Funnel plot (qualitative method) and Egger’s regression test (quantitative method) were used for the evaluation of possible publication bias. Using an interaction term in a random effect logistic regression, we evaluated the difference in the effects of ARMS2 and CFH on the odds ratios of RAP versus neovascular AMD.
Results
Of the 18 screened articles, four studies [16–19] were identified to be eligible using our search strategy for inclusion in the meta-analysis. Characteristics of the included studies are described in Table 1.
Publication bias was assessed using Egger’s test as follows:
-
RAP versus control group coefficient = 0.19, 95% CI −3.81 to 4.20, P = 0.85 for ARMS2 TG/GG; coefficient = 2.28, 95% CI 0.46–4.1, P = 0.03 for ARMS2 TT/GG; coefficient = 2.97, 95% CI −9.77 to 15.72, P = 0.21 for CFH I62V GA/AA; and coefficient = 2.57, 95% CI −4.59 to 9.74, P = 0.14 for CFHI62V GG/AA.
-
RAP versus neovascular AMD group coefficient = 1.12, 95% CI −2.85 to 5.09, P = 0.35 for ARMS2 TG/GG; coefficient = 2.77, 95% CI −0.29 to 5.83, P = 0.06 for ARMS2 TT/GG; coefficient = 3.31, 95% CI −12.49 to 19.13, P = 0.23 for CFHI62V GA/AA; and coefficient = 3.12, 95% CI −5.54 to 11.79, P = 0.14 for CFHI62V GG/AA.
We had two studies containing CFH Y402H data though Egger’s test for publication bias was not possible for its genotypes.
Accumulation of data from these studies provided a total sample size of 3574 cases and controls; among them, RAP group sample size was 222 versus 1076 in the neovascular AMD group and 2276 in the control group. To modify the heterogeneity between studies, the results were pooled using a random effects analysis.
-
Pooled overall ORs for RAP versus control 2.96 (95% CI 1.90–4.62) for GT versus GG ARMS2; 28.54 (95% CI 13.83–58.93) for TT versus GG ARMS2; 1.82 (95% CI 0.49–6.70) for GA versus AA CFHI62V; and 3.79 (95% CI 1.26–11.38) for GG versus AA CFHI62V (Figs. 2, 3).
Fig. 2 
Right side funnel plots for the effect of ARMS2/LOC387715 A69S (rs10490924) in RAP versus control (upper part GT vs. GG, lower part TT vs. GG). These plots indicate that most studies are in the non-significant bias area (the area between the two lines). Left side forest plots for the effect of ARMS2/LOC387715 A69S (rs10490924) in RAP versus control [individual and pooled odds ratio estimates for GT vs. GG (upper part) and TT vs. GG (lower part)]. The pooled odds ratio is indicated by diamond using a random effect model for analysis. CI confidence interval (horizontal lines). Diamond the pooled estimate of the odds ratios. I 2: index for heterogeneity of studies
Fig. 3 
Right side funnel plots for the effect of CFH I62V rs800292 in RAP versus control (upper part GA vs. AA, lower part GG vs. AA). These plots indicate that most studies are in the non-significant bias area (the area between the two lines). Left side forest plots for the effect of CFH I62V rs800292 in RAP versus control [individual and pooled odds ratio estimates for GA vs. AA (upper part) and GG vs. AA (lower part)]. The pooled odds ratio is indicated by diamond using a random effect model for analysis. CI confidence interval (horizontal lines). Diamond the pooled estimate of the odds ratios. I 2: index for heterogeneity of studies
-
Pooled overall ORs for RAP versus AMD 1.15 (95% CI 0.60–2.18) for GT versus GG ARMS2; 3.52 (95% CI 1.25–9.91) for TT versus GG ARMS2; 0.98 (95% CI 0.22–4.29) for GA versus AA CFH I62V; and 1.00 (95% CI 0.25–4.02) for GG versus AA CFH I62V (Figs. 4, 5).
Fig. 4 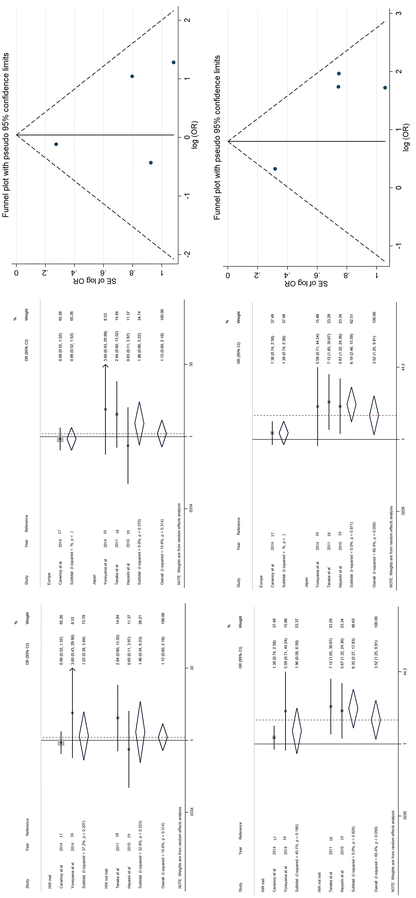
Right side funnel plots for the effect of ARMS2/LOC387715 A69S (rs10490924) in RAP versus neovascular AMD (upper part GT vs. GG, lower part TT vs. GG). These plots indicate that most studies are in the non-significant bias area (the area between the two lines). Middle and left side forest plots for the effect of ARMS2/LOC387715 A69S (rs10490924) in RAP versus neovascular AMD [individual and pooled odds ratio estimates for GT vs. GG (upper part) and TT vs. GG (lower part)]. Separated and pooled data based on region (Europe or Japan: middle figure) and based on equilibrium or disequilibrium of Hardy–Weinberg rule in studies (left side). The pooled odds ratio is indicated by diamond using a random effect model for analysis. CI confidence interval (horizontal lines). Diamond the pooled estimate of the odds ratios. I 2: index for heterogeneity of studies
Fig. 5 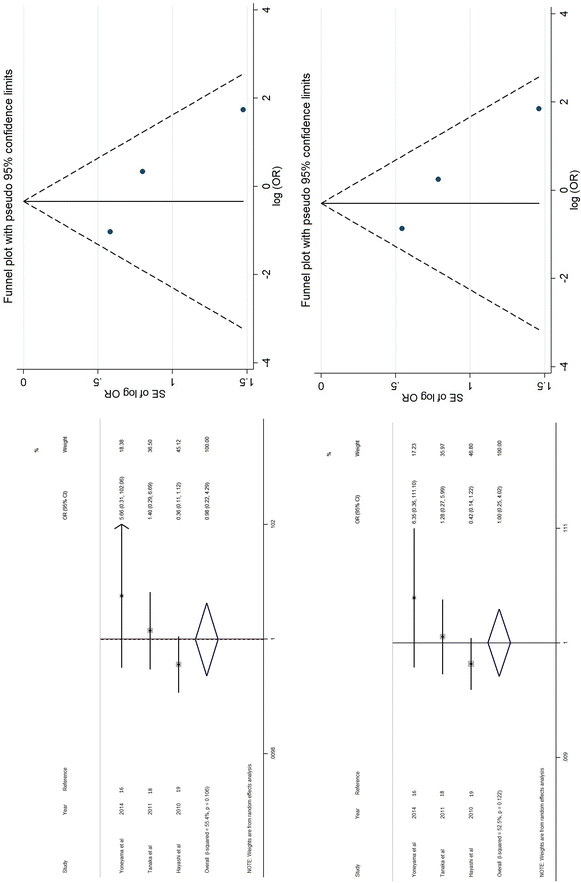
Right side funnel plots for the effect of CFH I62V rs800292 in RAP versus neovascular AMD (upper part GA vs. AA, lower part GG vs. AA). These plots indicate that most studies are in the non-significant bias area (the area between the two lines). Left side forest plots for the effect of CFH I62V rs800292 in RAP versus neovascular AMD [individual and pooled odds ratio estimates for GA vs. AA (upper part) and GG vs. AA (lower part)]. The pooled odds ratio is indicated by diamond using a random effect model for analysis. CI confidence interval (horizontal lines). Diamond the pooled estimate of the odds ratios. I 2: index for heterogeneity of studies
-
Pooled overall ORs for RAP versus control 1.17 (95% CI 0.76–1.81) for CT versus TT CFH Y402H and 2.66 (95% CI 1.50–4.72) for CC versus TT CFH Y402H.
-
Pooled overall ORs for RAP versus AMD 0.57 (95% CI 0.35–0.93) for CT versus TT CFH Y402H and 0.40 (95% CI 0.22–0.74) for CC versus TT CFH Y402H (Figs. 6, 7).
Fig. 6 
Right side funnel plots for the effect of CFH Y402H RAP versus control group (upper part CT vs. TT, lower part CC vs. TT). These plots indicate that most studies are in the non-significant bias area (the area between the two lines). Left side forest plots for the effect of CFH Y402H RAP versus control group [individual and pooled odds ratio estimates for CT vs. TT (upper part) and CC vs. TT (lower part)]. The pooled odds ratio is indicated by diamond using a random effect model for analysis. CI confidence interval (horizontal lines). Diamond the pooled estimate of the odds ratios. I 2: index for heterogeneity of studies
Fig. 7 
Right side funnel plots for the effect of CFH Y402H in RAP versus neovascular AMD (upper part CT vs. TT, lower part CC vs. TT). These plots indicate that most studies are in the non-significant bias area (the area between the two lines). Left side forest plots for the effect of CFH Y402H in RAP versus neovascular AMD [individual and pooled odds ratio estimates for CT vs. TT (upper part) and CC vs. TT (lower part)]. The pooled odds ratio is indicated by diamond using a random effect model for analysis. CI confidence interval (horizontal lines). Diamond the pooled estimate of the odds ratios. I 2: index for heterogeneity of studies


Regression analysis showed that ARMS2 TT genotype has a statistically significant effect on RAP versus AMD compared to CFH genotypes (P < 0.001). On the other hand, ARMS2 GT genotype has no statistically significant effect on RAP versus AMD compared to CFH genotypes (P = 0.103).
Discussion
Our knowledge of the genetic factors involved in the pathogenesis of AMD has expanded substantially in recent years, while data on the major genetic factors in RAP and its development are very limited. The present meta-analysis revealed that the ARMS2 A69S risk variants confer a significantly greater risk of RAP compared with neovascular AMD. The phenotypic diversity of AMD is supposed to be related to differences in genetic backgrounds [11, 16–21]. The genetic association of RAP has not been evaluated sufficiently because of its rarity. While its natural history is characterized by a rapid visual loss and treatment resistance [4, 5], its exact developmental mechanism remains controversial. Pooling published data for the association of these genetic loci with RAP versus neovascular AMD and control groups may further help clarify the pathogenesis of RAP.
In this meta-analysis, we pooled the results of available association studies between ARMS2/LOC387715 A69S, CFHY402H, and CFH I62V genotypes with RAP versus neovascular AMD cases or healthy controls to evaluate the magnitude of the effect of these factors. Our meta-analysis showed the stronger effect of ARMS2 in RAP compared with CFH genotypes. Previous studies have demonstrated the prevalence of RAP in newly diagnosed neovascular AMD to be lower in Asians (15.1% in whites and 4.5% in Asians) [22–24]. Despite this lower prevalence of RAP in Asians, the majority of studies included in our meta-analysis were from Asian population. We suppose that it is because of the higher prevalence of polypoidal choroidal vasculopathy (PCV) subtype of AMD in these regions. In fact, the main purpose of genetic analysis of AMD subtypes in these regions may be revealing the genetic nature of PCV rather than RAP.
In contrast to the hypothesis of Yannuzzi [2], Gass [15] believes that choroidal neovascularization is the initiating event of RAP lesion rather than retinal neovascularization, and some authors prefer to refer to this entity as ‘retinal anastomosis to the lesion’ or RAL rather than RAP [25]. Different retinal sites and subcellular organelles such as mitochondria, extracellular matrix, and cytosol (RPE and ellipsoid region) have been shown as ARMS2 expression sites in retina [12, 28–30]. On the other hand, RPE has been identified as the main local source of CFH expression in the eye [7, 31]. Regarding these findings, it seems that ARMS2 has at least some expression site superior to RPE, while CFH is confined to RPE and sub-RPE layers. In previous meta-analyses [32, 33], ARMS2 and CFH Y402H had roughly equal risk effect in typical AMD (ARMS2 TT and GT: OR = 7.51 and 2.35; CFH Y402H CC and CT: OR = 6.32 and 2.50), while our study has shown that there is a difference in the effects of these two genes on RAP.
Because of the distinctive expression site of these two genes (ARMS2/LOC387715: RPE and above RPE; CFH: RPE and below RPE), it seems that the distinctive genetic nature of RAP could help clarify the pathway of disease pathogenesis. ARMS2/LOC387715 mechanism has common pathway with CFH in AMD susceptibility [14, 26]. While these two genes have been shown to have a common pathway possibly through complement activation in AMD pathogenesis, a previous study has shown a lower level of complement activation in RAP versus neovascular AMD [13]. These two genetic loci have a common pathway of effect toward typical AMD cases and their different effect in RAP subtype of AMD can be explained by the different pathogenetic pathway of RAP compared with neovascular AMD, by the possible effect of other genetic/non-genetic risk factors and/or by the existence of other pathogenetic pathway of ARMS2 in RAP. This meta-analysis summarizes the evidence of a stronger effect of ARMS2 in RAP compared with CFH Y402H and I62V genotypes. Our findings are in accordance with those of Maguire et al. [27], which showed that ARMS2 is associated specifically with retinal angiomatous proliferation lesions among patients with neovascular AMD. Understanding the relationships between these genetic loci and disease subtypes will provide important insights, elucidating the biologic architecture of this heterogeneous disorder. These two genetic loci have roughly equal risk effect in typical AMD susceptibility but ARMS2 is a significantly stronger risk for RAP compared with CFH. This difference may be a result of wider extension of ARMS2 expression in retinal layers.
Future studies with a large sample size especially from Caucasians considering the possible interactional role of other proposed genes and factors such as complement system are needed to clarify the pathogenesis of RAP.
References
Klein R, Peto T, Bird A, Vannewkirk MR (2004) The epidemiology of age-related macular degeneration. Am J Ophthalmol 137:486–495
Yannuzzi LA, Negrão S, Iida T, Carvalho C et al (2001) Retinal angiomatous proliferation in age-related macular degeneration. Retina 21:416–434
Freund KB, Ho IV, Barbazetto IA, Koizumi H et al (2008) Type 3 neovascularization: the expanded spectrum of retinal angiomatous proliferation. Retina 28:201–211
Viola F, Massacesi A, Orzalesi N, Ratiglia R, Staurenghi G (2009) Retinal angiomatous proliferation: natural history and progression of visual loss. Retina 29:732–739
Bottoni F, Massacesi A, Cigada M et al (2005) Treatment of retinal angiomatous proliferation in age-related macular degeneration: a series of 104 cases of retinal angiomatous proliferation. Arch Ophthalmol 123:1644–1650
Weeks DE, Conley YP, Tsai HJ et al (2004) Age-related maculopathy: a genome wide scan with continued evidence of susceptibility loci within the 1q31, 10q26, and 17q25 regions. Am J Hum Genet 75:174–189
Klein RJ, Zeiss C, Chew EY et al (2005) Complement factor H polymorphism in age-related macular degeneration. Science 308:385–389
Rivera A, Fisher SA, Fritsche LG et al (2005) Hypothetical LOC387715 is a second major susceptibility gene for age-related macular degeneration, contributing independently of complement factor H to disease risk. Hum Mol Genet 14:3227–3236
Kim JH, Kim JR, Kang SW (2013) Thinner choroid and greater drusen extent in retinal angiomatous proliferation than in typical exudative age-related macular degeneration. Am J Ophthalmol 155:743–749
Ohkuma Y, Hayashi T, Sakai T et al (2014) Retinal angiomatous proliferation associated with risk alleles of ARMS2/HTRA1 gene polymorphisms in Japanese patients. Clin Ophthalmol. 8:143–148
Wegscheider BJ, Weger M, Renner W et al (2007) Association of complement factor H Y402H gene polymorphism with different subtypes of exudative age-related macular degeneration. Ophthalmology 114:738–742
Fritsche LG, Loenhardt T, Janssen A et al (2008) Age-related macular degeneration is associated with an unstable ARMS2 (LOC387715) mRNA. Nat Genet 40:892–896
Lechner J, Chen M, Hogg RE et al (2016) Higher plasma levels of complement C3a, C4a and C5a increase the risk of subretinal fibrosis in neovascular age-related macular degeneration: complement activation in AMD. Immun Ageing 13:4
Jabbarpoor Bonyadi MH, Yaseri M, Bonyadi M, Soheilian M, Karimi S (2016) Association of combined complement factor H Y402H and ARMS/LOC387715 A69S polymorphisms with age-related macular degeneration: a meta-analysis. Curr Eye Res 41:1519–1525
Gass JD, Agarwal A, Lavina AM, Tawansy KA (2003) Focal inner retinal hemorrhages in patients with drusen: an early sign of occult choroidal neovascularization and chorioretinal anastomosis. Retina 23:741–751
Yoneyama S, Sakurada Y, Mabuchi F et al (2014) Genetic variants in the SKIV2L gene in exudative age-related macular degeneration in the Japanese population. Ophthalmic Genet 35:151–155
Caramoy A, Ristau T, Lechanteur YT et al (2014) Environmental and genetic risk factors for retinal angiomatous proliferation. Acta Ophthalmol 92:745–748
Tanaka K, Nakayama T, Yuzawa M et al (2011) Analysis of candidate genes for age-related macular degeneration subtypes in the Japanese population. Mol Vis 17:2751–2758
Hayashi H, Yamashiro K, Gotoh N et al (2010) CFH and ARMS2 variations in age-related macular degeneration, polypoidal choroidal vasculopathy, and retinal angiomatous proliferation. Invest Ophthalmol Vis Sci 51:5914–5919
Kondo N, Honda S, Kuno S, Negi A (2009) Coding variant I62V in the complement factor H gene is strongly associated with polypoidal choroidal vasculopathy. Ophthalmology 116:304–310
Goto A, Akahori M, Okamoto H et al (2009) Genetic analysis of typical wet-type age-related macular degeneration and polypoidal choroidal vasculopathy in Japanese population. J Ocul Biol Dis Inform 2:164–175
Cohen SY, Creuzot-Garcher C, Darmon J et al (2007) Types of choroidal neovascularisation in newly diagnosed exudative age-related macular degeneration. Br J Ophthalmol 91:1173–1176
Maruko I, Iida T, Saito M, Nagayama D, Saito K (2007) Clinical characteristics of exudative age-related macular degeneration in Japanese patients. Am J Ophthalmol 144:15–22
Liu Y, Wen F, Huang S, Luo G, Yan H, Sun Z et al (2007) Subtype lesions of neovascular age-related macular degeneration in Chinese patients. Graefes Arch Clin Exp Ophthalmol 245:1441–1445
Scott AW, Bressler SB (2010) Retinal angiomatous proliferation or retinal anastomosis to the lesion. Eye (Lond) 24:491–496
Smailhodzic D, Klaver CC, Klevering BJ et al (2012) Risk alleles in CFH and ARMS2 are independently associated with systemic complement activation in age-related macular degeneration. Ophthalmology 119:339–346
Maguire MG, Ying GS, Jaffe GJ et al (2016) Single-nucleotide polymorphisms associated with age-related macular degeneration and lesion phenotypes in the comparison of age-related macular degeneration treatments trials. JAMA Ophthalmol 1(134):674–681
Kortvely E, Hauck SM, Duetsch G et al (2010) ARMS2 is a constituent of the extracellular matrix providing a link between familial and sporadic age-related macular degenerations. Invest Ophthalmol Vis Sci 51:79–88
Wang G, Spencer KL, Court BL, Olson LM, Scott WK, Haines JL, Pericak-Vance MA (2009) Localization of age-related macular degeneration-associated ARMS2 in cytosol, not mitochondria. Invest Ophthalmol Vis Sci 50:3084–3090
Xu YT, Wang Y, Chen P, Xu HF (2012) Age-related maculopathy susceptibility 2 participates in the phagocytosis functions of the retinal pigment epithelium. Int J Ophthalmol 5:125–132
Hageman GS, Anderson DH, Johnson LV et al (2005) A common haplotype in the complement regulatory gene factor H (HF1/CFH) predisposes individuals to age-related macular degeneration. Proc Natl Acad Sci USA 102:7227–7232
Thakkinstian A, Han P, McEvoy M et al (2006) Systematic review and meta-analysis of the association between complement factor H Y402H polymorphisms and age-related macular degeneration. Hum Mol Genet 15:2784–2790
Tong Y, Liao J, Zhang Y, Zhou J, Zhang H, Mao M (2010) LOC387715/HTRA1 gene polymorphisms and susceptibility to age-related macular degeneration: a HuGE review and meta-analysis. Mol Vis. 16:1958–1981
Acknowledgements
The authors would like to acknowledge the support provided by Ophthalmic Research Center, Shahid Beheshti University of Medical Sciences, Tehran, Iran.
Author information
Authors and Affiliations
Corresponding author
Ethics declarations
Conflict of interest
The authors declare no conflict of interest.
Rights and permissions
About this article

Cite this article
Jabbarpoor Bonyadi, M.H., Yaseri, M., Bonyadi, M. et al. Association of ARMS2/LOC387715 A69S, CFH Y402H, and CFH I62V polymorphisms with retinal angiomatous proliferation compared with typical age-related macular degeneration: a meta-analysis. Int Ophthalmol 37, 1397–1409 (2017). https://doi.org/10.1007/s10792-016-0413-2
Received:
Accepted:
Published:
Issue Date:
DOI: https://doi.org/10.1007/s10792-016-0413-2