
Abstract
The aim of the study is to create a suitable map for wind energy projects in a rural area. The primary goal here is to show a methodology using automatic object extraction of the target classes of buildings, vegetation, and ground. The secondary goal is to identify the potential effects for wind turbine sites based on four criteria: Wind speed, Slope, Building, and Vegetation using the fuzzy analytical hierarchy process (FAHP). This paper discusses two important situations for wind energy projects. The first strategy is to just determine the best suitable site locations of wind turbines, while the second strategy determines the locations of wind turbines with minimal negative effects on the rural area. The proposed approach is tested using the data obtained from a multi-sensor system in Evrencik, Turkey. In preliminary phases of renewable energy projects, successful results are dependent on evaluating the potential site’s suitability with criteria such as social, environmental, physical, and economic conditions. Furthermore, an accuracy analysis is performed on the automatically extracted target classes for the study area, yielding a value of 89% in the remote sensing section of the study. Moreover, for the GIS section of the study, suitable and unsuitable areas are identified, and the suitability levels of the remaining areas are determined for the two strategies. According to the results, 11% of the areas are found to have high, moderate, and low suitability levels, and 89% are unsuitable for the first strategy, whereas these rates are, respectively, 2% and 98% for the second strategy.
Introduction
Energy is the main building block of all activities that are indispensable parts of modern life, especially for industry, technology, and communication. In meeting energy needs, it is highly important to preserve the livability of the planet, achieve sustainability, and find and improve energy resources that provide renewability. Nevertheless, the constantly increasing need for energy, limited, and exhaustible resources have led to searching and developing alternative energy resources that are sustainable and have high energy efficiency and low environmental impact. Wind-based energy production is among the newer and fast-developing types of renewable energy. Wind is an energy resource that is clean, does not lead to global warming, is renewable, and does not harm the environment or humans (Aydin et al. 2009). Easy installation, technological improvability and practicality, decreasing cost, and its natural occurrence in the atmosphere are among the reasons for this fast development and predomination of wind energy.
Scientists have conducted studies of wind energy usage, wind tribune site selection (Cicek 2015; Arcidiacono 2012), and suitability maps (Al-Shabeeb et al. 2016; Al-Ruzouq et al. 2018). Evaluations of economic, social, environmental, and physical criteria with certain weights and determining suitable and unsuitable areas based on this with multiple criteria have gained importance. There are two important steps in forming suitability maps. The first step is accurate collection of data by remote sensing and forming the right classes for the analysis of criteria. Especially regarding criteria for determining social and environmental effects, it is highly important to derive residential areas, buildings, and green areas. For this reason, the geographic information system (GIS) stage, which is the second step of forming suitability maps, is put in action at this point. Analyses and evaluations that are achieved by accurate and reliable data in the GIS environment are transformed into information, and successful results are ensured (Issa and Saleous 2018).
With the rapid growth of the world’s population, unregulated urbanization, land use conflicts, and resource exploitation, the need of local and national governments for data related to man-made and non-man-made objects is increasing day-by-day. In particular, extraction of objects such as buildings, vegetation, and ground is important in making critical decisions on planning and development in the governance of urban and rural regions within the shortest time and in the most accurate way. In recent years, the data obtained from a single sensor system such as from aerial photos using the photogrammetric method, RADAR, SAR, and satellite images, point clouds, and intensity data provided by light detection and ranging (LiDAR) scanning have been widely used in object extraction studies (Mao et al. 2009; García et al. 2011; Matikainen et al. 2017). The fusion method has begun to be used to eliminate the errors caused by the use of such data. A review of the studies by Haala and Brenner (1999), Sohn and Dowman (2007), Lee et al. (2008), Demir et al. (2009), Awrangjeb et al. (2010), Beger et al. (2011), Nex and Rinaudo (2011), and Moussa and El-Sheimy (2012) showed that they performed object extraction by the use of fusion of the datasets. Yet, object extraction by the use of the fusion method carries forward time- and resolution-related errors. Such errors negatively affect the accuracy of analyses in extracting objects such as buildings, vegetation, and ground.
With the advancement of technology, multi-sensor systems that are called LiDAR systems consisting of a LiDAR, digital camera, and Global Positioning System/Inertial Measurement Unit (GPS/IMU), where all of these are placed on the same platform, have emerged. A LiDAR system can eliminate the disadvantages of other, single sensor systems, particularly in terms of object extraction, playing a significant role in correcting errors related to data integration (time and different resolution). Besides, the data collected by the use of a LiDAR system have made the development of automatic and semi-automatic object capturing methods necessary (Baltsavias 1999; Rottensteiner et al. 2005; Lafarge et al. 2008). A review of the literature showed that automatic object extraction (Mao et al. 2009; Haala and Brenner 1999; Wegner et al. 2011; Benz et al. 2004; Du et al. 2017; Song et al. 2015; Ramiya et al. 2017) is a common topic of research. Gruen (2008), Kwak et al. (2012), and Gerke and Xiao (2014) proposed LiDAR systems to solve the current problems, emphasizing the advantages of working with multi-sensor system data. The data collected by this method are used for the purpose of solving the problems experienced in automatic object extraction and in the improvement of the accuracy of the target classes (Rottensteiner et al. 2005).
The object-oriented, rule-based classification method is preferred to eliminate the problem of class confusion in object extraction. In this method, target classes are first developed by establishing rules, and then accuracy values close to the reference values are produced with a class improvement process. The segmentation and classification steps of the object-based classification method are intended for easier identification of the differences among objects. Shirowzhan and Trinder (2017) compared the object-based classification method to support vector machine algorithms and established that classification by the use of support vector machines results in confusion of road and building classes, while a successful classification is achievable by using an object-based classification. Mongus et al. (2014) used a multi-scale data decomposition method to extract planar areas from LiDAR data. Awrangjeb et al. (2013) used a region growing method to eliminate class confusion in planar areas using LiDAR data. Awrangjeb et al. (2014) developed a rule-based object extraction approach based on the long border line of the building to eliminate the classes confused with the building’s borders.
In wind energy projects, the second important step in making the correct suitable place selection, forming the suitability map and minimizing negative effects on the environment is GIS usage. Determining the locations for energy projects is dependent on different technical, economic, and environmental criteria. In the analysis of these criteria by GIS, various multi-criteria decision-making (MCDM) techniques have been used so far. In analyses that are carried out with decision support systems, the methods of analytic hierarchy process (AHP) and fuzzy analytic hierarchy process (FAHP) are the most frequently preferred ones. AHP is a method based on pairwise comparisons that is used for prioritizing criteria in cases where there are multiple criteria (Saaty and Vargas 2012). In cases where there is no certainty, AHP falls short. As the superiority of criteria over each other does not pose certainty, it is possible to reach the correct results by using a FAHP. The criteria are weighed by Saaty’s 9-point relative importance weighting scale (Noorollahi et al. 2016).
Scientists have conducted GIS-supported studies in terms of topics such as suitable location analysis and suitability maps in wind energy projects. Ramirez-Rosado et al. (2008) designed a GIS-based decision support system for selection of locations for wind farms. While forming this system, people in different groups who had different preferences were considered. Accordingly, criterion maps were formed by the criterion values that were determined for each group of people. Tolerance maps that showed the most preferred locations for each group were created. With the decision support system, the most suitable location that may be accepted or tolerated by each group was determined. Yue and Yang (2009) assessed wind energy resources in Taiwan with the help of GIS. Their findings showed that open-air wind energy resources, which may form 94 to 98% of the total of wind resources in Taiwan, had an important role. Noorollahi et al. (2016) firstly extracted a map of unsuitable regions. Then, to identify the suitability of different regions, they defined criteria. They also determined the relative weights of the defined criteria and sub-criteria applied by the FAHP technique.
This paper used 3D point clouds and digital images that were collected through a multi-sensor system formed by a LiDAR, digital camera, and GPS/IMU placed on the same platform instead of a single sensor system. A different approach was utilized with these data sets by developing a rule set, using an object-oriented, rule-based classification method for automatic object extraction for the first step of the determination of a suitable map for wind energy. After the data were made usable for GIS, the FAHP method was used, and analyses were carried out by determining 4 criteria as Distance from building, Distance from vegetation, Slope, and Wind speed. These criteria were selected based on the most prevalent usage in the literature (Al-Shabeeb et al. 2016; Noorollahi et al. 2016; Effat 2017; Ayodele et al. 2018). These criteria were weighed by using two different strategies. Firstly, the weights were assigned by considering only the most suitable locations for wind turbines. In the second strategy, the weights were assigned by considering the aim to minimize the negative effects of wind turbines on the environment, especially residential areas. The suitability maps that were obtained as a result of different weights were for these two different purposes.
The remainder of this paper is organized as follows. A discussion of the methodology is presented in Sec. 2, followed by the characteristics of the study area and the dataset obtained by the multi-sensor system in Sec. 3. The results of the experiment are reported along with an accuracy assessment of the object extraction results and suitable map analyses in the “Results and discussion” section. The conclusions are stated in the “Conclusion” section.
Methodology
This study used remote sensing data and GIS analysis for a suitability map for wind energy projects. Data collection and creation of input layers from target classes are included in the first section of this study. Determination of the evaluation criteria and weights, analysis, and decision-making with a GIS model is presented in the second section of the study.
In the remote sensing section of the study, an object-based image analysis method was used. This method provides a system to capture objects such as buildings and vegetation by exploiting the distinctive properties of the images that are used, including shape, color, and texture. The segmentation method in object-based classification makes it possible to group target image classes in the same segments, while classification, which is the second step, allows organization of objects into classes. In this approach, segments representing objects are analyzed by the use of certain values, including those for shape, texture, adjacency, morphological relationships, surface area, height, distance, geometric figure, standard deviation, and density. After the segmentation process, objects are assigned to target classes. The classes that are generated are named as Building, Vegetation (forest area and green area defined as vegetation), Ground and Other, which also included undesired objects.
In the remote sensing section of the proposed method, automatic extraction of target classes is implemented in 3 steps (Fig. 1). In the first step, the ortho-image and LiDAR point cloud are processed, ready for use. In the second step, a rule set is developed with the analysis of segmentation, classification, and accuracy. In order to prevent misclassification, rule sets are developed for automatic object extraction. The multiple properties of each data point, including shape, texture, adjacency, morphological relationships, surface area, height, distance, geometric figure, standard deviation, and density are analyzed, and this process continues until proper values are obtained. The results providing proper values are placed as a separate rule in the rule set. Thus, whether or not the optimal rules that are produced may be applied in the study area could be tested. In this part, 3 different analyses are performed to develop a rule set. Firstly, the segmentation types of “multiresolution,” “contrast filter,” and “contrast split,” which are the most widely used segmentation analyses, are analyzed to determine the optimum parameters and best segmentation type. In the second part, the optimum parameters and classification types are determined using the fuzzy logic-based classification analyses of “larger than membership function,” “approximate Gaussian membership function,” and smaller than membership function”, which are the most widely used methods in segmentation analyses. The fuzzy logic method is an important decision-making tool in remote sensing applications that offers the ability to define uncertainties with a mathematical expression. In fuzzy classification, objects may be defined to have fuzzy memberships to separate the two classes with high accuracy. In the last part of the rule set development, an accuracy analysis is performed. Accuracy analysis, accompanied by sample area selection and Kappa analysis (Congalton and Green 2009), is among the best-known methods in the literature. Therefore, sample area selection (error matrix based on test and training area (TTA) mask) and Kappa analysis are performed for accuracy analyses. Additionally, the analyses of buildings before improvement with the rule set are compared with those after improvement with the rule set to determine the effects of the rule set on accuracy. In the last step, target classes are extracted using an original rule set.

Remote sensing step: automatic object extraction using LiDAR system data
In the GIS section of the proposed method, an AHP is utilized with fuzzy for creating a WES (wind energy system) suitability map. As shown in Fig. 2, the proposed methods are as follows: determine criteria, create AHP matrix fuzzification, determine criterion weights with FAHP, analysis, and decisions. The fuzzy analytic hierarchy process is used for spatial Multi-criteria evaluation (SMC). The analytic hierarchy process is based upon the construction of a series of pairwise comparison

GIS Step: WES suitability map workflow
matrices (PCMs) that are utilized by comparing all the criteria with one another. This method was proposed for the first time by Saaty (1980). The priority ranking of the PCMs is determined as seen in Table 1.
The fuzzy analytic hierarchy process emerged as a result of the integration of fuzzy theory into the analytic hierarchy process. As AHP does not cover uncertainties for personal decisions, this method was developed by utilizing the fuzzy logic approach. In order to use fuzzy theory, first, pairwise comparisons are expressed with linguistic terms as indicated in Table 2. Afterwards, the linguistic variables are transformed into triangular fuzzy numbers (TFN) (Noorollahi et al. 2016).
The pairwise contribution matrix for the fuzzy approach is shown in Eq. (1). Hereby, \( \overset{\sim }{d_{i\ j}^k} \), kth decision-maker’s preference through jth criterion-ith criterion indicates fuzzy triangular numbers.
If there are multiple decision-makers, each decision-maker’s preferences (\( \overset{\sim }{d_{i\ j}^k}\Big) \) are averaged and \( \overset{\sim }{d_{i\ j}} \) calculated as in Eq. (2).
Based on the averaged preferences, the pairwise contribution matrix is updated as in Eq. (3).
According to Buckley (1985), the geometric mean fuzzy comparison values for each criterion are calculated as in Eq. (4). Here, \( \overset{\sim }{r_i} \) represents the triangular values.
A vector is found by calculating all \( \overset{\sim }{r_i} \) values. The 1st power of the total vector is found. For incrementation, FTN is changed. To find the fuzzy weight of a criterion\( \left(\overset{\sim }{w_i}\right) \), all \( \overset{\sim }{r_i} \) values are multiplied by this inverse vector. The fuzzy weights of each criterion are calculated as in Eq. (5).
As \( \overset{\sim }{w_i} \)is still FTN, there is a need for de-fuzzification by using Eq. (6) with the center of area method proposed by Chou and Chang (2008).
Mi is not a fuzzy number. So, it must be normalized as in Eq. (7).
After finding the normalized weights of each criterion and its alternatives, scores are calculated for each alternative by multiplying each alternative weight with the relevant criteria (Akay et al. 2018). Accordingly, the option with the highest score is recommended to the decision-maker (Ayhan 2013).
Study area and data set
The data set used for testing the automatic extraction approach was obtained simultaneously using the multi-sensor system. The data set was captured by an Optech ALTM Gemini and Rollei P45 digital camera on a Cessna-type, fixed-wing plane over the region of Evrencik, Kırklareli, Turkey (Fig. 3). Study area is located on 41° 39′ 6″ N latitude, 27° 42′ 47″ E longitude. Selection of the Evrencik rural area as the study area was due to the fact that the area of the province is a part of the Evrencik Wind Power Plant Project. For this reason, evaluating the potential sites before the project is important. The test data consisted of LiDAR data and an ortho-image. The LiDAR data point clouds (X, Y, Z) with 5.6 points per m2 and the ortho-image with a GSD of 0.1 m were produced using the data set from the multi-sensor system (Fig. 4). GPS/IMU technology was integrated into the LiDAR for dataset pre-processing. GPS provided the coordinates of the LiDAR, while IMU provided the direction of the pulse. Detailed information about the multi-sensor system and the collected data is given in Table 3.

Study area

Study area datasets. a Ortho-image. b DSM
Results and discussion
Analysis of target classes for the study area
In this study, different data layers were utilized to determine the target classes (Table 4). Firstly, Vegetation class analyses were conducted in the study area. To determine the Vegetation class, the ortho-image was used by assigning a band weight of 1 to it. Contrast difference and multi-resolution segmentation analyses were used to determine which segmentation method was suitable for use on the ortho-image. In the first step, contrast difference segmentation analyses were performed for the Vegetation class. In the second step, multi-resolution segmentation analyses were conducted from the segmentation methods. As a result of the analyses, it was found that the segmentation method and parameters optimal for designation of a Vegetation class were those given by the multi-resolution segmentation method (scale 100; shape 0.5; compactness 0.5). These analyses showed that the objects representing vegetation, particularly trees and plants, could be captured with these parameters properly and in detail.
For classification, fuzzy logic with a normal distribution was chosen as the classification method as the reflectance values of the objects related to buildings, vegetation, ground, etc. were approximate values. This was aimed to distinguish the objects that were very close to each other but belonged to different classes. Here, threshold value analyses were carried out for the parameters to be used for classification analysis and performed by normal distributions using the fuzzy logic method. LiDAR reflectance properties were used to identify the Vegetation class. The ratio of the total of all pulse returns to the last pulse returns was used. The threshold analyses (all returns/last returns > 1.05, all returns/last returns > 1.1, all returns/last returns > 1.15, all returns/last returns > 1.2) revealed that a threshold parameter of > 1.15 was the optimal value for the classification analysis to be performed by normal distribution using the fuzzy logic method.
Within the scope of this project, the ground surface and the objects that were non-ground surfaces were discriminated to generate the Ground class. As LiDAR included the heights of objects, slope was used as an analytical parameter to discriminate the Ground class and buildings. For this reason, the slope image was obtained from the study carried out by Zevenbergen and Thorne (1987). This analysis method was based on the slope differences of objects. For slope analysis, contrast split segmentation was applied using the slope image. The analyses revealed class overlap as the reflectance values of the objects of the Ground and Building classes were very close. In order to solve this problem, it was considered appropriate to perform the segmentation in two stages. This made it possible to have more homogenous segments and more accurately capture the objects of the Ground and Building classes. For the first segmentation stage, slope threshold analyses (25 < threshold < 100, 10 < threshold < 50, 0 < threshold < 70) were performed using the slope image. Afterwards, the slope image was also used to perform analyses to determine the values for the second stage of segmentation (25 < threshold < 100, 10 < threshold < 50, 12 ≤ threshold ≤ 24). A value of 0 < threshold < 70 was determined to be optimal for the first stage of the contrast split segmentation, while a value of 12 ≤ threshold ≤ 24 was found optimal for the second stage.
Following the segmentation, analyses were performed to decide on the classification method for the Building and Ground classes. Fuzzy logic with a normal distribution was chosen as the classification method as the reflectance values of the objects of the Building and Ground classes were quite close. Thus, the objects belonging to the Building and Ground classes could be discriminated. Following the determination of the classification method, slope analyses were conducted for the parameters to be used for classification (slope < = 2.5, 2.5 < slope < 5, 2.6 < slope < 12). The slope image for the Ground class showed that a threshold value of 2.6 < slope < 12 was optimal for identification of the objects of the Ground class. A sub-class of “Building Border” was defined using the slope image to avoid the overlap of the Ground class and Building Borders. In the analyses performed for the parameters in the Building Border sub-class (slope ≥ 50, slope ≥ 42, slope ≥ 40), the optimal slope was calculated as slope ≥ 42.
In the analyses of the target classes, the rule set was further developed for the analyses of the Building class following the Ground class. The LiDAR multi-signal properties were used to identify the objects of the Building class. The ratio of the total of all returns to the last returns was used to identify the Building class. The analyses were performed to determine the optimal parameter for this ratio for the Building class (all returns/last returns ≥ 1.1, all returns/last returns ≥ 1.05, all returns/last returns = 1). In these analyses, the objects of the Ground class instead of those of the Building class were identified when the ratio of all returns/last returns (≥ 1.1) was examined. In another analysis (all returns/last returns ≥ 1.05), the Building class and the Ground class were overlapped. Additionally, an examination of the analysis resulting from the ratio of all returns/last returns (= 1) showed that most of the buildings were captured, except for buildings with concrete roofs. The analyses revealed that the optimal ratio for the Building class was all returns/last returns = 1.
Considering the results of these analyses performed for determination of the target classes, rule sets and parameters were defined for the proposed approach. The rules and parameters that were defined are presented in detail in the “The rule set” section.
The rule set
An analysis of the structure of the buildings existing in the study area revealed that non-flat roof types with different structures, concrete roofs, barns, console balconies, small storerooms, wooden houses, adobe houses, etc. were present due to the rural nature of the area. This caused certain problems in generating the Building class properly. These misclassification problems were solved using the slope analysis, morphological filters, relational class property, find enclosed by class (related border to class), and region growing methods. Furthermore, the ortho-image was used only in the segmentation mode for identification of the Vegetation class as the reflectance values for the Vegetation, Building, and Ground classes were very close in the ortho-image of the study area.
In this study, the Vegetation class was generated as the first stage of developing the data set. At the segmentation stage of the process of generating the Vegetation class, multi-resolution segmentation parameters were used. At this stage of classification, the ratio of all returns/last returns (≥ 1.15), which was found by the result of the analyses performed using the LiDAR properties, was determined to be optimal and preferred for use. Additionally, efforts were made to improve the Vegetation class. The classification of objects representing vegetation in the elevated area was made using the value of the digital surface model (DSM) ≥ 403 m, as there were no man-made objects above a DSM of 403 m. Finally, the improvement process of the Vegetation class was completed using the method of the Visible-Band Difference Vegetation Index (VDVI) (VDVI ≥ 0.335). VDVI is defined by and derived from the formula by Wang et al. (2015). The VDVI formula is shown in Eq. (8) where G, R, and B denote the pixel values of ortho-image green, red, and blue bands, respectively.
As the second step of developing the rule set, the Ground class was targeted. Contrast split segmentation (12 ≤ slope ≤ 24) was applied to the slope image to identify the objects belonging to the Ground class. After this, objects were assigned to the Ground class using the parameter of 2.6 < Slope < 12. Furthermore, at this stage, the sub-class of Building Border was defined. The sub-class of Building Border was defined to avoid confusion of the objects belonging to the Ground class and those belonging to the Building Border class. Objects were assigned to the sub-class of Building Border by use of the analysis value of Slope ≥ 42.
An examination of the study area performed at this stage showed that certain objects that belonged to the Ground class were not being captured. To solve this problem, area and merge region operations were used with optimal parameters. In improving the Ground class, firstly, the unclassified image was used, and objects were assigned to the Ground class with a value of area ≤ 410. Secondly, the Ground class was improved by using the Building border sub-class through the merge area operation. In addition to the aforementioned procedures, objects were assigned to the Ground class using the value of area ≤ 3000 for the Building border and Unclassified class objects. Finally, the objects of the Ground class were merged. The resulting image for the Ground class is shown in Fig. 5b. The last stage of the development of the rule set was constructing the Building class. The slope image and LiDAR point cloud were used to identify the objects belonging to the Building class. Object assignment to the Building class was followed by a merge operation which was used to merge the segments that were close to but independent from each other. After the objects were assigned from the target classes to the Building class, modifications were made in the rule set to improve the Building class. Firstly, the objects representing the Building border sub-class but being confused with the Building class were identified. For this purpose, the objects of the Building border sub-class with the LiDAR properties of all returns/last returns (1) and area (> 2200) were identified and assigned to the Building class. Finally, the process of improving the Building class was completed by using the method of find enclosed by class (related border to class) and the area parameter (> 500). The resulting image for the Building class is shown in Fig. 5c.

Classification. a Vegetation class. b Vegetation and Ground classes. c Building, Vegetation, and Ground classes
Accuracy analysis for the study area
Sample area selection (error matrix based on TTA mask) and Kappa analysis were performed to test the accuracy of the proposed approach. Error matrix is a square array of numbers set out in rows and columns that expresses the number of sample units assigned to a particular category in one classification relative to the number of sample units assigned to a particular category in another classification (Congalton and Green 2009). TTA can be imported into software either by manually selecting them or by means of the so-called TTA mask. Image objects which function as samples for a nearest neighbor are referred to as samples or sample objects. (eCognition Elements User Guide 2004). For this reason, the same dataset was used for all classes in the accuracy analysis process. These analyses were conducted before and after class improvement to detect the improvements made on the target classes. The pre-improvement overall accuracy and Kappa coefficients for the study area were found to be 0.69 and 0.53, respectively (Table 5). The post-improvement overall accuracy and Kappa coefficients were found to be 0.88 and 0.74, respectively (Table 6). As a result of the improvement, the overall accuracy for the study area was increased by 19%.
Determination of the criteria for the GIS model
Preparing the suitability map of target classes plays a crucial role in decision-making for future studies when socio-cultural and economic strategies are considered. The most prominent point that distinguishes this study from others is the positive contribution of building and vegetation criteria which are used for GIS analysis for the accuracy of suitability maps. Other important point is assessment of the data obtained from new technology multi-sensor systems using object-oriented image analysis methods. This way, using 3D LiDAR data and ortho-image, which is obtained from the same platform, enables conduction of high-accuracy data analyses. As a result, automatic target classes are extracted by using these data with the suggested method, and they are ready to use for the decision support system. In this study, the aim of the first strategy was to determine the best suitable site locations for wind turbines, while the aim of the second strategy was to determine the wind turbines’ places with the minimum negative effects for the rural area while considering social and environmental effects. The same criteria were utilized for the two strategies. These criteria were as follows (Al-Shabeeb et al. 2016):
-
Distance from building: Land uses and residential areas are important for environmental and socio-economic reasons.
-
Distance from vegetation: It is also important not to damage the environment, mainly the wild life (flora and fauna).
-
Slope: Areas with high slope will generate more runoff. Additionally, high slopes cause technical difficulties while installing wind turbines.
-
Wind speed: Wind turbines depend on having enough wind speed to rotate wind turbine blades to generate electricity. The speed limit that is suitable for wind turbines is 6.5 m/s. For the data of the studied area, this speed was over 7 m/s (Fig. 6).
Fig. 6 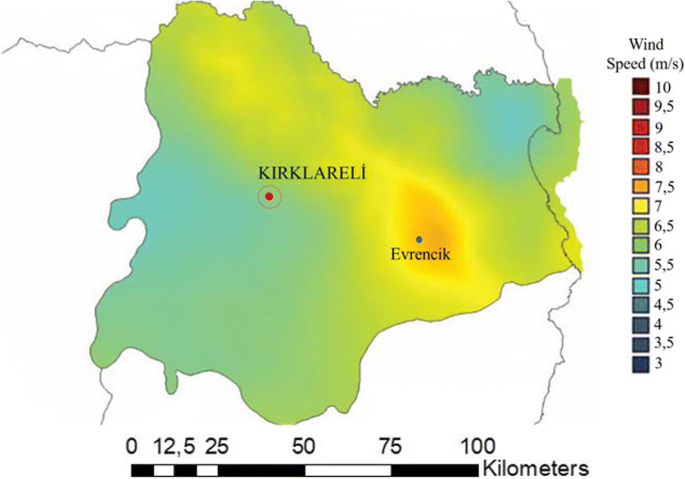
Wind speed

Table 7 shows the parameters about these criteria in detail. It was seen in the literature that the criterion of noise has been prevalently used in research. Due to the fact that noise is effective around a radius of 30 to 50 m in the case of wind turbines developed by modern technology, the criterion of noise was considered in this study while assigning weight to the criterion of Distance from building.
GIS analysis and decisions
GIS models were established based on the two different strategies for the study area. Firstly, a fuzzy pairwise comparison matrix was formed based on degrees of priority. In the second step, the fuzzy geometric mean values of the criteria were calculated with the help of this matrix. Then, the weights of the criteria were determined with the help of these mean values. Using the determined suitability values, suitability maps were formed for each criterion. In the last step, separate suitability maps were created for the two different strategies by combining the individual maps based on the obtained weights. For the first strategy, distance and slope analyses were carried out based on the values in Table 7. Additionally, the degrees of priority for the criteria in the fuzzy pairwise comparison matrix given in Table 8 against each other were determined. Accordingly, for determining the optimal wind turbine location, the rank of priority was taken as Wind speed, Slope, Distance from vegetation, and Distance from buildings. While Table 9 shows the geometric mean values calculated for the first strategy, Table 10 presents the weights that were determined. For the second strategy, the degrees of priority for the criteria in the fuzzy pairwise comparison matrix given in Table 11 against each other were determined. Accordingly, for determining the wind turbine locations with the minimum negative effects for the rural area, the rank of priority was taken as Wind speed, Distance from vegetation, Distance from buildings, and Slope. While Table 12 shows the geometric mean values calculated for the second strategy, Table 13 presents the weights that were determined. In the case that the total weight of a criterion is not equal to 1 because of rounding errors, the weights must be normalized so that the sum of these becomes 1. No normalization was made in this study as the sums of all weights were equal to 1 for both strategies.
The map of Distance from buildings is given in Fig. 7a, the map of Distance from vegetation is given in Fig. 7b, and the map for slope is given in Fig. 7c. Figure 8 shows the suitability maps that were created as a result of the analyses. While the areas that are marked with a red color represent unsuitable areas in these maps, green ones represent suitable areas. According to the results, 11% of these areas was found to have high, moderate, or low suitability levels, while 89% was unsuitable for the first strategy. For the second strategy, in the study area, 2% of the areas was found to have high, moderate, or low suitability levels, while 98% was unsuitable. Accordingly, it was determined that suitability in our study area decreased by approximately 9% when social and environmental factors were considered.

Analyses. a Distance to Building. b Vegetation. c Slope

Suitability map. a First strategy. b Second strategy
Conclusions
In this study, a unique approach was developed for creating a suitability map for wind energy projects using LiDAR system data and GIS. First of all, this approach included automatic extraction of the target classes of building, vegetation, and ground through an object-oriented, rule-based classification method using the data generated by a multi-sensor system consisting of a LiDAR, digital camera, and GPS/IMU placed on the same platform. In developing this part of the approach, automatic object extraction was performed using multi-sensor system data and different classification methods, and the results were analyzed for accuracy. The second part of this approach involved determining the evaluation criteria and weights, analysis, and decision-making with GIS models. Using the method of FAHP, suitability analyses were carried out by considering the criteria of Slope, Distance to buildings, Distance to vegetation, and Wind speed. Two different strategies were used to weigh these criteria. Firstly, the weights were assigned by only considering the most suitable placement of wind turbines. In the second strategy, the weights were determined by aiming to minimize the effects of wind turbines on the environment, especially residential areas. As a result of using different weights for these two different objectives, the suitability maps were evaluated.
A LiDAR data set from a flight over the study area in Kırklareli, Turkey, was used for the study. From this data set, the Vegetation class was successfully generated using the pulse returns, which is an advantage of LiDAR data. Additionally, DSM data were used as elevation data for the study area. DSM data were used in successfully generating the Vegetation class based on the ratio of the pulse returns, which is an advantage of the LiDAR sensor. The different types of houses in rural areas (typical pitched roof houses, concrete roof houses, wooden houses, adobe houses, barns, etc.) made it difficult to extract buildings. For this reason, some of the buildings could not be extracted. Other buildings were assigned to the Building class by use of different digital image processing algorithms and a fuzzy logic classification method while improving the Buildings class. Analyses and evaluations were performed for the segmentation and classification with this data set, problems encountered in object extraction were identified, solutions for such problems were proposed and implemented, and the rule set was developed using an object-oriented, rule-based classification method. TTA mask and Kappa analysis were performed to test the accuracy of the proposed approach. These analyses were performed before and after class improvement to detect the improvements made to the target classes. We found that, as a result of the improvement, the overall accuracy for the study area was increased by 19%.
At the GIS stage, a fuzzy analytical hierarchy process was utilized to identify the potential effects of the wind turbine sites based on four criteria: Wind speed, Slope, Building, and Vegetation. Two important situations for the wind energy project were analyzed. The first strategy was to determine only the best suitable site locations for wind turbines, and the second strategy was to determine the wind turbines’ places with minimal negative effects for the rural area. At this point, different weights were assigned to the layers based on importance. As a result of the analysis of the suitability maps that were obtained, it was determined that suitability in our study area decreased by approximately 9% when social and environmental factors were considered.
As a result of this study, while determining the suitability of wind maps with the proposed methodology, it is believed to be important to use modern LiDAR system data, automatically extract building and vegetation layers using the developed rule set and utilize these layers in forming a GIS model. Additionally, it was observed that social and environmental effects showed significant variety in the criteria that were formed by considering these layers. Accordingly, by using the FAHP method especially for the evaluated criteria and their weights, more accurate results were obtained from the suitability maps that were the end products.
References
Akay, A. O., Demir, M., & Akgul, M. (2018). Assessment of risk factors in forest road design and construction activities with fuzzy analytic hierarchy process approach in Turkey. Environmental Monitoring and Assessment, 190(9), 561.
Al-Ruzouq, R., Shanableh, A., Omar, M., & Al-Khayyat, G. (2018). Macro and micro geo-spatial environment consideration for landfill site selection in Sharjah, United Arab Emirates. Environmental Monitoring and Assessment, 190(3), 147.
Al-Shabeeb, A. R., Al-Adamat, R., & Mashagbah, A. (2016). AHP with GIS for a preliminary site selection of wind turbines in the north west of Jordan. International Journal of Geosciences, 7, 1208–1221.
Arcidiacono, S. A. (2012). GIS-based site potential analysis for small-scale wind power plants. Bachelor Thesis. Carinthia University of Applied Sciences School of Geoinformation and Environmental Technologies.
Awrangjeb, M., Ravanbakhsh, M., & Fraser, C. S. (2010). Automatic detection of residential buildings using LIDAR data and multispectral imagery. ISPRS Journal of Photogrammetry and Remote Sensing, 65(5), 457–467.
Awrangjeb, M., Zhang, C., & Fraser, C. S. (2013). Automatic extraction of building roofs using LIDAR data and multispectral imagery. ISPRS Journal of Photogrammetry and Remote Sensing, 83, 1–18.
Awrangjeb, M., Lu, G., & Fraser, C. (2014). Automatic building extraction from LiDAR data covering complex urban scenes. The International Archives of Photogrammetry, Remote Sensing and Spatial Information Sciences, 40(3), 25.
Aydin, N. Y., Kentel, E., & Duzgun, S. (2009). GIS-based environmental assessment of wind energy systems for spatial planning: a case study from Western Turkey. Renewable and Sustainable Energy Reviews, 4, 364–373.
Ayhan, M. B. (2013). A fuzzy AHP approach for supplier selection problem: a case study in a Gear motor company. arXiv preprint arXiv:1311.2886.
Ayodele, T. R., Ogunjuyigbe, A. S. O., Odigie, O., & Jimoh, A. A. (2018). On the most suitable sites for wind farm development in Nigeria. Data in Brief, 19, 29–41.
Baltsavias, E. P. (1999). A comparison between photogrammetry and laser scanning. ISPRS Journal of photogrammetry and Remote Sensing, 54(2-3), 83–94.
Beger, R., Gedrange, C., Hecht, R., & Neubert, M. (2011). Data fusion of extremely high resolution aerial imagery and LiDAR data for automated railroad centre line reconstruction. ISPRS Journal of Photogrammetry and Remote Sensing, 66(6), S40–S51.
Benz, U. C., Hofmann, P., Willhauck, G., Lingenfelder, I., & Heynen, M. (2004). Multi-resolution, object-oriented fuzzy analysis of remote sensing data for GIS-ready information. ISPRS Journal of photogrammetry and remote sensing, 58(3-4), 239–258.
Buckley, J. J. (1985). Fuzzy hierarchical analysis. Fuzzy sets and systems, 17(3), 233–247.
Chou, S. W., & Chang, Y. C. (2008). The implementation factors that influence the ERP (enterprise resource planning) benefits. Decision support systems, 46(1), 149–157.
Cicek Oz, C. (2015). Examining the site selection of wind power plants in Turkey in time: a GIS/spatial statistics-based approach. Master of Science Thesis, Dokuz Eylul University, Graduate School of Natural and Applied Sciences.
Congalton, R. G., & Green, K. (2009). Assessing the accuracy of remotely sensed data: principles and practices. CRC press.
Demir, N., Poli, D., & Baltsavias, E. (2009). Detection of buildings at airport sites using images & LiDAR data and a combination of various methods. In Proceedings of ISPRS Workshop CMRT09 on Object Extraction for 3D City Models, Road databases and traffic monitoring-concepts, algorithms and evaluation, Paris, France (pp. 3-4).
Du, S., Zhang, Y., Zou, Z., Xu, S., He, X., & Chen, S. (2017). Automatic building extraction from LiDAR data fusion of point and grid-based features. ISPRS Journal of Photogrammetry and Remote Sensing, 130, 294–307.
eCognition Elements User Guide (2004) Definiens Imaging, München, Germany
Effat, H. A. (2017). Mapping potential wind energy zones in Suez Canal Region, using satellite data and spatial multicriteria decision models. Journal of Geoscience and Environment Protection, 5(10), 46–61.
García, M., Riaño, D., Chuvieco, E., Salas, J., & Danson, F. M. (2011). Multispectral and LiDAR data fusion for fuel type mapping using support vector machine and decision rules. Remote Sensing of Environment, 115(6), 1369–1379.
Gerke, M., & Xiao, J. (2014). Fusion of airborne laser scanning point clouds and images for supervised and unsupervised scene classification. ISPRS Journal of Photogrammetry and Remote Sensing, 87, 78–92.
Gruen, A. (2008). Reality-based generation of virtual environments for digital earth. International Journal of Digital Earth, 1(1), 88–106.
Haala, N., & Brenner, C. (1999). Extraction of buildings and trees in urban environments. ISPRS Journal of Photogrammetry and Remote Sensing, 54(2-3), 130–137.
Issa, S., & Saleous, N. (2018). Modeling the environment with remote sensing and GIS: applied case studies from diverse locations of the United Arab Emirates (UAE). In Geographic Information Systems. IntechOpen Press.
Kwak, E., Al-Durgham, M., & Habib, A. (2012). Automatic 3D building model generation from LiDAR and image data using sequential minimum bounding rectangle. International Archives of the Photogrammetry. Remote Sensing and Spatial Information Sciences, 39, B3.
Lafarge, F., Descombes, X., Zerubia, J., & Pierrot-Deseilligny, M. (2008). Automatic building extraction from DEMs using an object approach and application to the 3D-city modeling. ISPRS Journal of photogrammetry and remote sensing, 63(3), 365–381.
Lee, D. H., Lee, K. M., & Lee, S. U. (2008). Fusion of LiDAR and imagery for reliable building extraction. Photogrammetric Engineering & Remote Sensing, 74(2), 215–225.
Mao, J., Liu, X., Zeng, Q (2009). Building extraction by fusion of LIDAR data and aerial images. In Proceedings of the IEEE Urban Remote Sensing Joint Event, São José dos Campos, SP, Brazil, May, 1–5.
Matikainen, L., Karila, K., Hyyppä, J., Litkey, P., Puttonen, E., & Ahokas, E. (2017). Object-based analysis of multispectral airborne laser scanner data for land cover classification and map updating. ISPRS Journal of Photogrammetry and Remote Sensing, 128, 298–313.
Mongus, D., Lukač, N., & Žalik, B. (2014). Ground and building extraction from LiDAR data based on differential morphological profiles and locally fitted surfaces. ISPRS Journal of Photogrammetry and Remote Sensing, 93, 145–156.
Moussa, A., & El-Sheimy, N. (2012, July). A new object based method for automated extraction of urban objects from airborne sensors data. In Proceedings of: XXII ISPRS Congress, Melbourne, Australia, XXXIX-B3, 309, 314.
Nex, F., & Rinaudo, F. (2011). LiDAR or photogrammetry? Integration is the answer. Italian Journal of Remote Sensing, 43(2), 107–121.
Noorollahi, E., Fadai, D., Akbarpour Shirazi, M., & Ghodsipour, S. H. (2016). Land suitability analysis for solar farms exploitation using GIS and fuzzy analytic hierarchy process (FAHP)—a case study of Iran. Energies, 9(8), 643.
Ramírez-Rosado, I. J., García-Garrido, E., Fernández-Jiménez, L. A., Zorzano-Santamaría, P. J., Monteiro, C., & Miranda, V. (2008). Promotion of new wind farms based on a decision support system. Renewable Energy, 33(4), 558–566.
Ramiya, A. M., Nidamanuri, R. R., & Krishnan, R. (2017). Segmentation based building detection approach from LiDAR point cloud. The Egyptian Journal of Remote Sensing and Space Science, 20(1), 71–77.
Rottensteiner, F., Summer, G., Trinder, J., Clode, S., & Kubik, K. K. T. (2005). Evaluation of a method for fusing LIDAR data and multispectral images for building detection. In Joint workshop of ISPRS and DAGM-CMRT05 (Vol. 36, No. Part 3/W24, pp. 15-20). ISPRS.
Saaty, T. L. (1980). The analytical hierarchy process, planning, priority. Resource Allocation. USA: RWS Publications.
Saaty, T. L., & Vargas, L. G. (2012). Models, methods, concepts & applications of the analytic hierarchy process (Vol. 175). Springer Science & Business Media.
Shirowzhan, S., & Trinder, J. (2017). Building classification from LiDAR data for spatio-temporal assessment of 3D urban developments. Procedia Eng, 180, 1453–1461.
Sohn, G., & Dowman, I. (2007). Data fusion of high-resolution satellite imagery and LiDAR data for automatic building extraction. ISPRS Journal of Photogrammetry and Remote Sensing, 62(1), 43–63.
Song, J., Wu, J., & Jiang, Y. (2015). Extraction and reconstruction of curved surface buildings by contour clustering using airborne LiDAR data. Optik-International Journal for Light and Electron Optics, 126(5), 513–521.
Wang, X., Wang, M., Wang, S., & Wu, Y. (2015). Extraction of vegetation information from visible unmanned aerial vehicle images. Nongye Gongcheng Xuebao/Transactions of the Chinese Society of Agricultural Engineering, 31(5), 152–159.
Wegner, J. D., Hänsch, R., Thiele, A., & Soergel, U. (2011). Building detection from one orthophoto and high-resolution InSAR data using conditional random fields. IEEE Journal of selected topics in applied Earth Observations and Remote Sensing, 4(1), 83–91.
Yue, C. D., & Yang, M. H. (2009). Exploring the potential of wind energy for a coastal state. Energy Policy, 37(10), 3925–3940.
Zevenbergen, L. W., & Thorne, C. R. (1987). Quantitative analysis of land surface topography. Earth surface processes and landforms, 12(1), 47–56.
Acknowledgments
The authors wish to thank BİRLİK HARİTA Ltd. and Sinan Altınışık for providing the data set.
Funding
This study was supported by the Research Fund of Yıldız Technical University (Project Number: 2014-05-03-GEP01).
Author information
Authors and Affiliations
Corresponding author
Additional information
Publisher’s note
Springer Nature remains neutral with regard to jurisdictional claims in published maps and institutional affiliations.
Rights and permissions
About this article

Cite this article
Uzar, M., Şener, Z. Suitable map analysis for wind energy projects using remote sensing and GIS: a case study in Turkey. Environ Monit Assess 191, 459 (2019). https://doi.org/10.1007/s10661-019-7551-8
Received:
Accepted:
Published:
DOI: https://doi.org/10.1007/s10661-019-7551-8