
Abstract
Curriculum documents for mathematics emphasise the importance of promoting depth of knowledge rather than shallow coverage of the curriculum. In this paper, we report on a study that explored the analysis of junior secondary mathematics textbooks to assess their potential to assist in teaching and learning aimed at building and applying deep mathematical knowledge. The method of analysis involved the establishment of a set of specific curriculum goals and associated indicators, based on research into the teaching and learning of a particular field within the mathematics curriculum, namely proportion and proportional reasoning. Topic selection was due to its pervasive nature throughout the school mathematics curriculum at this level. As a result of this study, it was found that the five textbook series examined provided limited support for the development of multiplicative structures required for proportional reasoning, and hence would not serve well the development of deep learning of mathematics. The study demonstrated a method that could be applied to the analysis of junior secondary mathematics in many parts of the world.
1 Introduction
One of the aims of the new national curriculum currently being implemented in Australia is that it seeks to “encourage the development of important ideas in more depth, and the interconnectedness of mathematics concepts” (National Curriculum Board, 2009, p. 8). This vision is not dissimilar to previous individual state syllabuses that emphasised mathematics as the study of patterns and relationships, the importance of students learning mathematics through an investigative approach and problem solving, and a curriculum that promoted appreciation of the power and beauty of mathematics (e.g. Queensland Studies Authority, 2004); which are all themes echoed in mathematics curricula in many other countries (e.g. USA, National Council of Teachers of Mathematics (NCTM), 2000; The Netherlands, Van den Heuvel-Panhuizen, 2000; UK, Department for Education and Employment (DfE), 1999).
In this paper, we report on a project that explored the potential of existing school mathematics textbooks to support these advocated approaches to mathematics learning, and particularly the stated emphasis of interconnectedness and deep learning within the new Australian Curriculum document. Whilst it is acknowledged that textbook publishers in Australia are currently updating their materials in relation to the new mathematics curriculum, current textbooks should be reflective of both current and previous stated syllabus goals and vision. This project involved the development of a process for the assessment of the textbooks and the application of that process to popular junior secondary mathematics textbooks used in schools in one particular state of Australia.
With the advent of a new curriculum, expectations run high in the mathematics education community that mathematics reform in the classroom will be advanced. It has been suggested that mathematics education reform will advance considerably if schools rid themselves of mathematics textbooks, yet in the Netherlands, the textbook is seen as a key for improvement in mathematics education (Van den Heuvel-Panhuizen, 2000). This is because mathematics textbooks are seen as “the most important tools in guiding teachers’ teaching” (ibid, p. 10). In our analysis reported here, we focus on the textbook as a major teaching tool. Our analysis raises questions about the type of mathematics education students will experience if teaching is based predominantly on the textbook. We anticipate future analyses of the materials developed for the new curriculum when they become available, but our intention is that the process may be applied to mathematics teaching materials in other contexts.
1.1 School mathematics textbooks
In secondary schools, the study of school mathematics is typically supported by textbooks, with each student having a copy of the prescribed text in their possession for the duration of the school year. The selected mathematics textbook then is an integral part of teaching and learning mathematics in the secondary school years. Studies have shown that the majority of mathematics teachers in secondary schools follow the prescribed textbook when planning and implementing their mathematics programs (Thomson & Fleming, 2004). The presentation of the content and exercises, as well as the overall sequence of topics over the year of study, appears to provide the main basis for the curriculum enacted in a school. However, textbooks have been found to fall short in terms of the way they holistically embrace the scope of national curricula. In a study of mathematics textbooks from China, Singapore and the USA, Fan and Zhu (2007) observed “that there existed considerable gaps between national syllabuses/curriculum standards and the textbooks developed following on these documents” (p. 72). However, Remillard (2000) analysed the use of the set textbook by two teachers, noting that “their reading was selective and interpretative. They read different parts of the text and drew on their own perceptions to make meaning of what they read” (p. 336). Although the relationships between the textbook and the teachers and students are complex, textbooks have sometimes been described as the “de facto curriculum” (Budiansky, 2001).
Howson (2005) studied a range of European, Asian and North American mathematics textbooks. He noted that most are “unified texts” (p. 19) that include the full range of mathematics topics for a course, rather than the separate algebra and geometry books used in the past, especially in the USA. Howson observed that the mathematical topics in the textbooks were presented in “what too frequently appears a random manner” (p. 19), with a lack of overall structure and obvious links among the topics. Vincent and Stacey (2008) used criteria from The TIMSS Video Study to examine a range of Australian eighth-grade mathematics textbooks. Their focus was on the exercises and problems that the books provided for students, in a re-examination of the “shallow teaching syndrome” (Stacey, 2003). Vincent and Stacey argued that textbooks should present a range of problems that help students make connections and recognise mathematical concepts, as well as stimulating mathematical reasoning and reflection. They found that in some of the best-selling books, “the balance is too far towards repetitive problems of low procedural complexity that require little more than using procedures” (p. 102). They also noted that this was a concern when teachers rely heavily on the textbook, such as beginning teachers and others without a strong mathematical background.
Considerable research into mathematics textbooks as artefacts in the teaching and learning situation has resulted in strong theoretical frameworks for considering interactions between the teacher, the students, the textbook and mathematics itself (e.g. Straesser, 2009; Rezat, 2009). Straesser (2009) has described the basis of such theoretical frameworks in relation to the need for representations, or artefacts (such as base ten blocks, abaci, computer software, textbooks) to make mathematics accessible, which are “the necessary ingredients for the teaching and learning of mathematics” (p. 67). More recently, Straesser (2012) has reiterated the limitations of analysing artefacts, particularly textbooks, from a content-only perspective, without considering how the textbooks are used by teachers and learners. This then becomes part of the realm of instrumental genesis where the artefact “is turned into an ‘instrument’ via the genesis of individual or social utilisation schemes” (p. vi). An instrument is a mixed entity, comprising the artefact and utilisation schemes, and instrumental genesis relates to how “the user learns to pursue certain goals with the help of artefacts” (Straesser, 2009, p. 73).
According to Rezat (2009), “mathematics textbooks should not be a subject to analysis detached from its use” (p. 1260), and the following tetrahedron model (see Fig. 1) has been used to represent the interaction between the textbook, student, teacher and mathematical knowledge.

Tetrahedron model of textbook use (Rezat, 2009, p. 1261)
Using this model, Rezat described textbook use by teachers and students as follows:
The mathematics textbook is implemented as an instrument on all three sides of the triangle: teachers use textbooks in the lesson and to prepare their lessons, by using the textbook in the lessons, teachers also mediate textbook use to students, and finally students learn from textbooks. (p. 1261)
The study of Rezat (2009) explored students’ use of mathematics textbooks and found that students’ action goals (utilisation schemes) related predominantly to locating worked examples which they could follow to complete given exercises and tasks, and that they looked ahead through the text to orient themselves to forthcoming topics of study. Rezat commented that students’ actions rarely indicated that they wanted to derive deep meaning from the texts, but rather wanted to work through the exercises given, applying routines and rules. Rezat’s study contributes to instrumental genesis in relation to students’ use of textbooks. However, Rezat, citing Valverde et al. (2002), has acknowledged that the structure of mathematics textbooks impacts actual classroom instruction as particular pedagogical approaches are presented. Schmidt (2012) has advanced a methodology for measuring content through textbooks in relation to their potential in providing opportunities for students to learn mathematics. According to Schmidt:
How textbooks are designed provides a window into the nature of the mathematics that students are expected to learn. They characterise not only the content but also advocate what students are to be able to do with that content—what mathematical behaviours are to be encouraged. (p. 143)
In this study, we aimed to assess the potential of textbooks to support the teacher in providing in-depth learning of mathematics. We built our approach to analysing the textbooks from the methods reported by Project 2061 (American Association for the Advancement of Science, 2009). The approach involves the creation of a set of specific learning goals that are used as criteria to assess the materials. As a modification of the Project 2061 approach, we sought to increase the focus on the mathematical knowledge itself by analysing in one key area of the middle-years mathematics curriculum, namely the topic of ratio, rate and proportion. This topic area was chosen because of its importance in the curriculum, its potential for demonstrating in-depth connected learning and the extensive research to inform the teaching of the topic. This research is summarised briefly below, together with a general characterisation of what it means to learn mathematics in depth.
2 Developing deep and connected knowledge
Traditional approaches to teaching mathematics, as outlined by Bell (1993), predominantly concentrate on teaching a method of problem solution and then providing students with the opportunity to apply the method to a range of problem situations of similar context. To support the development of connected knowledge and rich conceptual understanding in mathematics, Bell (1993) advocated that mathematics learning opportunities should be carefully designed to enable students to develop understanding of the structure of mathematical problems. This enhances students’ capacity to transfer their mathematical knowledge to unfamiliar, but related contexts. As stated by Bell, “there should be extensive exploration of the structural relations within one familiar context, then repetitions of the study in another familiar context, as learners look for signs that the structural aspects are the same” (p. 13).
The importance of developing students’ understanding of structure links with the emphasis of Vergnaud (1983) on mathematics teaching within conceptual fields, where learning experiences must provide students with competencies for immediate use, but also support future learning within that same conceptual field. A major conceptual field within the school mathematics curriculum is that of multiplicative structures. Multiplication and division fall within this conceptual field, as do the rational number topics of fractions, decimals, ratios, rates, proportion and percent. Vergnaud argued the importance of building students’ understanding of the multiplicative structures in these topics “so that all these different meanings are synthesised into the concept of rational number” (p. 158). When considering the extent of the conceptual field linked by multiplicative structures, the importance of teaching for connectedness is underscored. Each topic linked by multiplicative structures is a considerable research field in its own right. This also was highlighted by Vergnaud, who commented on the long-term nature of the study of multiplicative structures.
A ratio is a multiplicative comparison between two entities in a situation. To promote understanding of ratio and proportion is to foster students’ proportional reasoning. Proportional reasoning is being able to make comparisons between the entities in ratio and proportion situations in multiplicative terms (Behr et al., 1992). Vergnaud (1983) provided a comprehensive analysis of proportion through his exploration of the conceptual field of multiplicative structures. His work was on the basis that “the conceptual field of multiplicative structures consists of all situations that can be analysed as simple and multiple proportional problems and for which one usually needs to multiply and divide” (p. 141). The structure of proportion situations, according to Vergnaud (1983), is the relationship between the two components of comparison, which he termed the “measure-spaces”. For example, in considering the ratio of concentrate to water in fruit juice mixes, two components (concentrate and water) are being compared. When considering the relationship between these two components, two types of analyses can occur: a “between” and a “within” analysis. A between analysis is a consideration of the multiplicative relationship that links the two measure spaces. A within analysis occurs when considering a new quantity in the same proportion.
The following situation is used to show the different methods of analyses:
A juice mix is made with one part of concentrate for every five parts of water. How much water needs to be mixed with 40 mL of concentrate to make a drink of the required strength?
A between analysis shows that the amount of water is five times the amount of concentrate. A within analysis shows that the new concentrate amount has been multiplied by 40, so the water amount must be multiplied by 40 to have the same taste as the original mix. This situation can be represented in a table to organise the two measure spaces and to allow easier between and within analyses, as seen in Figs. 2 and 3, respectively.

Measure spaces representation and between analysis of the juice problem

Measure spaces representation and within analysis of the juice problem
Rate situations are structurally similar to ratio situations, comparing two quantities that are related multiplicatively, and can be represented using a table. Typically, proportion problems provide three elements and the task is to find the fourth element. These are referred to as “missing value” proportion problems. Fisher (1988) stated that: “The most common textbook strategy for solving a proportion problem is to write an equation in the \( ^a{/_b}{ =^c}{/_d} \) form with an unknown as one of the four terms, cross-multiply and solve for the unknown” (p. 157). However, even though the proportion equation of \( ^a{/_b}{ =^c}{/_d} \) is regarded as encapsulating proportion situations (Tourniaire & Pulos, 1985), the cross-multiply approach has been heavily criticised. The main criticism of “equationising” proportion situations is that the focus moves to equation solving rather than thinking in terms of the proportional nature of the problem situation. The representation of the problem also uses fraction notation although these are not fractions in the sense of a part to whole multiplicative comparison.
The literature indicates that ratio is a multiplicative comparison and hence proportional reasoning is the capacity to differentiate additive from multiplicative comparisons (Behr et al., 1992; Lamon, 2006). Exposure to a range of authentic, real-world contexts of both additive and multiplicative comparison supports proportional reasoning (Cramer et al., 1992; Van Dooren et al., 2005). As a ratio is a multiplicative comparison, the operations of multiplication and division are keys to operating in this domain; within and between thinking supports solution attainment. Procedures for solving proportional problems should share structural similarity, thus emphasising the mathematical structure of proportional reasoning topics (Vergnaud, 1983). The standard proportion equation \( \left( {a/b = c/d} \right) \) should not be foremost in proportion instruction, and its introduction should be delayed until students have had extensive experience with proportion situations (Hart, 1981; Cramer et al., 1992). Ratios are fractions, but not always of the part: whole sense (English & Halford, 1995). Fraction equivalence is important in operating with ratios, but part/part/whole ratio knowledge and part/whole fractions must be distinguished to reduce confusion. In summary, we draw from the literature, five key points for instruction that we feel are important for the development of proportional reasoning and building of multiplicative structures for successful operation in this domain, as follows:
-
1.
Use of authentic, real-life situations that contrast additive and multiplicative comparison
-
2.
Identification of the multiplicative structure in proportion situations
-
3.
Delay of introduction of the standard proportion algorithm
-
4.
Explicit connection to fraction knowledge
-
5.
Wide range of representations of proportion situations
3 Framework for analysis
Project 2061 (American Association for the Advancement of Science, 2009) established a method of textbook analysis that utilised research and other documents to create specific learning goals as the basis for the analysis of learning materials. In particular, that project built on reports such as the NCTM Standards. However, in contrast to Project 2061, which devised standards and indicators for assessing both content goals and instruction goals, we have focused solely on content goals. Previous research has suggested that textbooks have the potential to be agents of change to transform the curriculum (e.g. Collopy, 2003; Grant et al., 2002), so we wanted to analyse the textbooks in their “rawest” form, without consideration of how they might be used in the actual classroom situation. In this study, we derived specific curriculum content goals (SCCGs), drawing on our summary of the literature on proportional reasoning, and as reported in previous research (Dole & Shield, 2008). We rationalised the six SCCGs of our previous research into five. For each SCCG, we devised three indicators that we believed would contribute to attainment of the specified content goal. As each SCCG directly linked a key point from our literature summary, we considered what teachers would need to emphasise in their teaching in order to contribute to attainment of that criterion. That is, the question we posed in order to devise the indicators was: What would be required in order for each specific content goal to be achieved? We used literature as our reference here, drafting each indicator and then considering the extent to which it aligned key points about the development of proportional reasoning as outlined in the literature and the degree to which it aligned the intent of each stated SCCG. This set of criteria expanded upon a set previously used to support the analysis of aspects of school mathematics textbooks (Dole & Shield, 2008). The revised SCCGs and indicators used in the current analysis are summarised as follows.
-
1.
Additive and multiplicative comparison contrasted through use of authentic life-related situations
Indicators:
-
(a)
opportunities to differentiate additive and multiplicative comparisons are provided
-
(b)
the multiplicative relationship in proportional situations is made explicit (cf. the additive nature of non-proportional comparisons)
-
(c)
given examples and exercises use authentic comparisons
-
(a)
-
2.
Identification of multiplicative structure and proportional thinking
Indicators:
-
(a)
multiplicative comparative relationship of ratio situations is clearly defined
-
(b)
use of the operations of multiplication and division is highlighted (inverse)
-
(c)
use of both within and between thinking is evident
-
(a)
-
3.
Meaningful symbolic representation
Indicators:
-
(a)
representation supports identification of within and between relationships in the proportion situation
-
(b)
links between symbolic representation across problem types are made explicit (i.e. solution procedures are based on consistent symbolic representation for problems that share the same structure)
-
(c)
the introduction of the formal “proportion equation” is delayed until extensive experience has been gained with other representations
-
(a)
-
4.
Related fraction ideas explicitly connected
Indicators:
-
(a)
clear links are made with ideas of fractions and equivalence
-
(b)
part/whole fraction and part/part/whole ratio relationships are explicitly distinguished
-
(c)
clearly signals fraction notation meaning in use (e.g. part/whole, ratio, quotient) is clearly signaled
-
(a)
-
5.
Effective use of a range of representations
Indicators:
-
(a)
tables are used to highlight multiplicative relationships
-
(b)
graphs of proportional situations are straight lines that go through the origin
-
(c)
graphs are used to extrapolate and interpolate solutions and/or make predictions
-
(a)
4 Analysis of the textbook series
The analysis focused on five series of textbooks (identified in this report as series 1–5, respectively) published to support the teaching of mathematics in grades 8, 9 and 10 in Queensland schools with each series consisting of three books, one for each grade level. Two of the series were written by Queensland authors specifically for the local syllabus, while the other three have been adapted by Queensland authors from series published in other Australian states.
The analysis commenced by summarising the features of the textbook series as a whole in the first instance to give an overview of their presentation, format and style. Next, chapters in each textbook series that specifically addressed the focus topic of ratio, rate and proportion were identified. We also surveyed the three books within each series for topics that we had identified as involving proportional thinking, including ideas such as equivalent fractions, percentages, unit conversions, scale, similar shapes, gradient, trigonometry and probability.
The SCCGs were then used to analyse the selected sections of the textbook. Initially, each of the authors of the paper worked separately to analyse one of the book series. The identified sections were read, in the order that they appeared in a book series over the three grades, looking for evidence related to the indicators in the SCCGs. The order of reading was important in establishing the degree of linking between related topics. A rating of high, medium, low or no evidence was decided for each indicator depending on the evidence of that indicator being enacted in the material. In establishing the ratings, frequent excursions back into the books were necessary. Once each researcher had established a set of ratings for a series, the ratings of the two researchers were compared and discussed. While there were some areas of initial disagreement, we found that discussing these and reviewing the evidence were valuable in reaching a consensus. We show the detailed analysis of one series (series 1) and then summarise our findings on all five series.
4.1 Overview of series 1 textbooks
In series 1, each book consists of just under 500 pages divided into 15, 14 and 15 chapters, respectively. Each chapter focuses on a specific mathematical topic, for example Decimals and Percentages (grade 8, Chapter 4), Linear Equations and Formulas (grade 9, Chapter 8) and Parabolas (grade 10, Chapter 10). The books have a consistent presentation style. Each chapter is sub-divided into a number of sections with specific topic headings. For example, in the grade 8 book, Chapter 8 (Rates and Ratios) consists of 14 sections with topic names (for example, 8A Ratio and proportion, 8B Simplifying ratios, 8I Using rates: Speed, distance and time) as well as four extra sections at the end of the chapter (Puzzles, Applications and Activities, Enrichment and Extension, Revision Questions). Each of the topic sections consists of brief definitions and explanations, several worked examples and extensive practice exercises. In some of the sections there is a “learning task”. Some learning tasks involve an activity (constructing a triangle) while others are somewhat similar to a set of exercises.
Identified chapters that specifically addressed the focus topic of ratio, rate and proportion in series 1 were Chapter 8 (Rates and Ratios) in the grade 8 book, Chapter 2 (Ratio and Rates) in the grade 9 book and Chapter 1 in the grade 10 book.
4.2 Rating of specific SCCGs
4.2.1 Additive and multiplicative comparison contrasted through use of authentic life-related situations
-
Indicator a
No examples of additive comparisons are provided and no opportunities are provided to differentiate between additive and multiplicative comparisons. Rating, no evidence.
-
Indicator b
the multiplicative relationship in proportional situations is not made explicit nor compared with non-proportional situations. Rating, no evidence.
-
Indicator c
Most of the situations addressed in the examples and exercises involved authentic comparisons. There were occasional problem contexts that did not represent an authentic use of ratio or rate. For example, income tax is normally calculated as cents in the dollar which is effectively a percentage, meaning that the following problem was not authentic. “For every $8 earned, $2.50 is paid in taxes. If I earn $13216 in a part-time job, find: (a) the amount of tax I need to pay, and (b) the amount I take home” (grade 8, p. 37). However, the instances of diversions from the authentic use of the concepts were considerably fewer than in some of the other books examined, with many of the contexts used being quite informative to students. Rating, high.
4.2.2 Identification of multiplicative structure and proportional thinking
-
Indicator a
The grade 8 book defines ratio as follows: “A ratio is a comparison of two quantities where we look at how the two quantities are related to each other” (p. 198). The first example involves a ratio of students to teachers at an adventure camp of 5:1. At no point does the text mention that this means that the number of students is five times the number of teachers. Shortly after, there is the statement: “Ratios, like fractions, can be simplified using multiplication and division” (p. 200). A within strategy is then shown to write equivalent ratios but there is no use of the between strategy that would show the multiplicative nature of the comparison. Later in the chapter, rate is defined as follows: “A rate is a measure of how one quantity changes with respect to another” (p. 206). Again, the only mention of multiplication or division comes when the specific context of speed is introduced. “Speed is the rate at which distance changes with respect to time. It is measured in units of distance divided by time, such as metres per second, kilometres per hour” (p. 208). Manipulation of the formula d = s × t is then demonstrated. Rating, low.
-
Indicator b
The books demonstrate the use of an identical within proportion strategy in the ratio and rate chapters for grades 8 and 9. Problems are represented consistently as two measure spaces with the operations of multiplication and division highlighted, as in the following examples.
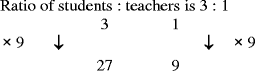
In a canoeing camp, the ratio of students to teachers needs to be 3:1. Find the number of teachers required if there are 27 students.
Ratio of students/teachers is 3:1
If rope cost $2.20 per metre, find the cost of 12 m of rope.
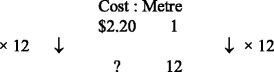
While examples involve the use of multiplication and others the use of division, there are no cases where the use of multiplication and division as inverse operations in the same example is shown. It is interesting to note that in the grade 8 book, the idea of speed is introduced in the rate subsection, immediately following practice exercises modelled on the second example shown above. However, there is no connection with the prior method of solving a rate problem. The formula and a triangle diagram to help students remember the placement of the symbols in the formula is used. The same approach is used in the year 9 book when working with density. Rating, medium.
-
Indicator c
The grades 8 and 9 books illustrate the use of “within” proportional thinking extensively. As well as its use with ratio and rate problems as illustrated above, the same thinking is illustrated with unit conversions, scale and some percentage situations. Use of between thinking is not illustrated in any context, meaning that the multiplicative relationship between the two variables is not highlighted. Rating, low.


4.2.3 Meaningful symbolic representation
-
Indicator a
As mentioned previously, the representations used strongly support within thinking, without any use of inverse operations. However, the representations do not support the idea of relationship. Rating, low.
-
Indicator b
The use of the two measure space representation is consistent across problem types in the grades 8 and 9 books. However, in grade 8, even though the first rate examples (costs and exchange rates) continue the representation and solution method established for ratio problems, when speed is introduced, no connections to previous ideas are made. Instead, the formula is stated with a triangle pattern to assist students to remember the various forms of the formula. The same formula/triangle method is used for both speed and density in grade 9. Rating, medium.
-
Indicator c
As mentioned earlier, fraction notation is not used for ratio until book 2 and the proportion equation is not introduced until grade 10. Rating, high.
4.2.4 Related fraction ideas are explicitly connected
-
Indicator a
The use of fraction notation is delayed until grade 9 in the series. In grade 8, clear links are made with the ideas of fraction and equivalence. “Ratios, like fractions, can be simplified using multiplication and division” (p. 200). In grade 9, the use of fraction notation is introduced. “Ratios are usually written in the form a : b but can also be written as a / b ” (p. 34). In grade 10, this is referred to “as a fraction, a / b ” (p. 17). Rating, medium.
-
Indicator b
In grade 9, without explicitly stating the difference between part/whole and part/part relationships, the part/part nature of a ratio is expressed with a rectangular area diagram showing the whole partitioned into three equal parts, two coloured red and one coloured blue. “A ratio expressed as 2:1 indicates that one part is twice the size of the other. Here the ratio of the red to blue areas is 2:1.” In grade 10, fraction notation is used, including the proportion equation, without further qualification. Rating, medium.
-
Indicator c
Explicit identification of the meaning of a / b in use is not provided, apart from the use of formulas for speed and density where division is highlighted. Rating, low.
4.2.5 Effective use of a range of representations
-
Indicator a
The books make consistent use of a 2 × 2 table for the two measure spaces as illustrated earlier. In all cases, only the within way of working is demonstrated. The use of these tables is extended to other topics including unit conversions and percentage. There are no instances of the use of extended tables showing more than two values for each variable that could be used to plot a graph of the relationship. Rating, low.
-
Indicator b
Proportional situations are not represented with linear graphs in any of the books in the series. Rating, no evidence.
-
Indicator c
In a “Learning Task” in the grade 8 book (p. 277), number lines are used to provide a graphical representation of the sharing of a quantity in a given ratio. These provide a simple physical representation of ratio (length/length) but do not convey any notion of a relationship between two variables and equivalent ratios. Rating, no evidence
The findings from the analysis of the five textbook series are summarised in Table 1.
From Table 1, textbook series 4 and 5 in this study were rated as showing low or no evidence on more SCCG indicators than textbook series 1, 2 or 3, with 5 and 7 N ratings, and 9 and 7 L ratings, respectively. The extent to which series 1 met our SCCGs was described in detail in this paper. As can be seen from Table 1, for SCCGs 1–4, it was scored high or medium on at least one of the indictors, and for SCCG5 (effective use of a range of representations), it was scored low or no evidence. Series 2 scored medium or high on at least one indicator of SCCGs 1, 3, 4 and 5, but low on all three indicators for SCCG2 (identification of multiplicative structure). Series 3 scored medium or high on at least one indicator for SCCGs 2, 3, 4 and 5, but low or no evidence for SCCG1 (additive and multiplicative comparison contrasted). Series 4 scored only one high rating overall and this related to SCCG4 (related fraction ideas explicitly connected). For all other SCCGs, series 4 scored low or no evidence on all other indicators. Series 5 scored only one medium rating overall, and this was also for SCCG4. Similar to series 4, it was rated low or no evidence on all the indicators for the SCCGs. Series 4 and 5 were scored considerably lower on all SCCGs than series 1, 2 and 3.
Looking across each SCCG in Table 1, ratings of each textbook series for each of the SCCGs and their indicators can be seen. For SCCG1 (additive and multiplicative comparison contrasted through use of authentic, life-related situations), all textbook series were rated as providing no opportunities for students to differentiate multiplicative from additive comparisons (indicator a), and the multiplicative nature of proportion situations (indicator b) was not made explicit. All series used authentic situations for their examples and exercises (indicator c) but to varying degrees. Series 1 and 2 scored high and medium, respectively, for this indicator, but the other three series were scored low. While many of the contexts provided a reasonable representation of a life-related situation, there were numerous examples across the series (and particularly series 3, 4 and 5) that showed the use of ratio for purposes for which it is not really relevant. In particular, three of the series included techniques for increasing and decreasing a given quantity in a given ratio, a problem type that we found difficult to reconcile with reality. These problems included simple applications of the technique (Increase $50 in the ratio 3:2) and applications that we could not imagine being used in the real context (Sam buys a car for $30,000 and when he drives it out of the showroom its value decreases in the ratio 8:11. Find the decreased value of the car.).
The identification of the multiplicative structure of problem types and the use of proportional thinking (SCCG 2) in the textbook series appears to be mostly incidental. Proportional thinking was identified in problem types named as “direct proportion” in all of the textbook series, but instrumental solution methods were given for solutions to the problems presented rather than focusing on the nature of the relationships involved. Generally, there was an adherence to the same types of solution strategies for particular types of problems. For example, when working with speed, substitution into a given formula was common to all the series, the triangle pattern for remembering the formula in its various transformations being used in four of the series. The use of the operations of multiplication and division was demonstrated (indicator b), although not specifically highlighted (and hence the low rating). Series 1 scored medium for this indicator as its explicit procedures used multiplication and division (see detailed analysis). All textbook series were rated as low in relation to the use of “within” and “between” thinking (indicator c) except for series 5, which was rated as showing no evidence.
For SCCG3 (meaningful symbolic representation), all textbook series were scored low on symbolic representations to support identification of the “within” and “between” relationship in proportion situations (indicator a), except series 3, which was rated as showing no evidence. In series 1 and series 3, the use of the “within” thinking strategy was consistently demonstrated. However, “between” thinking, that captures the multiplicative relationship between the two variables, was not explicit. In general, in the other three series, there was little clear evidence of any recognition of the multiplicative structure involved in the topics examined. Series 1 and 3 scored medium for indicator b (that links between problem types and symbolic representation are made explicit) whilst the other textbook series were scored low. Only series 1 and 2 delayed the formal “proportion equation” (indicator c) until grade 9, with the other three introducing this representation in grade 8. When the proportion equation was used, its solution relied on the students being told to “cross-multiply and solve.” Cross-multiply was also used in some series as the method to identify equivalent ratios.
For SCCG4 (related fraction ideas explicitly connected), all five series scored high or medium in relation to clearly linking fraction equivalence (indicator a). However, only series 1 scored medium on distinguishing part/whole fraction and part/part/whole ratio relationship (indicator b) with series 2, 3 and 4 scored as showing no evidence, and series 5 as showing low evidence. All five series were scored low or no evidence for fraction meaning (part/whole, ratio, quotient). All textbook series clearly have an emphasis on exercises where students generate equivalent ratios using equivalent fraction procedures, but are quite deficient in terms of assisting students to connect and extend their fraction knowledge to ratio knowledge.
For SCCG5 (effective use of a range of representations), the ratings across the five series were mixed. Series 3 was scored medium in relation to using tables for ratios to highlight multiplicative relationships. In fact, this series was scored highest overall for all three indicators in SCCG5, suggesting that of all series, this text presented the best range of graphical and tabular ratio representations. Series 1 and series 5 scored the lowest ratings for the three indicators, with series 5 having no evidence of tables (indicator a), graphs or proportional situations (indicator b), or using graphs to predict solutions (indicator c). Series 4 was scored low on all three SCCG5 indicators and series 1 scored low for use of tables, and no evidence for use of graphs and therefore no evidence of graphs for solutions.
From this analysis, it appears that no textbook series was scored medium or high on all SCCG indicators. All series were scored medium or high on making clear links with fraction equivalence (SCCG4, indicator a) but for every other SCCG, ratings in some series were high for some indicators, but equally low or not evident on others. Clearly, all texts vary in the way they address indicators within the five SCCGs, but no text stands apart from the rest on all indicators within an SCCG.
5 Discussion
Textbook analysis in and of itself is very complex, as encapsulated in Rezat’s tetrahedron model of textbook use (see Fig. 1). By their nature, textbooks as artefacts offer particular ways of utilisation but also impose constraints on the user (Rezat, 2009). Textbooks do not operate in the absence of the teacher, and teachers interact with them in many and varied ways (Remillard, 2000). However, as identified by Pehkonen (2004), teachers regard textbooks as an authority and see textbook authors as “competent experts” (p. 518). In light of this, an analysis of the style and structure of a textbook is a fruitful means for generating conversation and raising questions about textbooks for promoting students’ rich and connected mathematics knowledge.
From our review of the literature, we identified themes that were consistently repeated as key to proportional reasoning. We summarised this review into five key themes and devised three indicators that served to give depth and detail to each of the themes. Thus, we created five SCCGs with their associated indicators, for the purpose of encapsulating the essence of proportional reasoning to guide teaching and learning of this important mathematical topic. We applied our SCCGs to analysis of five textbook series that are commonly used in secondary schools in this country. In relation to our five SCCGs, our analysis shows that the textbook series have made strong attempts to bring real situations to examples and exercises, but none provided opportunities for students to differentiate additive and multiplicative comparison situations (aspects of SCCG1). They are overall, quite low in emphasising the multiplicative structure of proportion situations and highlighting the operations of multiplication and division (SCCG2), and on meaningful symbolic representation (SCCG3). They all emphasised ratios as linking to the fraction representation (SCCG4), but overall (except for one series), were very low on the use of a range of representations (SCCG5). At this first level analysis, and particularly in light of previous research that suggests the impact of the textbook upon teachers’ planning and teaching (e.g. Budiansky, 2001; Thomson & Fleming, 2004), these textbook series would appear to be limited in their capacity to promote teaching that supports a robust development of students’ proportional reasoning.
From our analysis, two major deficiencies in all the texts related to the use of multiple and/or consistent representations, and the identification of multiplicative structures and proportional reasoning. In the textbook series analysed, there was a lack of coherence and connectedness particularly in relation to representations for proportional reasoning (SCCG5), with no evidence of this key theme for one textbook series. In some books, rate and ratio situations were linked with tabular and linear graphical representations (series 3), but the use of these representations was very limited. Series 1 made use of a two measure spaces table, but as mentioned earlier focused only on within thinking. In his detailed analysis of topics connected through multiplicative structures, Vergnaud (1983) presented representations of the “conceptual field” of multiplicative structures (see Figs. 2 and 3), highlighting the within and between analysis for proportion situations. The sparse use of tabular representations and the extensive use of various solution methods (particularly the use of the triangle pattern presented in series 1) would provide limited opportunity for students to see the multiplicative structure of proportion situations. Bell (1993) called for the teaching of mathematics to promote students’ understanding of the structure of mathematical problems. Using the suggested procedures as presented in these textbook series, this aspiration would appear to be difficult to attain.
In this study, all textbook series rated highly on linking the idea of equivalent ratios with equivalent fractions, and highlighted that the operations to find equivalent ratios were the same as those for equivalent fractions. Three of the five series introduced the use of a/ b to represent a ratio in year 8, with the other two series waiting until grade 9. Typically, this was introduced with words stating that a ratio could be written “in fraction notation” or “as a fraction”. None of the series made any mention of the fact that this fraction was not the same as the fraction concept familiar to students, that is, in the ratio case it was a part to part comparison and not the previously learned part to whole comparison. In all textbook series, the fraction notation for ratios was introduced early without consideration of the possible part/whole interference that could occur for students. Yet, the measure spaces table could be used to support analysis of the part/part/whole conceptualisation of ratio and proportion. Table 2 below shows how a new row inserted in the measure space table shows the parts and the whole of the ratio situation where juice is mixed in the ratio of five parts of water to one part of concentrate. The inclusion of the extra row supports solution of the problem that asks how much concentrate is contained in 18 L of juice.
The representation of measure spaces via a table provides a way to organise the information given in ratio, rate and proportion situations and hence the potential to analyse the multiplicative relationship between the two quantities of comparison. This representation also supports analysis of the within and between relationship that exists amongst the two quantities in the situation. The similarity in structure of ratio, rate and proportion situations is highlighted. The measure spaces table also supports representation of other topics that are structurally similar, such as percentages, scale, similar geometric shapes, trigonometric ratios and linear functions. In 1983, Vergnaud argued against instruction separating mathematical topics that share multiplicative structure, such as multiplication, division, ratio and linear function, pointing out that they are “not mathematically independent of one-another, and they are all present in the very first problems that students meet” (p. 127). In the textbook series analysed, when formulae were used for rates such as speed and density, the division interpretation of a/ b was assumed. Overall, there was little evidence of assistance for students to recognise and interpret the three meanings of a/ b . If more attention is paid to the representation of ratio and proportion situations that support analysis of their multiplicative structures, perhaps students might have more of a chance of developing connected knowledge across this domain, and hence attaining the stated mathematics curriculum goal of seeking “the development of important ideas in more depth, and the interconnectedness of mathematics concepts” (NCB, 2009, p. 8).
6 Concluding comments
In this investigation, we studied textbooks as artefacts, in the absence of how textbooks might be utilised in the classroom. Our analysis can be considered as a first level analysis, drawing on research literature of a pervasive curriculum topic, to provide a snapshot of how proportional reasoning is addressed in textbook series. Our approach was inspired by the Project 2061 framework (American Association for the Advancement of Science, 2009) for analysing curriculum materials. However, rather than starting with well-established content goals and instruction goals, we focused on content-only goals. And, rather than attempting to analyse all of the mathematical content for particular grade levels, we limited our focus to one important idea of middle-years mathematics: proportional reasoning. We consulted the long-established literature in this field, to identify the key content in relation to proportional reasoning, drawing from research studies on students’ difficulties with proportion-related tasks and descriptions of the essence of proportional reasoning. In contrast to a series of content descriptors, as is typically listed in mathematics curriculum documents, we devised curriculum goals and indicators to give richness to the domain of proportional reasoning. Analysing the textbooks against the SCCGs and indicators provided a means for determining how texts deal with core ideas in this domain. Whilst it is recognised that such an analysis of textbooks does not take account of how the textbooks may be used by the teacher and the students, it is well-established in the literature that the presentation of material in a textbook impacts how it is used. It is not unreasonable to suggest that this first-level analysis would be an excellent way to commence conversation with teachers and raise their awareness of the structure and content of the textbook and how it approaches key ideas in the curriculum. A follow-up from analysing textbooks in relation to proportional reasoning would be to focus on other key ideas in the mathematics curriculum, such as geometric thinking and visualisation, algebraic thinking and reasoning, and so on.
The five textbook series examined in the study were shown to be quite limited in the attention they paid to mathematical structure and connectedness. The approach of all the series was very much focused on procedures for different problem types, with little apparent attempt to highlight links between different problem types or the underlying common structures of the problems. One series (series 1) stood out from the others in consistently applying a solution strategy that did highlight some aspects of the structure of proportion. Overall, however, we conclude that the books would promote what Stacey (2003) named the “shallow teaching syndrome”, particularly if textbooks are taken and used as the teaching program. Our study was not an instrumental genesis study. Much research has highlighted the influence of mathematics textbooks on the curriculum enacted in classrooms. Our study analysed textbook series at the content level only without determination of the actual use of these particular textbooks in the teaching and learning of mathematics. Even without the impetus of a new curriculum with a clearly enunciated pedagogical approach, it would be expected that the textbook being used would assist teachers to create learning environments and teaching sequences that support the deeper learning of mathematics.
While this study concerned the analysis of textbooks used in our local schools, the process and the SCCGs could be applied to middle-years mathematics textbooks in most locations. The topic chosen for the analysis, namely ratio, rate and proportion, is a significant component of curricula for this age level, and most teachers share the general aim of developing deep understanding in their students. A review of the research literature on the teaching and learning of the topic provided the basis for the analysis. Such a review is generally not available to classroom teachers and our aim in developing the SCCGs and indicators was to translate the research findings into accessible statements describing what to look for in the textbook presentations. Applying the process should provide teachers with insights into the strengths and weaknesses of the textbooks being employed and enable them to make effective decisions about the selection and use of textbooks. Our analysis here could provide direction for textbook writers in relation to textbook structure and topic sequencing.
References
American Association for the Advancement of Science. (2009). Middle grades mathematics textbooks: A benchmarks-based evaluation. http://www.project2061.org/publications/textbook/mgmth/report/part1.htm. Accessed 14 Nov 2009.
Behr, M., Harel, G., Post, T., & Lesh, R. (1992). Rational number, ratio and proportion. In D. Grouws (Ed.), Handbook of research on mathematics teaching and learning (pp. 296–333). New York: Macmillan.
Bell, A. (1993). Principles for the design of teaching. Educational Studies in Mathematics, 24, 5–34.
Budiansky, S. (2001). The trouble with textbooks. ASEE Prism, 10, 24–27.
Collopy, R. (2003). Curriculum materials as a professional development tool: How a mathematics textbook affected two teachers’ learning. The Elementary School Journal, 103, 287–311.
Cramer, K., Post, T., & Currier, S. (1992). Learning and teaching ratio and proportion: Research implications. In D. T. Owens (Ed.), Research ideas for the classroom: Middle grade mathematics (pp. 159–178). New York: Macmillan.
Department for Education and Employment (DfE). (1999). Mathematics—the new national curriculum for England. London: Qualifications and Curriculum Authority.
Dole, S., & Shield, M. (2008). The capacity of two Australian eighth-grade textbooks for promoting proportional reasoning. Research in Mathematics Education, 10(1), 19–35.
English, L., & Halford, G. (1995). Mathematics education: Models and processes. Mahwah, NJ: Erlbaum.
Fan, L., & Zhu, Y. (2007). Representation of problem-solving procedures: A comparative look at China, Singapore, and US mathematics textbooks. Educational Studies in Mathematics, 66, 61–75.
Fisher, L. C. (1988). Strategies used by secondary mathematics teachers to solve proportion problems. Journal for Research in Mathematics Education, 19(2), 157–168.
Grant, T. J., Kline, K., & Weinhold, M. (2002). What do elementary teachers learn from reform mathematics textbooks? In: D. S. Mewborn, P. Sztajn, D. Y. White, H. G. Wiegel, R. L. Bryant, & K. Nooney (Eds.), Proceedings of the twenty-fourth annual meeting of the North American Chapter of the International Group for the Psychology of Mathematics Education, 3 (pp. 1505–1513). Athens, GA.
Hart, K. (1981). Ratio and proportion. In K. Hart, M. Brown, D. Kuchemann, D. Kerslake, G. Ruddock, & M. McCartney (Eds.), Children’s understanding of mathematics: 11–16 (pp. 88–101). London: John Murray.
Howson, G. (2005). “Meaning” and school mathematics. In J. Kilpatrick, C. Hoyles, O. Skovsmose, & P. Valero (Eds.), Meaning in mathematics education (pp. 17–38). New York, NY: Springer.
Lamon, S. (2006). Teaching fractions and ratios for understanding. Mahwah, NJ: Erlbaum.
National Council for Teachers of Mathematics. (2000). Principals and standards for school mathematics. Reston, VA: NCTM.
National Curriculum Board. (2009). Shape of the Australian Curriculum: Mathematics. http://www.acara.edu.au/verve/_resources/Australian_Curriculum_-_Maths.pdf. 20 Nov 2010.
Pehkonen, L. (2004). The magic circle of the textbook—an option or an obstacle for teacher change. In M. J. Hoines & A. B. Fuglestad (Eds.), Proceedings of the 28th conference of the International Group for the Psychology of Mathematics Education (Vol. 3, pp. 513–520). Bergen: PME.
Queensland Studies Authority. (2004). Mathematics: years 1 to 10 syllabus. Brisbane: Queensland Studies Authority.
Remillard, J. T. (2000). Can curriculum materials support teachers’ learning? Two fourth-grade teachers’ use of a new mathematics text. The Elementary School Journal, 100, 331–350.
Rezat, S. (2009). The utilization of mathematics textbooks as instruments for learning. In V. Durand-Guerrier, S. Soury-Lavergne, & F. Arzarello (Eds.), Proceedings of CERME6, Lyon France. http://www.inrp.fr/editions/cerme6. 15 July 2011.
Schmidt, W. H. (2012). Measuring content through textbooks: the cumulative effect of middle-school tracking. In G. Gueudet, B. Pepin, & L. Trouche (Eds.), From text to ‘lived’ resources: Mathematics curriculum materials and teacher development (pp. 143–160). Dordrecht: Springer.
Stacey, K. (2003). The need to increase attention to mathematical reasoning. In H. Hollingsworth, J. Lokan, & B. McCrae (Eds.), Teaching mathematics in Australia: Results from the TIMMS 1999 video study (pp. 119–122). Melbourne: Australian Council for Educational Research.
Straesser, R. (2009). Instruments for learning and teaching mathematics: An attempt to theorise about the role of textbooks, computers and other artefacts to teach and learn mathematics. In M. Tzekaki, M. Kaldrimidou, & H. Sakonidis (Eds.), Proceedings of the 33rd conference of the International Group for the Psychology of Mathematics Education (Vol. 1, pp. 67–81). Thessaloniki, Greece: PME.
Straesser, R. (2012). Foreword. In G. Gueudet, B. Pepin, & L. Trouche (Eds.), From text to ‘lived’ resources: Mathematics curriculum materials and teacher development (pp. v–vii). Dordrecht: Springer.
Thomson, S., & Fleming, N. (2004). Summing it up: Mathematics achievement in Australian schools in TIMSS 2002. Melbourne: Australian Council for Educational Research.
Tourniaire, F., & Pulos, S. (1985). Proportional reasoning: A review of the literature. Educational Studies in Mathematics, 16, 181–204.
Valverde, G. A., Bianchi, L. J., Wolfe, R. G., Schmidt, W. H., & Houang, R. T. (2002). According to the book—using TIMSS to investigate the translation of policy into practice through the world of textbooks. Dordrecht: Kluwer.
Van den Heuvel-Panhuizen, M. (2000). Mathematics education in the Netherlands: A guided tour. Freudenthal Institute Cd-Rom for ICME9. Utrecht: Utrecht University.
Van Dooren, W., DeBock, D., Hessels, A., Janssens, D., & Verschaffel, L. (2005). Not everything is proportional: Effects of age and problem type on propensities for overgeneralisation. Cognition and Instruction, 23, 57–86.
Vergnaud, G. (1983). Multiplicative structures. In R. Lesh & M. Landau (Eds.), Acquisition of mathematical concepts and processes (pp. 127–174). Orlando, FL: Academic.
Vincent, J., & Stacey, K. (2008). Do mathematics textbooks cultivate shallow teaching? Applying the TIMSS video study criteria to Australian eighth-grade mathematics textbooks. Mathematics Education Research Journal, 20(1), 81–106.
Author information
Authors and Affiliations
Corresponding author
Rights and permissions
About this article
Cite this article
Shield, M., Dole, S. Assessing the potential of mathematics textbooks to promote deep learning. Educ Stud Math 82, 183–199 (2013). https://doi.org/10.1007/s10649-012-9415-9
Published:
Issue Date:
DOI: https://doi.org/10.1007/s10649-012-9415-9