
Abstract
This article focuses on the development and problematization of a task designed to foster spatial visual sense in prospective and practicing elementary and middle school teachers. We describe and analyse the cyclical stages of developing, testing, and modifying several “task drafts” related to ideas around dilation and proportion. Challenged by participant non-actions and non-responses, we as task designers identified and anticipated sources of difficulties, which motivated repeated modification of the task to further the intended learning goals. The task in its present form incorporates numerous considerations including choices around materials, wording of questions and prompts, and sequencing of experiences. It also reflects our enriched understanding of exploration strategies and the roles of manipulatives and technology in spatial visual tasks designed for adult learners.
Spatial visual reasoning in mathematics refers to the application of visual and spatial representations (e.g., diagrams, physical or dynamic graphical models, and mental imagery) and processes (e.g., composing, decomposing, mental and hands-on moving). Research shows that increased attention to spatial, visual, and kinesthetic approaches to learning mathematics helps students make connections between various representations of the underlying concepts (Bryant, 2009; Goldenberg & Cuoco, 1998; Goldin, 1998). The importance of spatial and visual reasoning is recognized by teacher groups such as National Council of Teachers of Mathematics (NCTM, 2000), as well as researchers in mathematics education (cf., Arcavi, 2003), and if we expect students to learn and apply spatial visual approaches, it is important to ensure that mathematics teachers are well-prepared to recognize and apply such reasoning themselves. This suggests a need for research on how to help teachers develop the requisite skills—and to do that, we require appropriate tasks. This article examines the process of designing one such task.
Our ongoing research investigates how to help practicing and prospective elementary and middle school teachers develop spatial and visual skills for teaching geometry and measurement in geometric situations. In our work, we have observed groups of teachers and teacher candidates engaged in cooperative experiences with 3-D and 2-D tools such as physical models, diagrams, and interactive computer sketches. A substantial portion of our work has involved creating, adapting, and revising specific tasks to meet our evolving understanding of experiences that support the growth of spatial visual reasoning. In this paper, we examine and analyze the process of developing and refining one of those tasks. Entitled The Filling Task, it focuses on dilation, ratio, and proportion in the elementary and middle school curriculum, and includes two subtasks—a Geometer’s Sketchpad (GSP) task and a 3-D model task.
1 Background
Literature on mathematical knowledge of teachers and for teaching (Ball, Hill, & Bass, 2005; Lampert, 1992; Ma, 1999), suggests that many elementary teachers have a weak mathematics background and often hold a procedural view of mathematics. While the majority of research focuses on teachers’ competency and comfort with numerical strands of mathematics, there is evidence of a need for more attention from researchers toward developing teachers’ competency and comfort with geometric strands of mathematics, in particular with regard to spatial and visual reasoning (cf., Battista, Wheatley, & Talsma, 1982; Gal & Linchevski, 2010).
1.1 Visualization
Visual reasoning, or visualization, “generally refers to the ability to represent, transform, generalize, communicate, document, and reflect on visual information” (Hershkowitz, Ben-Chaim, Hoyles, Lappan, Michelmore, & Vinner, 1989, p. 75). Similarly, Presmeg (1997) describes visualization as a process of mentally constructing and transforming visual images. Presmeg (1997), as well as Arcavi (2003) and Eisenberg and Dreyfus (1991), recognize challenges around visualization that stem from a social perspective of mathematics learning. Arcavi (2003, pp. 235–236), building on the work of Presmeg (1997) and Eisenberg and Dreyfus (1991), classifies these challenges into three categories: (1) cultural, beliefs and values about what is mathematics; (2) cognitive, the high cognitive demand of visualizing conceptually rich images; and (3) sociological, the diverse cultural background of students, some of whom come from visually rich cultures while others do not. Despite the cognitive strain recognized by Arcavi (2003) and Eisenberg and Dreyfus (1991), research (cf., Koedinger, 1992) shows that visualization can be an effective and efficient means of condensing information and increasing its accessibility. Keeping in mind these issues, our research goals included designing a task which would (1) emphasize visualization and spatial reasoning as “mathematics”; (2) ease the cognitive demand of visualization through scaffolding and connection-making; and (3) offer a novel take on common experiences such as pouring water into a vessel. We were also cognisant of the tendency for students (even university level mathematics students) to avoid visual reasoning in preference to algebraic (and numerical) reasoning (Eisenberg & Dreyfus, 1991), and thus we attempted to promote visual reasoning in a variety of ways in the design (and revisions) of our task.
Our research is further motivated by the observations of Battista et al. (1982) who found that preservice elementary teachers often have poorly developed spatial visual reasoning skills for geometry, and also have substantial anxiety about working with these approaches. Whiteley (2004) agrees with Arcavi (2003) that visualization and mental imagery are central to mathematical reasoning, and he argues that the situation with teachers has not changed since the Battista et al. study. He objects to the rote nature of school geometry, and notes that students are seldom involved in analysing what they see or in exploring 3-D objects, and he attributes this in part to teachers’ poorly developed visual reasoning skills. His position resonates with the observation of Del Grande (1990) that geometry “has been difficult for pupils due to an emphasis on the deductive aspects of the subject and a neglect of the underlying spatial abilities” (p.19).
1.2 Teachers and geometry
In regard to specific concepts in geometry and measurement, The mathematical preparation of teachers (Conference Board of the Mathematical Sciences, 2001) maintains that in order to teach young children, elementary teachers must develop competence, for example in the following:
-
Visualization skills: becoming familiar with projections, cross-sections, and decompositions of common 2- and 3-D shapes; representing 3-D objects in two dimensions and constructing 3-D objects from 2-D representations.
-
Basic shapes, their properties, and relationships among them: developing an understanding of angles, transformations (reflections, rotations, and translations), congruence, and similarity. (p. 22)
There is a gap between the Conference Board of the Mathematical Sciences’ (CBMS) recommendations and the observations of Battista et al. (1982) and Whiteley (2004) on teacher knowledge; the researchers’ findings indicate a pressing need for teachers to accrue experiences with tasks and activities that will help develop their visual reasoning. This raises the question of how to develop visual reasoning in adults.
Much of the literature on developing visual and spatial sense in geometry has focused on children (cf., Del Grande, 1990; Lehrer, Jenkins, & Osana, 1998; Wheatley, 1990; Yakimanskaya, Wilson, & Davis, 1991). For instance, Del Grande categorized skills that are key to children’s development of 2- and 3-D geometry understanding: (1) spatial perception (eye motor, figure ground, position in space, perception of spatial relationships, and perceptual constancy), (2) visual discrimination, and (3) visual memory. Clements (1999) also stresses the importance of spatial perception and adds visual imagery. In connection with the latter, he suggests that children need opportunities, for example, to rotate objects in their minds.
1.3 Our research question
While these studies address issues with children, we anticipate that similar considerations are important for developing spatial visual sense in adults. Our research offers a first step in understanding how a visual and spatial sense of proportion may be fostered in adults.
Our research on adults’ visual and spatial understanding of proportion is motivated by the guidelines of the NCTM and CBMS. Proportional reasoning and dilation are recognized as important mathematics curriculum topics, and create a “unifying theme” in middle school grades in particular (Lanius & Williams, 2003). In line with the NCTM, the CBMS (2001) suggests that prospective middle school teachers should be able to do the following:
-
Demonstrate understanding of how similar figures result from a dilation, and the role of proportional relationships in determining similarity.
-
Demonstrate ability to visualize and solve problems involving 2- and 3-D objects. (p. 32)
We see a valuable opportunity in connecting these two points. Proportional relationships can be counter-intuitive—particularly when scaling area or volume is involved. However, a visual and spatial sense of dilation and proportionality can, in our view, be an effective tool for discerning the proportional reasoning within scaling relationships for dilated lengths, areas, and volumes. In order to develop such a sense, we introduce a task that incorporates physical manipulation of 3-D models, which is a well-known means of developing visual-spatial sense (cf., Clements, 1999; Robichaux, 2005), as well as a 2-D exploration with computer software, whose interactive nature also fosters the development of visual and spatial skills (cf., Clements, 2002; Guven & Kosa, 2008; Smith, Gerretson, Olkun, Yuan, Dogbey, & Erdem, 2009).
2 Framework for task design
In a 2004 article, Sierpinska calls for greater attention by mathematics education researchers to task problematization—that is, to debating variations of a task and discussing the effects of such variations on learning and research results. Sierpinska argues that design research is needed to clarify what is arbitrary and what is essential about tasks, reminding researchers that such knowledge allows replication of task-based research results, and also informs the development of systems of tasks (Sierpinska, 2004). Our research offers an example of task problematization in the spatial–visual domain of middle school mathematics, and offers a theoretical mechanism within which task problematization can occur. The theoretical underpinning of our work draws on and interconnects three theoretical frameworks for task design: the elaboration of the hypothetical learning trajectory (HLT) of Simon and Tzur (2004), the cyclical process of task design of Gadanidis, Sedig, and Liang (2004), and the research on the design of technological learning tasks of Sinclair (2003).
In our view, the integration of these three distinct perspectives is imperative in problematizing tasks—Gadanidis et al. (2004) and Sinclair (2003) attend to how the design and refinement of the task interface may enhance learning, and Simon and Tzur (2004) offer a framework that connects the mathematical task with the teacher’s intended learning goals and his or her hypotheses on student learning. Thus, while Simon and Tzur guide decisions on the overarching mathematical goals of the task, and provide a means for analysis of learner response, Gadanidis et al. and Sinclair enable the communication and implementation of the task. Each of these perspectives is discussed in detail below, beginning with Simon and Tzur’s elaboration of the HLT.
2.1 Hypothetical learning trajectories
The construct of HLT was introduced by Simon as a way to explicate how mathematical tasks can be used to promote mathematical conceptual learning via a constructivist perspective (Simon & Tzur, 2004, p. 92) The hypothetical learning trajectory includes three main aspects: the teacher’s goals for student learning, the mathematical task that will be used to promote student learning, and hypotheses about the process of students’ learning (Simon, 1995). Tasks are selected based on the hypotheses of student learning in connection to the intended learning goals set out by the teacher. Simon and Tzur (2004) offer a mechanism—reflection on activity–effect relationship—as an elaboration of Piaget’s reflective abstraction, and as a theoretical means by which to generate HLTs. Activity–effect corresponds to the perspective of Simon and Tzur (2004) that learners set goals, engage in activity to meet these goals, and then necessarily attend to the effects of their goal-driven activity. Specifically, they suggest that the learning process begins with an individual setting goals that are “a function of [his or her] current conceptions and [are] related to the task at hand” (ibid., p. 94); these goals are often distinct from the learning goals set out by the teacher. As the individual engages with the task at hand, his or her activity is goal-driven and attention is directed towards the effects which that activity has on meeting said goals. Reflecting on the relationships between the activity and its effects is, in this perspective, a way in which new (for the learner) concepts may be constructed. Simon and Tzur (2004) clarify that reflection need not necessarily involve conscious thought. Further, though they identify a connection between physical and mental activity, they emphasize that it is the mental activity that forms the basis for conceptual learning.
Reflection on activity–effect relationships informs the development of HLTs by providing a mechanism with which to generate a hypothetical learning process in the context of a certain task. In particular, it motivates the question “What activity, currently available to the students, might be the basis for the intended learning?” (Simon & Tzur, 2004, p. 96) which in turn provides a basis for thinking of the learning process and the corresponding role of the task in that process. Simon and Tzur (2004) apply this mechanism to the generation of a task on subdividing fractional parts, for which they identify what they expect the student will do (activity) and to what mathematics that will lead them (effects). They use this hypothesis to inform task design and selection.
Connecting this framework to our research, we use reflection on activity–effect to inform our HLTs, and in particular the mathematical goals connected to our task. However, more is needed in task design—particularly when tasks involve computer software or 3-D models, both of which offer learners many possible distractions. As Gadanidis et al. (2004) observe, online mathematical task design requires deliberate pedagogical and interface choices in order to facilitate mathematical learning. Thus in our research, we look to Gadanidis et al. (as well as Sinclair, 2003) for a refined framework with which to direct learner attention in ways that reflect the intended learning goals of the task designers. As these refinements speak to computer software tasks, one of the contributions of our research is in extending the framework to a broader set of tasks, including investigations with 3-D models.
2.2 Designing technological mathematical investigations
Gadanidis et al. (2004) brought human computer interaction and mathematics education expertise together to examine one online mathematical investigation from two design perspectives—pedagogical and interface—then redesigned it in light of their analysis and in anticipation of further testing and refinement. They identified important computer interface design principles around visual encoding, representations, and organization. These principles inform decisions about which elements (e.g., questions, prompts, and diagrams) to include, and how to orchestrate the task. At the same time, since pedagogical sensitivities constrain the task design, appropriate choices in topic, terminology, and an understanding of the intended audience are also necessary. Gadanidis et al. (2004) describe a cyclical process of task design, which includes development, testing, analysis, (re)design, (re)development, (re)testing…and which informs such things as the visual and logical layout of a webpage. At subsequent stages of the task development, the designer modifies in light of learner responses. The cyclical process of task design that Gadanidis et al. advocate resonates with Simon and Tzur’s observation that a “teacher is regularly involved in modifying every aspect of the HLT” (2004, p. 93) as his or her understanding of students’ conceptions develops through task implementation and reflection. Gadanidis et al. note that learner responses or confusion may reveal obvious difficulties, e.g., a particular word or item that they do not understand, or responses may point to underlying problems of the design. For instance, an individual may answer a question in a way that suggests he or she may not have noticed a phrase, an image detail, or a motion. Though a difficulty may be evident in only one case, the designer must query whether this signals the need to make one or more changes.
In accordance with these observations, Sinclair (2003) notes that a task designer creates opportunities for student learning by including appropriate on-screen affordances that direct attention. Learners’ actions and responses—perhaps more particularly their non-actions and non-responses—enrich the task designer’s understanding of task elements and how they interact to further or hinder the intended learning goals. In the terminology of Simon and Tzur (2004), reflections on (learners’ reflections on) activity–effect relationships enrich the task designer’s understanding of how learners interact with the design features of the task.
In regard to the interactions of task elements our research draws on Sinclair’s (2003) design of technological learning tasks, which revealed the importance of carefully structuring the links between prompts/questions and preconstructed dynamic geometry sketches to support learning. For instance, an onscreen button to add a line or measure an angle, or capabilities for revealing information in a novel way are affordances that the task designer may use to direct learners’ investigation and attention. Sinclair (2003) further notes the importance of setting prompts and questions to help learners use those affordances to notice, interpret, and extend their thinking. For example:
-
1.
When a question aims to help the learner notice and interpret details, the sketch must draw attention by providing the visual stimulus.
-
2.
When a statement prompts action, the sketch must contain the necessary provisions, so that the learner can take the required steps.
-
3.
If a question invites exploration, the sketch must open options for the learner by supporting multiple paths.
Relating these ideas to our study, we extend the frameworks of Simon and Tzur (2004), Gadanidis et al. (2004), and Sinclair (2003) to offer a refined perspective on the design of non-technological tasks, and in particular to the design of 3-D investigations. Guided by the elaborated HLT framework, in this paper we describe the intended learning goals, as well as our expectations for learner activity and response. We adhere to pedagogical and interface sensitivities in the design of both the GSP and 3-D model portions of our task, and we attend to how the materials and software affordances selected (e.g., hollow polyhedral shapes) encourage or hinder the learner in taking appropriate action (e.g., holding, turning, moving, and filling) in response to a prompt or question that is designed to guide the learner as he or she acts. Further, we introduce the idea of task drafts, which are discussed and analysed with respect to learning at each stage of the design cycle, and as such offer a mechanism within which task problematization can occur.
3 Methodology
In this section we briefly outline our methodological choices, including the specific content and meta-content learning goals associated with our HLT. We introduce our “participant testers” and describe our initial understanding of their (pretask) knowledge, and we motivate our initial organizational choices in task design. Due to the cyclical structure of task design and refinement, we examine the nature of participant response, action, and non-action during engagement with iterations of the task in order to inform subsequent “task drafts”. These are discussed, analysed, and motivated in Section 4. As the design of our initial task draft stemmed from reflections of action–effect relationships as we ourselves experimented with different material, interface, and phrasing choices, the specific details regarding these choices (for each of the task drafts) is also elaborated upon in Section 4.
3.1 Grounded theory
The grounded theory approach developed by Glaser and Strauss (1967) was used in this study. Glaser (2002) elaborates that in grounded theory:
categories are generated from the data and properties are generated concepts about categories…Once discovered, concepts leave the level of people. They become the focus of the research, to be later applied to people's social psychological behavior. As the theory generates, and integrates through memoing and sorting, the conceptual level goes up, often from substantive to formal theory. (p. 29)
This quotation indicates that the process of using grounded theory goes beyond creating rich descriptions, the hallmark of qualitative analysis. The data are thoroughly and systematically examined, and categories are established where the focus of the researcher is on finding a concept that organizes the whole. Glaser stresses that to conceptualize what is happening involves abstraction; the resulting conceptualization becomes applicable across people, place, and time, and can be used to explain other processes or behaviours.
We chose grounded theory for this study because it is particularly applicable when a researcher is examining a set of data in a relatively new area. While there is research in the areas of task design (cf., Gadanidis et al., 2004), visualisation (cf., Whiteley, 2004), and teacher knowledge (cf., Ball et al., 2005), that connects to our investigation, a survey of the literature showed no previous studies that focused on adult development of spatial visual skills related to teaching. Thus, the researchers entered the data analysis phase without preconceived ideas about what should occur. As the discussion section will illustrate, the categories that emerged from our analysis reflect a number of topics in the mathematics education field, topics such as exploring and investigating, visual reasoning, and connection making. We further connect these categories to Simon’s (2006) notion of key developmental understandings (KDUs)—that is, “understandings that are critical to the development of important mathematical ideas” (p. 363). Specifying KDUs is a way for researchers to “impose a coherent and potentially useful organization on their experience of students’ actions (including verbalizations) and make distinctions among students’ abilities to engage with particular mathematics” (Simon, 2006, p. 360). Such an organization necessarily informs the generation of categories which then “transcend the descriptive” (Glaser, 2002, p. 25). In Simon’s perspective, one way “to identify KDUs is to observe students engaged in mathematical tasks to specify understandings that can account for differences in the actions of different students in response to the same task” (2006, p. 363). In our systematic examination of participants’ activity and data, we attend to cues that illuminate KDUs related to visual–spatial reasoning around proportionality and use this to conceptualize the specific needs of adult learners.
3.2 The participant testers and our learning goals
Our research occurred over three testing stages with pre- and in-service elementary and middle school teachers. The stages each lasted approximately 2 h during which participants worked in small groups of two to four, and field notes were collected. Written responses to prompts and questioning were also collected and used to inform our analysis and task refinement. In the first phase of testing, 18 preservice elementary teachers engaged with The Filling Task. The second testing phase involved 24 practicing elementary and middle school teachers. In the third session, our refined task draft was tested with another group of 18 preservice elementary teachers. Participants in each of the testing phases were novices with respect to GSP; in addition, the majority of participants at each stage were anxious about their understanding of mathematics in general, having not studied mathematics beyond the high school level.
Our research team has substantial experience with this demographic, and this experience informed our hypotheses for participants’ learning processes. We expected that participants would be more familiar and comfortable working with 2-D analogues rather than with 3-D shapes given their common experiences with school curricula, and that they would need an opportunity to learn or review the basics of the GSP software. Thus, our initial task draft, which included both 2-D GSP and 3-D model explorations, made use of a medium with which we believed participants would be most comfortable: pen and paper. A worksheet package that included instructions and prompts for both the GSP and 3-D model portions of the task was provided; details of this package are discussed below. We further anticipated that our participants were likely to approach spatial visual tasks as beginners—possibly anxious beginners, who viewed geometry as a memory and logic exercise. Thus we hypothesized that participants might benefit from tasks that incorporated opportunities to (re-)develop the spatial and visual skills mentioned by del Grande (1990) and Clements (1999). In particular, we were interested in providing participants with an opportunity to re-experience concepts in a way that would enrich their relational (Skemp, 1976) understanding of the ideas. That is, one of our learning goals was for participants to develop a visual sense of relationships and connections rather than relying on memorized rules.
The over-arching learning goal behind our task drafts was to (re-)develop spatial and visual skills with respect to relationships and connections among dilation, ratio, and proportion. Our hypothetical learning trajectories (realized as task drafts) were developed around three themes: (1) “big ideas”—the spatial visual concepts and experiences foundational for teaching elementary school mathematics; (2) making connections—providing experiences to foster and extend teachers’ linking of ideas; and (3) using strategies—modeling methods of exploration to enable deep thinking about spatial visual concepts to recognize and address misconceptions.
We sought to foster connection-making among multiple representations and also between dimensions by including a kinesthetic component to the task, which incorporated manipulating 3-D models and 2-D technological objects. The technology component was designed to provide opportunities for participants to see dynamic change and develop imagery for such change. Through this component, we aimed to foster spatial visual strategies that would allow learners to “see” connections between diagrams in 2-D and their 3-D instantiation.
As mentioned, more of the specifics of The Filling Task are detailed below; however, we take a moment to briefly describe the scope and content here. The task has two distinct components—a GSP examination of dilation, and a 3-D exploration of cross-sections of polyhedra. The GSP task on dilation was intended to draw attention to the idea of center, to broaden the usual curricular treatment of scale diagrams, and to allow the user to investigate changes in length and area dynamically. The 3-D model task evolved out of a discussion around imagining cut surfaces (cross-sections), which we anticipated would be a new and interesting channel through which spatial visual skills could develop.
4 The filling task: iterations and task drafts
This chapter examines and analyses three testing phases of three task drafts of The Filling Task. It is partitioned into three sections each of which discusses the contents, testing of, and subsequent revisions of a particular task draft. Section 4.1 begins with a discussion of preliminary decisions and motivations behind interface and material choices for the 3-D models and the GSP sketches. Observations and interpretations of the testing sessions are then discussed, with particular attention to participants’ struggles with GSP and with connecting ideas between the two separate tasks. We close the section with reflections on the activity–effect relationship of our task choices and an outline of the corresponding revisions. Section 4.2 is structured in a similar way, with attention to content and arrangement of the second task draft, participant experiences with that draft, and subsequent revisions. We discuss the specific changes and considerations made in explicitly connecting the two tasks, as well as participant responses to, and struggle with, the new interface design and the revised 3-D exploration. We further consider revisions regarding the sequence and focus of our task, and a refined hypothesis for the learning process as related to our expressed learning goals is offered. Section 4.3 briefly outlines our most recent task draft, the specifics for which are included in Appendices A and B. The section focuses primarily on the testing session in which participants more readily made connections between the 3-D models and the GSP sketches, and sets the stage for a detailed discussion in Section 5 of the key developmental understandings related to visual–spatial proportional reasoning.
4.1 Initial task draft: two separate tasks
4.1.1 Content
The Filling Task was initially two distinct tasks. One task investigated cross-sections of 3-D polyhedra; the other used GSP to examine dilation. We designed two types of models for the 3-D exploration: one that focused on slicing and one that focused on filling. Both models would lead into an examination of area (an important elementary and middle school topic) and would also bring in proportional reasoning through exploring what happens to the area when the slice or fill level is, for example, a quarter of the way up. The idea behind slicing was to have participants cut through a pyramidal form, parallel to the base, thus producing similar shapes. We discussed how and what to slice—and what to slice with—and tried to determine a progression from least to most difficult. We decided to start with a square-based pyramid, and then move to the tetrahedron, and then the cube. We anticipated that these would be novel yet accessible shapes that could also open the door to extended explorations. We experimented with styrofoam, florist foam, plasticine, clay, and play dough, but rejected those that, once cut, could not be used again. As an alternative to slicing, we also considered filling; clear plastic shapes were readily available and could be filled with sand, rice, or water. In this situation, similar shapes are produced on the surface area of the sand, rice, or water by filling the pyramid to varying levels. These similar shapes are a result of a dilation whose center is the apex of the pyramid, and whose factor is calculated as a ratio of distances from the center to corresponding vertices of the shapes. We decided to use water, because it would allow one to see cross-sections and truncated 3-D shapes from multiple points of view. Prompts for the 3-D exploration included:
-
1.
What shape(s) can you make when you cut through a pyramid/tetrahedron/cube?
-
2.
What are their properties?
-
3.
How are the shapes related to one another?
-
4.
Can you alter the way you slice or fill so that the shapes will be noticeably different?
The accompanying GSP task included a demo of a dilated triangle, as shown in Fig. 1 below. As one of our learning goals was to encourage participants to reflect on changes in area after a variety of different dilations, the sketch included a slider and instructions on how to vary the dilation, as well as a “reset” button. An important aspect of our design was to provide participants with an opportunity to play. Research has shown that play motivates and engages students. At the heart of “playfulness” is the idea of self-direction (Reiber and Matsko, 2001). Participants were encouraged to play directly, and we anticipated that by providing “reset” buttons, participants would be able to explore creatively without being concerned about ‘ruining’ the sketch. In resonance with Sinclair’s (2003) perspective on structuring links between prompts/questions and preconstructed dynamic geometry sketches to support learning, the slider offered participants appropriate provisions to direct their actions and attention, while the reset button was included to help foster exploration and “play”. Further, a “show/hide” button offered participants an opportunity to see “how” a dilation is made and to make connections to the 3-D model portion of the task. The layout of the sketch was informed by Gadanidis et al.’s (2004) advice on logical organization and visual encoding (e.g., using visual elements such as colour to present or differentiate ideas). For instance, buttons were well emphasized, instructions were direct and to the point, and appropriate steps to reduce onscreen “clutter” were taken. Also, the original and dilated triangles were of different colours so that both would remain visible even when superimposed. In order to draw participants’ attention to the idea that dilation has a center (one of our expressed KDUs (Simon, 2006)), and to introduce that terminology, we created a point outside the original triangle and labeled it “Center of Dilation”. We were aware of the possibility of overwhelming participants with too much onscreen information and designed each screen accordingly.

GSP sample screen 1—exploring dilations
In addition to the dilation demo, a GSP file with a number of blank screens and a pen-and-paper worksheet package was provided. At this stage in the task design, we believed that participants would benefit from constructing objects with the software and making connections between those constructions and their pen and paper task. As such, the worksheet included (a) instructions for creating a segment and dividing it into a fixed ratio; (b) instructions for dilating a polygon by a factor of 3, followed by a number of prompts and questions about the dilated shape; (c) instructions to use the fixed ratio to dilate a polygon, followed by additional questions; and (d) various opportunities to apply dilations to onscreen figures. After the onscreen work, participants were asked to apply the ideas to familiar patterns as in Fig. 2 below.

Paper-and-pencil segment of GSP activity, first test session
As before, these prompts were designed to help make connections between participants’ prior knowledge and experience with 2-D dilation, in both static and dynamic representations, and with their new experiences exploring 3-D models.
4.1.2 Testing
The first test of the 3-D model task confirmed our expectation that appropriate materials were important to the success of this hands-on investigation and to participants’ learning processes. For the slicing approach, we observed that students found it difficult to create 3-D shapes with plasticine, and while the softer play dough could be shaped using plastic moulds, participants had difficulty getting a clean cross-section cut (i.e., one that clearly showed the shape). The filling approach also posed some challenges, however they were easier to mediate. The effects of surface tension elicited discussion, and was noted as an opportunity to explore the reliability of mathematical models—an issue which arose for us as an important KDU (Simon, 2006) in the area of mathematics pedagogy. Other challenges participants faced included using plastic shapes that were simply too small for making observations. In general, participants expressed interest in the variety of surface shapes that could be produced by cutting or filling a shape, and generated substantial lists to illustrate their findings. At this stage in the testing, the Filling Task did not include time for a collective discussion of those results, which we saw as a missed opportunity. The GSP demo, though brief, led to a discussion of the idea that the slices through the tetrahedron models and the various fill levels of water could be thought of as dilations. This was an important connection for participants and it motivated subsequent changes to our task design.
Our observations from this session also revealed that most participants were unfamiliar with GSP and needed more scaffolding than we had expected. In particular, constructing objects—some of which are not easy for the GSP beginner (e.g., the divided segment)—took considerable time, which distracted participants from attending to issues of dilation. Many participants did not connect the GSP activity of creating and dilating a polygon with the pattern activity illustrated in Fig. 2 or the 3-D model, and we hypothesize that this was a result of attention being focused too intently on constructing objects in GSP and the associated challenges. As one participant, Chris, commented “I couldn’t figure out how to divide the segment. We tried all kinds of things, but nothing worked and then time was up.”
4.1.3 Revisions
As a result of the first testing session, we made a number of modifications to both the 3-D model and the GSP task. As mentioned above, the slicing component of the 3-D model exploration posed significant difficulty. Participants struggled to slice the plasticine in such a way that the cross-section showed a scaled version of the shape’s base. As such, this approach failed to illustrate clearly the mathematical concepts we had intended and was thus not in line with our original learning goals and HLT (Simon & Tzur, 2004). In contrast, while the filling task had raised concerns about surface tension, the potential to use this opportunity to heighten the pedagogical sensitivities of using mathematical models with our preservice and practicing teachers motivated corresponding alterations to our HLT. Based on this testing session, we also made decisions about the timing and focus of the activity. Extending Gadanidis et al.’s (2004) observations regarding the importance of bridging pedagogical intent and interface design, we determined that the exploration should focus on just a few shapes, i.e., triangular- and square-based pyramids as a way to help direct participant attention (Sinclair, 2003). Further, we reasoned that pouring water gradually into a (stabilized) 3-D shape and examining the resulting surface shapes could promote understanding of proportional reasoning, one of our intended learning goals. Finally, based on our observations of participants’ activity–effect reflections (Simon & Tzur, 2004), we realized more explicit connections between important (for us) mathematical concepts ought to be made. Actually, it was more a lack of participants’ reflections that stimulated a change. For instance, from their (non)responses to items 3 and 4 of the 3-D model questionnaire (listed above), we noted that the majority of participants were not making connections between a scale factor’s effect on side length and area, nor on the effect that tilting a shape would have on volume and surface area. We reasoned that a more direct line of questioning was necessary.
The first testing of the GSP activity drew to our attention the need for substantial revisions. In resonance with Sinclair’s (2003) observations regarding directing student attention, and because of participants’ struggles with constructing polygons, we decided to shift to the use of preconstructed sketches. The intent was to lessen the cognitive demand on participants and to help maintain their focus on dilation. The revised screens were designed to lead the learner through sequenced interactive investigations of ratios in connection with dilation. We included a structured opportunity to dilate a pentagon, and eliminated the pattern activity altogether. These revisions were informed by Gadanidis et al.’s description of the importance of visual encoding of information—which they define as “the various devices and cues that depict the information to communicate its intended, underlying meaning accurately and help the user of the information to understand it correctly and easily” (2004, p. 283). Gadanidis et al. focus on a limited set of examples of visual encoding, such as colour choices and sizing, and we apply and extend this to include the considerations (discussed below) that influenced the design of our preconstructed sketches. Furthermore, we included written instructions and questions onscreen to help focus participants’ attention, as well as included specific prompts to help participants connect the GSP activity with the 3-D model investigation. We reemphasize that in the spatial visual domain many ideas span dimensions and we hypothesize that being able to move back and forth between 2- and 3-D is key to developing a deep understanding of the related geometric concepts. Thus, revisions were sensitive to aiding participants’ appreciation that a (2-D) diagram can encode both 2- and 3-D information—that is, it may evoke the image of a 3-D object (e.g., by showing one line “above” another), or it may include measurements which would only exist in 3-D (e.g., some lengths which would be impossible in a truly flat object).
In sum, as a result of this testing session we developed the 3-D model task to focus on filling large, transparent plastic polyhedra with water; we emphasized tilting the objects; we focused questions on proportional reasoning; and in light of the interest participants showed in making connections between the filling activity and the GSP demo, we deliberately linked the two tasks. We also decided to begin stage 2 testing with the GSP activity in order to investigate any changes or effects on participants’ ease in making connections between the 2- and 3-D representations of proportional reasoning. We hypothesized that participants’ familiarity with 2-D diagrams might stimulate comfort and exploration with the preconstructed GSP sketches, which could then be connected to the 3-D model.
4.2 Task draft 2: from 2- to 3-D
4.2.1 Content
As mentioned, in this stage of task development, we decided to begin with the GSP activity and then transition into the 3-D model exploration. The revised GSP task included eight preconstructed GSP sketches (collected in one file) that addressed linear and area relationships of scaled figures through dilation. All instructions and prompts were included onscreen to encourage learners to focus on the sketches. Printouts of the screens were provided for recording purposes.
Sketches were designed to be done in sequence, partly to ensure that participants learned GSP procedures at a modest pace, and partly to build mathematical ideas. Aware of the tendency for elementary teachers to hold an instrumental (Skemp, 1976) view of mathematics, and in particular geometry, many of our design choices were made with the goal of enriching participants’ relational understanding. By providing opportunities for participants to create connections between their developing visual sense and their knowledge of formulae, we hoped to prevent in the long term what Skemp (1976) refers to as a serious mismatch—pupils whose goal is to understand relationally, taught by a teacher who wants them to understand instrumentally. We were also aware of a possible mismatch between our intended learning goals and learner-directed goals (Simon & Tzur, 2004), which we anticipated might be instrumental in nature. As a result, we made many deliberate choices in the design features of our sketches to emphasize relational connections. Due to space considerations, we discuss only a selection of them.
We decided to focus the GSP activity on the dilation of a triangle since it is easily manipulated by dragging and is a natural 2-D analogue of a pyramid. The first screen of our sketch in this task draft was identical to the demo dilation sketch from the first task draft (which is depicted in Fig. 1 above). As before, all screens were designed in light of the idea that visual cues such as colour, orientation, location on the page, etc. play an important role in learners’ noticing of relevant mathematical ideas (Gadanidis et al., 2004). In designing subsequent preconstructed sketches, we aimed to push the dilation exploration further by adding various features. For instance in Fig. 3 below, the third screen of the investigation is depicted. It is a copy of the first screen (Fig. 1) with the inclusion of architectural measurements of segments and calculated ratios that could be hidden or shown by clicking the provided corresponding button. The slider and “slider position” buttons gave participants freedom to control the scale factor, while the ratios and measurements were intended to help participants connect a visual sense of dilation with the results they would get from applying a formula.

Screen 3, GSP activity testing stage 2
In our design, we again were sensitive to the fact that screen clutter may be disruptive, which is not to say that representations should be sparse, but that “presented information should bring out the meaning of the information faithfully” (Tufte as cited in Gadanidis et al. (2004), p. 284). Screen 3, Fig. 3, included a lot of information; however, we expected participants to be comfortable enough with linear scaling (and also due to their previous exploration of an analogous dilation) that they would not feel overwhelmed by the measurements. However, when designing a screen that would draw participants’ attention to the surprising (for them) relationship between areas of dilated figures, for example, our sketch revisited the images of the first and third screens, but without the measurements of segments, and with “hide/show” buttons to allow participants to move between strictly visual representations and the numerical relationships. We expected that less detail on the linear aspects of the sketch would allow participants to focus their attention on the new idea of ratio of areas, and that the “hide/show” buttons would help make connections between a visual representation and the formulaic results. Text instructions and prompts directed attention to possible mathematical relationships, and tended to be open in nature. These included questions such as “What do you notice when you drag the slider?” and “What is the relationship between the scale factor and the ratio of areas?” We acknowledged that verbal/text prompts and questions are key to supporting mathematical understanding during technological investigations (Sinclair, 2003), as is directed dragging in the specific case of dynamic geometry software activities (Arzarello, Micheletti, Olivero, Robutti, & Paola, 1998). Such directed dragging was encouraged on several screens of the GSP activity. As mentioned, in this session, the GSP task preceded the 3-D model task; as we will discuss later, we have chosen to reverse this orde0r in recent iterations of the activity.
The second task draft of the 3-D model exploration involved filling experiments with pyramids, both square- and triangular-based. The focus was on observing and comparing side lengths and areas of the surface shapes while the pyramid was in the upright position, and then in a tilted position. In addition, participants were challenged to find how many different types of shapes (i.e., triangle, quadrilateral, etc.) they could create by filling and tilting the pyramid, and what their findings implied for cut surfaces of other 3-D shapes. Prompts and questions were more directed than in the first testing stage, with the intention of offering more scaffolding and transparency with regard to our learning goals. Specific prompts included the following:
-
1.
Using the materials provided, embed the bottom vertex of a pyramid in play dough so that the top is parallel to the table.
-
(a)
Pour in a small amount of water—record as best you can the shape of the surface of the water from the top (e.g., with a picture, verbal description…).
-
(b)
Pour in an additional amount—record the shape.
-
(c)
Pour again—record.
-
(d)
Compare the shapes you have drawn as to their lengths of sides, surface area, and volume.
-
(a)
-
2.
Repeat #1 for the same pyramid tilted at a different angle.
Accompanying these two questions was a chart for recording purposes, depicted as a scaled version in Fig. 4.

3-D exploration worksheet, testing stage 2
In the case of the triangular-based pyramid, the filling activity linked closely to the work we designed for the GSP task, providing a concrete model of dilation. In both cases, successive surfaces that accompanied pouring different amounts of water acted as the “dilating triangles” and the bottom vertex of the pyramid as the center of dilation. With a more explicit link between the 3-D model task and the GSP task, we saw the filling experience as a preparatory, kinesthetic experience to the more visual, symbolic, and numerical work in the GSP task. We hypothesize that the experience of displacing water and feeling a change in weight as the volume in the pyramid increases and the volume in the watering can decreases contributes to an embodied and intuitive sense of proportion. An individual can physically feel a change in weight as he or she visually sees a change in volume. However, research into the pedagogical consequences of such an embodied sense is beyond the scope of this paper.
4.2.2 Testing
The second task draft was tested in a 2-h session with 24 elementary and middle school teachers. In this session, we began with the GSP investigation. As in stage 1, participants shared insights, strategies, and understandings during whole group and small group debriefing sessions with members of the research team. Many participants in this testing stage had limited mathematical background (i.e., nine of the 24 had taken only to high school mathematics). Thus, as one might expect, participants found it difficult to communicate mathematical ideas. One factor was the lack of specific vocabulary (e.g., polygon, rhombus, dilation). In the GSP task specifically, we noted that the lack of mathematical knowledge was most obvious in the participants’ expressed surprise that dilation involved a “center of dilation”.
In general, we found that participants were hesitant to explore (i.e., play with) shapes on their own (both with the GSP and 3-D model parts of the task). As in the first stage of testing, these participants had little to no experience with GSP. Our revisions to the prior task draft had incorporated interface and pedagogical considerations (Gadanidis et al., 2004), and motivated the inclusion of preconstructed sketches, so there was little need for participants to know GSP procedures. Despite these considerations, participants’ use of dragging appeared restricted and hesitant, rather than directed and purposeful. We also noted that participants were moving step-by-step through the screens but were not making connections between them; they seemed to lack an overall picture of the activity. For instance, there was an absence of screens being revisited, despite the complementary nature of the screens’ designs. Another indication was participants’ general surprise during the debriefing discussion, where we observed comments such as “oh, ya, that’s the same thing in screen 1”. The debriefing sessions did help pull ideas together, but we registered a need to improve connections within the GSP activity.
During the 3-D model task, participants had difficulty making mathematical connections around scaling, similarity, and proportional reasoning. In resonance with Eisenberg and Dreyfus’s suggestion (1991), participants demonstrated a preference for numerical reasoning over visual reasoning. They became distracted with making measurements, pushing calculations, and seeking formulae, rather than trying to “see” the possible connections and compare the overall proportional changes. Further, their calculations were at times disconnected from the visual representation. Examples of such disconnect included using volume formulae to compare surface areas, and confounding measurements of lengths such as measuring the depth of the water and using that measurement to find the area of the surface shape. We interpreted this as a reliance on their instrumental understanding (Skemp, 1976) of proportion. We further connect this to participants’ goal-directed activity as the “goals that learners can set are a function of their current conceptions and related to the task at hand” (Simon & Tzur, 2004). In particular, we connect conceptions of geometry as a memory and logic exercise with learning goals that are instrumental in nature. In an attempt to foster relational understanding, we encouraged participants to attend to the visual relationships and make connections with the prior GSP activity, rather than focus on the numerical measurements they had introduced. We also encouraged them to use the strategies that we had used in our sessions during task development (e.g., reorienting oneself, repeated filling of the shapes at different angles, considering extreme positions of shapes, amounts of water, and sketch configurations) and found that this helped them to make progress in exploring and connecting the mathematics ideas. For instance, Tyler had demonstrated behaviour typical of participants who were reluctant to explore or investigate. When attending to the written instructions to tilt the pyramid at a different angle, Tyler varied the angle minimally and questioned how much he was “allowed” to tilt the pyramid. We suggested he try a variety of angles, and “go as far as you can” to see what changes occurred. Although hesitant at first, Tyler gradually tilted the pyramid to consider extreme positions and did so with varying amounts of water (Fig. 5). He commented, “I wouldn’t have thought to tilt the pyramid so far because the surface shape would be so different and so maybe kind of pointless to do that. But it was cool how no matter how far it goes [the pyramid tilts] you can still see how the shape gets bigger or smaller depending on how much water there is but basically still looks the same.” Tyler’s comment suggests that through his exploration, he has begun to develop a visual sense of proportionality and similarity of shapes.

Tilting the pyramid: first a little, and then a lot
As noted earlier, the GSP and 3-D model tasks were linked after the first task draft stage. Specifically, relationships between the areas of the scaled dilated triangles were linked to the relationships between the areas of the water surfaces at different levels. Comments showed that some participants could see the GSP sketch in 2- and (simulated) 3-D immediately; for others, the activity of filling the pyramids helped them make the connection. For instance, on filling a tetrahedron with water Rhonda and Flora experienced an AHA! moment when they noticed the connection to exploring the dynamic geometry sketch on dilation: “It’s a ratio—this is the same as in the program.” Such connections to proportional reasoning were supported by the access to measurements and ratios provided in the prebuilt GSP sketches. Another pair, while exploring the shape of the water surface in their triangular-based pyramid, used the word “dilation” to describe the changes caused by pouring in additional water, showing that they had also made a connection between the two tasks.
4.2.3 Revisions
While a modest number of participants recognized the link between the two subtasks on their own, we decided in our revisions to include more opportunities for connection-making and reflections. One such revision was to reverse the order and place the 3-D model task first and the GSP dilation task second. While our intention is that subsequently learners will work back and forth between the two contexts, we contend that the hands-on investigation is better preparation for the GSP task, than the GSP task is for working with the 3-D models. Specifically, our thinking draws on various perspectives. First, children initially learn mathematical ideas from their 3-D experience of the world and only later are schooled into thinking in 2-D, i.e., going from 3-D to 2-D is a more natural sequence (Whiteley, 2004). Second, elementary teachers often lack mathematical background (cf., Ball et al., 2005; Thanheiser, 2009) and view mathematics as “received knowing” (Cooney, 1999), which is at odds with an exploratory/investigative approach, and we found that these deficiencies were more easily addressed during the group-based hands-on investigations than when participants were working with the software. These considerations are analogous to interface considerations described by Gadanidis et al. (2004) who contend that the arrangement of ideas intended to be communicated “mediates student engagement” (p. 275).
In response to our observations regarding participants’ instrumental goal-directed activity, we made several additions to the worksheet package that accompanied the 3-D model exploration. Our intention, and the corresponding effect for participants, was to shift focus away from number/formula pushing and toward connection-making and heightened visual spatial sense. We hypothesized that asking participants to “compare the shapes you have drawn as to their lengths of sides, surface area, and volume” without follow-up that explicitly directed attention toward our intended learning goals, contributed to activity regarding measurements, and confounded calculations that we observed. Accordingly, the questions we added to the worksheet prompted participants to reflect on both qualitative and quantitative aspects. We also included a preliminary set of questions that asked participants to anticipate or imagine the effects of this activity and its connection to mathematics (as they understood mathematics). These revisions connect to Simon and Tzur’s (2004) “criteria for identifying an effect as being part of the learning process: (a) that the students could pay attention and would tend to pay attention to the effect, and (b) that the effect can contribute to the intended learning” (p. 98). We hypothesized that the line of questioning introduced in these revisions would encourage participants to pay attention to visual spatial aspects and to connection-making, and that the effect might contribute to a heightened understanding of proportion and dilation, as well as a new appreciation for the visual spatial component of geometry (rather than the memory/exercise component we had previously observed).
Considerations along these same lines led to substantial changes in the GSP activity as well. We revised screens and included explicit names for each, e.g., explore transform, scale factors. These titles, with a short description of that section of the activity, as well as several prompts, were provided as a worksheet addendum to the activity. Our intention was to emphasize the key points of each screen and to add more scaffolding to help draw attention to various proportional changes and their corresponding relationships. Though instructions were still embedded in the sketches, we developed the worksheet to provide a “big picture”—that is, to help reveal the structure of the task. We also added global questions such as, “What questions do you have about what is happening? Can you think of measurements, etc. you would like to see? Please explain.” Thus, instructions for the GSP task had undergone considerable revising and we hoped that future task drafts would be more successful at directing participants towards the intended learning goals.
Though not strictly part of the task draft, our revisions also included development of an introductory GSP session. The session provides an overview of the toolbox, and opportunities to use and explore items in the construct, transform, and measure menus.
4.3 Task draft 3: from 3- to 2-D
4.3.1 Content
As indicated, in this task draft, the 3-D model task preceded the GSP task. A brief demonstration of pouring water into shapes was used as an introduction, and participants were encouraged to “play” and to record their findings. Instructions for the GSP task prompted participants to work on the first two sketches in sequence, and then to explore, guided by their interests, the subsequent sketches. Worksheet questions for this, our most recent task draft, as well as snapshots of a selection of the GSP screens, are included below in Appendix A and B, respectively.
4.3.2 Testing
Our most recent task draft was tested with a group of 18 elementary teacher candidates. Activities were done in pairs, with one worksheet, one set of materials, and one laptop per pair. As in the first two stages, participants had various difficulties and successes. Their limited mathematical background again made it difficult for them to communicate and to make correct observations; and as before, participants were distracted by imperfections such as the effects of surface tension. Nevertheless, the participants playfully explored the 3-D models, generating long lists of different surface shapes and they even initiated looking at extreme cases (e.g., by using very large angles for tilting).
In this stage of testing, due to class time considerations, the GSP introduction was conducted a week prior to the Filling Task exploration. This eased the cognitive demands on participants, and we noticed that they were more confident about using GSP (e.g., dragging, modifying sketches) during the exploration than in previous testing stages. However, we noted that many participants had difficulty interpreting GSP measurements, in particular when GSP calculations yielded the same result for ratios of varying segment lengths for a given scale factor, there was confusion as to whether or not the program was recalculating data. Also, round-off errors in length measurements made it difficult for participants to recognize proportional relationships. As in the first stage, we noticed that some participants ignored onscreen instructions—their investigations were dictated by the questions on the worksheet. As a result, they played with sketches simply by dragging the main shapes and missed a number of opportunities built into the sketches. In contrast to the first stage however, this behaviour was limited to a minority (four out of 18) of participants.
As in the stage 2 testing, the link between the GSP and the 3-D model tasks was noticed explicitly by participants. One example was quite striking—a participant looked at the very first sketch—two dilated triangles and a point labelled “center of dilation”—and said to her partner, “Do you not see lines here connecting these here and here?” pointing to the center point and corresponding vertices in triangles and actually connecting them with her ruler held in front of the screen. She was referring to lines that were not visible on the screen, yet she was “110% sure it’s a pyramid.” Overall, we found that participants made connections between the two sub-tasks more explicitly; we attribute this to the revisions, which provided clearer opportunities to notice the relationships. However, we continue to see significant difficulty with the “scaling of area” and are developing representations to address this problem in future task drafts.
5 Discussion
Through this lengthy (and still unfinished) process, we have worked to problematize a spatial visual task that will help elementary and middle school teachers broaden their understanding of dilation, ratio, and proportion. That is, variations of the task have been tested, discussed, and revised with respect to KDUs and an HLT (Simon, 2006; Simon & Tzur, 2004) that evolved over time to meet the needs of our participants.
Our testing process has shed light on KDUs in the area of visual–spatial proportional reasoning, as well as in the area of mathematics pedagogy. We identify features specific to a visual spatial sense of proportion including:
-
(a)
Making connections between 3-D models and their 2-D analogues, e.g., “seeing” the lines of the pyramid in the GSP sketch;
-
(b)
Appreciating dilation as a transformation which is applied to a shape and which has a center, and gaining a visual sense of “how much bigger” length, area, or volume become;
-
(c)
Identifying features that are preserved (or not)—for instance when a 3-D model is tilted at various angles, or when points on a GSP sketch are dragged;
-
(d)
Noticing mathematically significant details and ignoring “distracters” such as physical imperfections of models.
We elaborate here on points (c) and (d), taking points (a) and (b) as relatively straightforward. Identifying features that are preserved is a broad KDU, relating to invariance under transformations in general. A key aspect of generalizing and building a robust concept is appreciating which “changes” or “variations” preserve key properties, and which break the connections. With respect to a visual spatial sense of proportion, this can offer important intuitive and embodied senses of area, volume, and proportional change. Further, we contend that dynamic tools assist this process by allowing repeated observation, sometimes with an animation that lets you sit back and “watch”, sometimes with an affordance that allows you to freeze the image in steps giving you time to stop and reflect.
With regard to point (d) noticing mathematically significant details, we note that awareness of the physical limitations of mathematical models can be interpreted as a KDU in the area of mathematical modeling, as well as in visual reasoning and in teachers’ pedagogical knowledge. As such, we extend Simon’s (2006) notion of KDU beyond the realm of mathematics and into that of mathematics pedagogy. In particular, we argue that a teacher’s sensitivity to the practical constraints of a model, or of technology, can (as it did for us as task designers) open the door to important learning opportunities. For instance, after our first stage of testing, we noticed considerable challenges with the materials in our models. Our response at first was to improve our materials—we eliminated the plasticine slicing and focused on the filling aspect. During the second stage of testing, we were aware of the potential for confusion around the effects of surface tension and made use of the opportunity to raise participants’ awareness of the limitations of physical models and to help them focus on the mathematically significant features, e.g., visualizing the perfect tetrahedron, or the imagined line of symmetry of a perfect isosceles triangle—both of which were represented physically (and imperfectly) with the plastic model and the water surface. In this process, our participants were learning (as the developers had earlier) what features were distracting, and which were relevant to their reasoning. Such a process can draw the learner into a meta-dialogue about mathematical ideas that we believe is particularly appropriate for preservice and practicing teachers.
In keeping with our grounded theory approach, we further connect features (a)–(d) listed above to broader categories of visual–spatial investigations that emerged as themes during our data analysis. We first note, and then elaborate upon, three main categories:
-
1.
Developing exploration strategies
-
2.
Recognizing mathematical ideas across strands and dimension
-
3.
Seeing the mathematics.
Regarding the first category, developing exploration strategies, we note participants’ reluctance and even inability to explore independently with 3-D models or computer software. This category is illustrated by, for instance, Tyler’s hesitant tilting of the pyramid, as well as participants’ inclination to introduce formulae to “solve” rather than to explore and observe changes. There were also various incidents of participants’ reluctant dragging of points or line segments during the GSP investigation, and a tendency in the early stages of testing to move step-by-step through the GSP screens without exploring connections between them. This category is connected to the KDU listed as item (c) above: Identifying features that are preserved (or not) when the 3-D model was tilted at various angles, or when points, etc., on the GSP sketch were dragged, since it is only through exploration strategies that one is in a position to draw conclusions.
Recognizing mathematical ideas across strands and dimension is a category that emerged with strong support in the data during each of the testing stages. Participants in early testing did not identify connections between concepts such as dilation and similarity, or between 2- and 3-D instantiations of concepts. The frequency and ease of recognizing mathematical ideas across strands—that is, making connections between different representations—increased with subsequent task drafts, particularly as our questioning became more directed and as links between GSP screens were more explicitly drawn. As indicated by the AHA! moment of Rhonda and Flora (“It’s a ratio—this is the same as in the program”), making connections between mathematical ideas across dimensions—between the 3-D models and their 2-D analogues (item (a) of our KDUs)—facilitated connection-making between concepts and across strands. The ability to “see” the lines of the pyramid in the GSP sketch drew attention, for instance, to the fact that the different cross-sections of the pyramid (i.e., the surfaces associated with different levels of water) were similar, and also to the idea of dilation as having a center. We found further evidence in the data of connection-making across numerical and geometric representations, which occurred in later testing stages and which was noticeably absent in the first testing stage. Careful visual encoding of the GSP task, for example, kept the focus of investigation on visual aspects, but also provided access to measurements and ratios to help solidify concepts.
The third category observed in the data we refer to as seeing the mathematics. It was clear at all levels of testing—though with encouragement and support, participants in later sessions fared better—that these teachers and teacher candidates were not doing the type of things associated with KDUs (b) appreciating dilation as a transformation and gaining a visual sense of “how much bigger” length, area, or volume become; and (d) noticing mathematically significant details and ignoring “distracters” such as physical imperfections of models. We observed a lack of non-numeric solving strategies, as well as a reliance on formulae and measurement, combined with a lack of terminology for describing what they saw.
Taken together, these categories present a picture of participants who had trouble progressing beyond a superficial investigation. Many lacked strategies for engaging mathematically with the objects, were unaware of and lacked experience with making connections between strands and dimensions, and were unable to “see” (and talk about) mathematical details in objects and dynamic sketches. In later versions of the tasks, we helped participants by giving specific suggestions (i.e., try tilting the pyramid to extremes), explicitly pointing out connections (through screen statements and sketch provisions), and asking more focused questions about what they were observing, but we are far from having achieved complete success.
We suggest that the underlying difficulties faced by participants are related to what Cooney (1999) refers to as “received knowing”. In this respect, our participants differ from young children who are still open to investigating and wondering. In our jurisdiction, elementary teachers seldom have a strong background in university mathematics and have often been taught mathematics via traditional methods that include: telling students how and what to do, teaching topics separately and disjointedly, and having students memorize rather than discover or notice mathematical details. We believe that this shared mathematical experience explains what we observed—adults unsure of how to proceed or explore; adults who could not, without significant help, make connections; adults who were often unable to separate a mathematical detail from a general one.
Though the adults in our sessions were actively “doing something” most of the time, we suggest that they were still not engaging with the big ideas within the mathematics. They expected that at some point, we would draw everything together and tell them what it all meant. Thus, we theorize that in order to develop spatial visual reasoning for elementary school topics, adults (specifically elementary teachers and teacher candidates without substantial mathematics background) need to engage in tasks that first and foremost take into consideration the tendency to see math as received knowledge. These tasks, as we have shown in our delineation of the task drafts for this research, must be carefully structured to ensure that participants develop exploration strategies, build connections, and learn to notice mathematical details in geometric situations.
6 Concluding remarks
This paper exemplifies task problematization in the spatial visual domain of elementary and middle school mathematics, and offers the construct of task drafts as a theoretical mechanism within which task problematization can occur. Through our analysis of the content of and response to various task drafts of The Filling Task, we shed light on the specific needs of prospective and practicing teachers that impact a researcher’s construction of hypothetical learning trajectories, HLTs, (Simon & Tzur, 2004) for this demographic. We identified three categories that emerged from the data—developing exploration strategies; recognizing mathematical ideas across strands and dimension; and seeing the math—that connect to KDUs (Simon, 2006) of a visual–spatial sense of proportional reasoning.
Our study extends our understanding of spatial visual learning with elementary teachers. It confirms Arcavi’s (2003) challenges around visualisation (cultural, cognitive, and sociological). For instance, we found it necessary to continually moderate the cognitive demand of our spatial visual tasks by modifying the tasks themselves and by emphasizing the use of explicit visual strategies with the participants. In respect to Arcavi’s cultural challenge, our findings indicate that mathematical engagement for elementary teachers and teacher candidates must attend to the consequences of their views and expectations of mathematics. Our observations in this area resonate with Cooney’s (1999) work. We found that our participants’ approaches towards learning mathematics were primarily passive—i.e., they did not reflect the curiosity, question posing, and active search for answers that we associate with doing mathematics. Both pre- and in-service teachers were hesitant to explore or investigate properties; they relied on memorized bits of information and equations, and expected us to reveal the “answers”. This suggests that the participants had experienced mathematics as “received knowing” (Cooney, 1999); they had not learned appropriate exploration strategies and thus were often unable to benefit from opportunities to observe connections between different representations of concepts. Our research illustrates the importance of developing tasks that will help elementary teachers revise their approach to mathematics, e.g., tasks that require physical exploration strategies, tasks that focus attention on connections between dimensions or mathematical strands, and tasks that support posing and answering questions.
Although Arcavi’s sociological challenge relates to different visualisation abilities of different cultural groups, we propose that it may also be appropriate for thinking about the visualisation abilities of those who have been schooled differently. In this respect, our study extends earlier research in the area of geometry learning (cf., Del Grande, 1990; Lehrer et al., 1998; Wheatley, 1990; Yakimanskaya et al., 1991) by drawing attention to ways in which educating teachers is different from educating children. In particular, our early observations suggested that the geometry background of our participants, which had focused on geometry as a logic and memory exercise, hampered participants’ ability to use spatial visual skills. Our subsequent refinements of The Filling Task sought to address this important issue.
In conclusion, The Filling Task was designed through consideration and integration of three theoretical perspectives that speak to the mathematical and pedagogical sensitivities required for task design. We extended Gadanidis et al.’s (2004) and Sinclair’s (2003) work on the design of technological tasks to the design of activities for pre- and in-service teachers that integrated opportunities for exploration with dynamic geometry software and with 3-D physical models. We further connected these task design considerations to Simon and Tzur’s (2004) construct of the hypothetical learning trajectory, which in our research was continually refined and developed through the analysis and interpretation of adult participants’ engagement with various task drafts. Aware of our adult participants’ broader knowledge base, we designed The Filling Task to support the investigation of proportional reasoning in geometric contexts using spatial visual skills; as we became aware of their reticence around spatial visual exploration, we refined the task to support development of abilities in spatial investigations. We believe that the task at this stage provides the opportunity for prospective and practicing teachers to develop flexible imagery, in which changes can be explored mentally, and other variations not seen externally can be imagined. Using our newly acquired understanding of the categories of teacher learning listed above, and of key developmental understandings specific to teachers’ learning trajectories, we continue to modify the task with the goal of helping teachers and teacher candidates “see” as mathematicians do.
7 Appendix A—The filling task worksheets
Note: spaces for student responses have been removed.
Pretask questions
Imagine you have poured water into the pyramid…
-
1.
What shape(s) do you expect to find?
-
2.
Do you expect the shapes to change as you add more or less water? Why or why not?
The 3-D model activity:
-
1.
Using the materials provided, embed the bottom vertex of a pyramid in play dough so that the top is parallel to the table.
-
(a)
Pour in a small amount of water—record as best you can the shape of the surface of the water from the top (e.g., with a picture, verbal description…).
-
(b)
Pour in an additional amount—record the shape.
-
(c)
Pour again—record.
-
(d)
Compare the shapes you have drawn as to their lengths of sides, surface area, and volume.
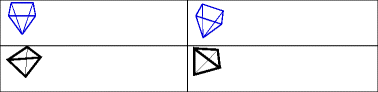
-
(a)
-
2.
Repeat #1 for the same pyramid tilted at a different angle
-
3.
Repeat #1 and #2 for the other shaped pyramid.
-
4.
Recalling step 1, describe in your own words what was happening to each of the dimensions of the water’s shape as (1) more water was added, and (2) some water was poured out. Please describe how the changes in dimensions are related, if they are.
-
5.
Reflect on steps 1 and 2 above.
-
(a)
In what ways, if any, did the shape of the surface area change when you tilted the pyramid?
-
(b)
In what ways did the shapes’ measurements change?
-
(c)
Do the same observations you made in question 4 above hold true for this new shape? Why or why not?
-
(a)
-
6.
How many different shapes in the top surface of the water can we create by tilting the pyramid in different ways? Please sketch them.
-
7.
Do the same observations you made in question 4 above hold true for these new shapes? Why or why not?

The GSP dilation activity:
The questions in this section are numbered to correspond with the pages in the GSP sketch. You are not required to explore all of the pages. Take your time with the ideas and concepts that are most striking to you. Please wait to explore questions 7 and 8 until after the class discussion.
-
1.
Explore dilations: drag and explore. What questions do you have about what is happening? Can you think of measurements etc. you would like to see? Please explain.
-
2.
Explore transform: the sketch was made with the dilation tool of the transform menu. See how it works on a general shape. Could this be done with any shape? How do you know?
-
3.
Scale factors: this page lets you use a slider to explore the effect of changing the scale factor. Note: The scale factor is the ratio of the sides of the two copies. What do you notice?
-
4.
Measured ratios: in this page, we have measured some ratios. What do you notice? When you drag the points of one of triangles—what happens to the ratios? Please explain.
Are there other ratios you would like to see measured?
-
5.
Ratios to center: in this page, we measure some other distances. What are you seeing? What happens to ratios as you drag the points? Please explain.
What happens when you move the slider? Please explain.
-
6.
Scale area: we have looked at how various lengths scale. How does the area scale? Please explain.
Can you predict a formula for how the area scales when the scale factor of the sides is r? Please explain the reasoning behind your prediction.
-
7.
Scale drawing: this revisits the production of a scale drawing. How does this connect to dilation?
-
8.
In your opinion, how does this activity relate to the watering can activity? Please explain.
8 Appendix B—The filling task GSP sketches
Screen 1: Dilations (exploring visually)

Screen 3: Scale Factors (directed exploration)

Screen 6: Scale Areas (connecting visual and numerical understanding)

Screen 8: Discussion (connecting the 3-D model and the GSP activity)

References
Arcavi, A. (2003). The role of visual representations in the learning of mathematics. Educational Studies in Mathematics, 52, 215–241.
Arzarello, F., Micheletti, C., Olivero, F., Robutti, O., & Paola, D. (1998). A model for analysing the transition to formal proofs in geometry. In A. Olivier & K. Newstead (Eds.), Proceedings of the 22nd Conference of the International Group for the Psychology of Mathematics Education (Vol. 2, pp. 24–31). Bellville, South Africa: Kwik Kopy Printing.
Ball, D. L., Hill, H. C., & Bass, H. (2005). Knowing mathematics for teaching: Who knows mathematics well enough to teach third grade and how can we decide? American Educator Fall, 2005(14–22), 43–46.
Battista, M. T., Wheatley G. H., & Talsma, G. (1982). The importance of spatial visualization and cognitive development for geometry learning in preservice elementary teachers. Journal for Research in Mathematics Education, 13(5), 332–340.
Bryant, P. (2009). Key understandings in mathematics learning paper 5: Understanding space and its representation in mathematics. University of Oxford. Available at: www.nuffieldfoundation.org.
Clements, D. H. (1999). Geometric and spatial thinking in young children. In J. Copley (Ed.), Mathematics in the early years (pp. 66–79). Reston, VA: National Council of Teachers of Mathematics.
Clements, D. H. (2002). Computers in early childhood mathematics. Contemporary Issues in Early Childhood, 3(2), 161–181.
Conference Board of the Mathematical Sciences. (2001). The mathematical education of teachers. Providence RI and Washington DC: American Mathematical Society and Mathematical Association of America.
Cooney, T. J. (1999). Conceptualizing teachers’ ways of knowing. Educational Studies in Mathematics, 38, 163–187.
Del Grande, J. (1990). Spatial sense. Arithmetic Teacher, 37(6), 14–20.
Eisenberg, T., & Dreyfus, T. (1991). On the reluctance to visualize in mathematics. In W. Zimmermann & S. Cunningham (Eds.), Visualization in teaching and learning mathematics (pp. 25–38). USA: Mathematical Association of America.
Gadanidis, G., Sedig, K., & Liang, H.-N. (2004). Designing online mathematical investigation. Journal of Computers in Mathematics and Science Teaching, 23(3), 273–296.
Gal, H., & Linchevski, L. (2010). To see or not to see: Analyzing difficulties in geometry from the perspective of visual perception. Educational Studies in Mathematics, 74, 163–183.
Glaser, B. G. (2002). Conceptualization: On theory and theorization using grounded theory. International Journal of Qualitative Methods, 1(2), 23–38.
Glaser, B. G., & Strauss, A. L. (1967). The discovery of grounded theory: Strategies for qualitative research. Chicago: Aldine.
Goldenberg, E. P., & Cuoco, A. A. (1998). What is dynamic geometry? In R. Lehrer & D. Chazan (Eds.), Designing learning environments for developing understanding of geometry and space (pp. 351–368). Mahwah, NJ: Lawrence Erlbaum Associates.
Goldin, G. (1998). Representational systems, learning, and problem solving in mathematics. Journal of Mathematical Behavior, 17(2), 137–165.
Guven, B., & Kosa, T. (2008). The effect of dynamic geometry software on student mathematics teachers’ spatial visualization skills. The Turkish Online Journal of Educational Technology, 7(4), 11–18.
Hershkowitz, R., Ben-Chaim, D., Hoyles, C., Lappan, G., Michelmore, M., & Vinner, S. (1989). Psychological aspects of learning geometry. In P. Nesher & J. Kilpatrick (Eds.), Mathematics and cognition (ICMI Study Series) (pp. 70–95). Cambridge: University Press.
Koedinger, K. R. (1992). Emergent properties and structural constraints: Advantages of diagrammatic representations for reasoning and learning. Paper presented at the AAAI Spring Symposium Series: Reasoning with Diagrammatic Reasoning.
Lampert, M. (1992). Problems in teaching authentic mathematics. In F. Oser, D. Andreas, & J. Patry (Eds.), Effective and responsible teaching: A new synthesis (pp. 295–314). San Francisco: Jossey-Bass.
Lanius, C. S., & Williams, S. E. (2003). Proportionality: A unifying theme for the middle grades. Mathematics Teaching in the Middle School, 8(8), 392–396.
Lehrer, R., Jenkins, M., & Osana, H. (1998). Longitudinal study of children’s reasoning about space and geometry. In R. Lehrer & D. Chazan (Eds.), Designing learning environments for developing understanding of geometry and space (pp. 137–168). Mahwah, NJ: Lawrence Erlbaum Associates.
Ma, L. (1999). Knowing and teaching elementary mathematics: Teachers’ understanding of fundamental mathematics in China and the United States. Hillsdale, NJ: Lawrence Erlbaum Associates.
NCTM (National Council of Teachers of Mathematics) (2000). Principles and standards for school mathematics. Reston, VA.
Presmeg, N. (1997). Generalization using imagery in mathematics. In L. English (Ed.), Mathematical reasoning. Analogies, metaphors and images (pp. 299–312). Mahwah, NJ: Erlbaum.
Reiber, L. P., & Matsko, M. J. (2001). Serious design for serious play in physics. Educational Technology, 1, 14–24.
Robichaux, R. R. (2005). The improvement of spatial visualization: A case study. Journal of Integrative Psychology, 4(2).
Sierpinska, A. (2004). Research in mathematics education through a keyhole: Task problematization. For the Learning of Mathematics, 24(2), 7–15.
Simon, M. A. (1995). Reconstructing mathematics pedagogy from a constructivist perspective. Journal for Research in Mathematics Education, 26(2), 114–145.
Simon, M. A. (2006). Key developmental understandings in mathematics: A direction for investigating and establishing learning goals. Mathematical Thinking and Learning, 6, 91–104.
Simon, M. A., & Tzur, R. (2004). Explicating the role of mathematical tasks in conceptual learning: An elaboration of the hypothetical learning trajectory. Mathematical Thinking and Learning, 6(2), 91–104.
Sinclair, M. P. (2003). Some implications of the results of a case study for the design of pre-constructed, dynamic geometry sketches and accompanying materials. Educational Studies in Mathematics, 52(3), 289–317.
Skemp, R. R. (1976). Relational understanding and instrumental understanding. Mathematics Teaching, 77, 20–26.
Smith, G. G., Gerretson, H., Olkun, S., Yuan, Y., Dogbey, J., & Erdem, A. (2009). Stills, not full motion, for interactive spatial training: American, Turkish and Taiwanese female pre-service teachers learn spatial visualization. Computers & Education, 52, 201–209.
Thanheiser, E. (2009). Preservice elementary school teachers’ conceptions of multidigit whole numbers. Journal for Research in Mathematics Education, 40(3), 251–281.
Wheatley, G. H. (1990). Spatial sense and mathematics learning. Arithmetic teacher, 37(6), 10–11.
Whiteley, W. (2004). Teaching to see like a mathematician. In G. Malcolm (Ed.), Multidisciplinary approaches to visual representations and interpretations. Studies in multidisciplinarity (vol 2) (pp. 279–292). Amsterdam: Elsevier.
Yakimanskaya, I. S., Wilson, P. S., & Davis, E. J. (1991). The development of spatial thinking in schoolchildren. Reston, VA: National Council of Teachers of Mathematics.
Author information
Authors and Affiliations
Corresponding author
Additional information
Brief description of article: An analysis of research funded by SSHRC that used designed tasks to investigate teachers’ development of visual and spatial skills related to geometry.
Rights and permissions
About this article
Cite this article
Sinclair, M., Mamolo, A. & Whiteley, W.J. Designing spatial visual tasks for research: the case of the filling task. Educ Stud Math 78, 135–163 (2011). https://doi.org/10.1007/s10649-011-9315-4
Published:
Issue Date:
DOI: https://doi.org/10.1007/s10649-011-9315-4