
Abstract
The residential building sector regularly satisfies a diverse range of housing needs whilst addressing respective capital-cost considerations. Designers and builders must also be aware of the environmental implications of their design specifications; the work here adds to a body of knowledge concerned with carbon footprint and embodied energy demand, specifically through an examination of alternative roof-covering materials. A life cycle assessment (LCA) has been carried out, within a West Australian context, to compare impacts for the roof specification options of: clay tile; concrete tile; and sheet metal. In locations where recycling facilities are unavailable and thus disregarded, it is found that clay tiles have the lowest carbon footprint of 4.4 t of CO2 equivalent (CO2e-) and embodied energy demand of 52.7 Mega Joule (MJ) per 100 m2, while sheet-metal roofing has the highest carbon footprint (9.85 t of CO2e-), with concrete roof tiles having the highest embodied energy demand (83 MJ). Findings confirm that a sheet-metal roof can obtain significant carbon and embodied energy saving benefits (i.e. 71–73%) compared to clay tile or concrete roof covers through ongoing encouragement of recycling strategies and increased local recycling facilities able to embrace residual cradle-to-cradle material reuse.
Introduction
The construction industry globally consumes 40% of natural materials, 40% of the total primary energy, 15% of the world’s freshwater resources, generates 25% of all wastes and emits 40–50% of GHG (Ding 2014); the design team is thus charged to adopt an environmentally responsible approach to their design solutions and construction materials’ specification choices.
The building sector is responsible for 20% of Australia’s total energy demand and 23% greenhouse gas (GHG) emissions (Lawania and Biswas 2016). It is projected that 460,000 new houses will be constructed in Western Australia (WA) by 2030, which will necessarily increase demand for construction materials and impact energy usage (NHSC 2011). Without due consideration of environmentally conscious specification choices, the construction industry in Western Australia will experience significant GHG emissions increases; there will be depletion of finite resources, and landfill over flow. This will result in a challenging situation requiring ongoing federal government and local authorities’ ‘green’ tendering guidelines and not least, requires respective design teams and builders to make informed decisions when specifying materials.
Life cycle assessment (LCA) is a decision-making tool that can assist stakeholders in identifying opportunities to make sustainability gains for built assets by selecting the most environmentally friendly option (Seidel 2016). It quantifies and accesses the inputs and outputs affecting environmental performance associated with a product, process or activity throughout its life cycle (Whyte 2012). Whilst the LCA technique is somewhat commonly available, uptake by industry remains still limited. Case-study examples such as those presented here can be argued to increase the profile of LCA application and, by extension, encourage a more sustainable design process (Crawford et al. 2016).
Roofing accounts for 6% of a low-rise building’s volume and, typically, 7% of a residential building’s GHG emissions (from mining to material production) (Lawania and Biswas 2018). Saiz conducted an LCA of a so-called green roof in Madrid, finding that its low solar absorbance resulted in a reduced level of energy demand for the building (Saiz et al. 2006). Chenani et al. (2015) similarly determined the environmental performance of two lightweight ‘green’ roof systems and found that an environmental impact reduction, through layers’ configurations review, was possible. Another recent LCA study found that the use of vaulted roofs can reduce embodied energy by over 40% relative to flat slabs (Huberman et al. 2015).
However, to the best of our knowledge, no study to date studied how life cycle environmental performance(s) of roofing varies with materials choices. For WA’s housing sector, roofs of three different types are common: sheet metal, concrete tile and clay tiles; these alternatives are compared in this current study to determine the environmental implications of different specification options for West Australian climatic conditions.
The next section outlines the methodology to assess the alternative roofing specifications in terms of carbon footprint and embodied energy demand comparisons. Carbon footprints of roofing options are compared, both with and without recycling factored-in since many areas in WA have no available local recycling facilities.
Methodology
The LCA conducted here follows the guidelines outlined in ISO14040-44 (ISO 2006) which consists of four steps: goal and scope; inventory analysis; impact assessment; and interpretation.
Goal and scope
The goal of this study is to assess the environmental impact involved with the use of roof-covering materials in WA residential houses. Three roof-covering materials are considered: clay tile; concrete tile; and, sheet metal.
The system boundary of the LCA study covers the entire life cycle of the product. This is broken down into several stages including raw material acquisition, manufacturing and processing of construction materials, transportation of these materials to the construction site, construction phase, usage stage and ultimately disposal/recycling residual considerations.
The functional unit of this study is 100 m2 of roof-covering materials and the timber structure framework supporting it; the environmental impacts of respective (typically) timber framework(s) will be analysed with the roof-covering material options. The reason for choosing this functional unit was that approximately 50% of average houses in Perth have this size of roof area (Department of Water and Environmental Regulations 2017). Other dwelling superstructure elements are not analysed. This is a process-based LCA, where energy and chemical inputs of all stages during the life cycle of roof-covering materials, have been utilised in assessing global warming impacts and embodied energy demand (Suh et al. 2014; Majeau-Bettez et al. 2011).
Quantities of the structural timber framework supporting the roof-covering materials are calculated in accordance with typical sections made available by local governments in Western Australia. Each item was classified according to its base material (treated pine, concrete, zinc, and aluminium). Natural gas and electrical energy are included where appropriate in consideration of the manufacture processing and installation of roof coverings (Life Cycle Strategy 2015; BPIC 2014).
Construction locations are urban; local suppliers were contacted to determine respective manufacturers/fabricators factory locations. Some industry representatives who provided materials and transportation related information will not be released in the paper due to requests for confidentiality. Where appropriate (raw) materials are deemed to have been shipped to (Fremantle) port and then road-transported to distributors/site. Timber/structural frameworks and roof-covering material installation is deemed by tradesman in situ; (steel/nail) fixings to install the roof-covering material have been included.
It is beyond the scope of this LCA to consider 100% data directly and indirectly associated with the production and use of these roofing materials. Therefore, the GHG emissions and embodied energy demand values that have been calculated using available data are relative values, and these results were used for comparison purposes (Suh et al. 2014; Majeau-Bettez et al. 2011).
Life cycle inventory
LCIs were conducted for clay tiles, concrete tiles and sheet metal on residential buildings to calculate energy and material consumption in all stages of roof life cycle.
Mining to material production
Composition and percentages of raw materials used in clay tiles, sheet metal and concrete tiles, respectively, were assessed (Table 1). For concrete and clay tiles roof, raw material quantities were calculated; the number of tiles per metre square multiplied by the mass per tile gives the total mass of tiles; the total mass then multiplied by relevant percentages finds raw materials required in 100 m2 (Whyte 2015). The timber frame to support the clay tiles, concrete tiles and sheet metal were sourced from typical sections and drawings from the City of Melville, Western Australia, alongside AS 1684.4 (Whyte 2015). A sample calculation is provided in “Appendix A”.
Table 2 shows the amount of natural gas and electricity that was required to produce 100 m2 of clay tile, concrete tile and sheet metal from raw materials (BPIC 2014; Atlas Steel 2014).
Transportation
Construction sites for roof erections is Western Australian urban/metropolitan; shipping freight transportation is assumed from the (interstate) manufacturer/fabricator to WA (Fremantle) port. In order to estimate the tonnes-km (i.e. t km) travelled by land, and sea Google Earth was used for calculating the distances in kilometres between origins and destinations. Local WA industry representatives (Boral and BlueScope Steel and others) noted that, typically clay tiles and sheet metal are manufactured in New South Wales, with concrete tiles made in Victoria. Shipping distance between NSW and WA (Fremantle) has been calculated as 2195 nautical miles (4065.14 km) and between Victoria Melbourne and Fremantle—1681 nautical miles (3113.2 km). Upon arrival at (Fremantle) port, articulated trucked road transportation of materials from the port to distributor/site is calculated as 22.6 km.
Construction
The construction stage involves the construction of the timber framework supporting the roof-covering materials, and the installing of the roof-covering materials, typically: marking-out (tape/pencil/chalk line) the timber; cutting the timber (drop saws/power saws/hand saws); and, nailing members together (hammers/nail guns, with two galvanised steel nails per tile/length or alternatively, nails by mass of mild steel sheet).
The energy consumed in in situ tradesman installation and tile/sheet connection is deemed nominal; effectively positioning and installing the tile/sheet and nailing the tile/sheet onto the battens is a manual process with nominal electrical equipment used.
Use
The usage stage quantifies the effects of varying solar reflectance of roofing materials (clay tile, concrete tile, sheet metal). This research shows that an effective R factor (thermal resistance of roofing material) affects heat loss and heat gain of each roofing material. Physical data and assumptions are inputs in Eq. 1 (below) to calculate heat lost and heat gain.
q rate of heat flow per square metre from roof to the inside, U the overall heat transfer coefficient between the ambient and inside (W/m2 K), 1/U the thermal resistance. T2 annual average ambient temperature °C, T1 required level of temperature that needs to be maintained inside the house °C, H outside transfer coefficient between roof and ambient (W/m2 K), rate of absorption to solar radiation, G solar radiation per unit area (W/m2).
Table 3 shows the cooling and heating loads of each roofing material in terms electricity consumption. Fossil and renewable energy account for 95.5% and 4.5% of the total primary energy sources for electricity generation (Grant 2015). “Appendix B” shows a sample calculation for how the cooling load has been calculated for clay tiles. Since the thermal modelling software was unavailable during the time of the study, the heating and cooling load at hourly levels was not determined (for more accurate analysis) and hence it is considered as a limitation of this analysis (Robati et al. 2016, 2017). Also it should be noted that the usage stage has only been considered to capture variation in cooling and heating energy demand due to use of different roof-covering materials over their life cycles. This variation was found very infinitesimal when comparing with impacts resulting from other life cycle stages. Therefore, the exclusion of the detailed thermal modelling analysis can be argued as not significantly affecting the overall outcomes of this LCA study.
The timeframe of use is deemed the life cycle of such construction materials. According to multiple sources (Boral 2014; Bluescope steel 2014), clay tile has an average of lifetime of 65 years, compared to concrete tile and sheet-metal life cycles of 50 years and 45 years, respectively. For the purposes of this comparative assessment, the greatest value is adopted, assuming a total lifetime of 65 years which implies the need for 1.3 and 1.45 times more concrete roof tiles and sheet tiles than clay tiles during this period, respectively.
End of life
A non-recycling approach is adopted if no local facilities exist, resultantly in such a scenario construction materials are disposed directly to landfill.
In the case of demolition of roofs and the transportation of demolition waste to landfill, two major activities were considered such as the use of tools and equipment used for demolition of roofs and then its transportation for disposal to landfill site (Lawania and Biswas 2018).
Alternatively, if recycling facilities do exist, values in Table 4 (below) are developed towards recycling databases for the three different roof types. Table 4 presents the construction & demolition (C&D) materials recovered and disposed in WA for the 2008–09 financial year (Hyder Consulting 2009).
For recycling waste clay tiles, this study has determined that the tile will be crushed for aggregates towards potential replacement with limestone in road construction work. Therefore, energy required to produce 3% of a clay tile has been reduced from the total raw material acquisition to calculate a net amount of energy.
In the case of concrete tiles, 45% of concrete tiles are typically recovered and recycled. Potentially, all fines/sand waste arisings from the concrete tile will be recovered and reused.
Metal is potentially 100% recyclable (Biswas 2014); however, for this study a practicable local recycling rate of 78% is used (as Table 4); thus, energy consumed to produce 78% of metal has been taken away from a raw material acquisition stage to calculate the net energy for sheeting.
Impact assessment
Input and output life cycle inventory data were entered into Simapro LCA software (Pré-Consultants 2015); application requires relevant materials to be linked to Australian libraries to ensure representative WA conditions. Where libraries did not exist, new libraries were developed from similar LCA studies. Table 5 shows that most of the emission databases were sourced from Australian unit process libraries (Stephan and Stephan 2014) except for silica and Iron–nickel–chromium alloy (where Ecoinvent was used) and natural gas (using Pré-Consultants 2015). Data concerning product residual uptake (cradle-to-cradle) were input to the software (i.e. chemicals, energy demand and heating and cooling loss) and linked to relevant libraries, towards the generation of associated impacts. The libraries are emission factor databases which include all upstream emissions and embodied energy demand of these inputs. The Intergovernmental Panel on Climate Change—IPCC2007—global warming potential (GWP)—method was used to calculate the associated environmental impact(s) of the product(s) (IPCC 2007). The cumulative energy demand method was also used to generate the embodied energy of the products.
Equation (2) shows the conversion of masses of different greenhouse gases associated with the production and use of material and energy inputs into global warming potential (GWP) (Fatimah and Biswas 2016), which is a single carbon dioxide-equivalent metric (CO2e-) (Stephan and Stephan 2014).
where I is the amount of an input. i:1,2,…N; type of inputs (e.g. cement, concrete, aluminium, electricity, natural gas). EFij emission factor = amount of emission of GHG type ‘j’ per kg of input of type ‘i’. CFj: CF1, CF2, CFM; … characterization factors of GHGs (e.g. CF is 1 for CO2, 28 for CH4, 265 for N2O).
Following cumulative energy demand method (Fatimah and Biswas 2016), all inputs in the life cycle inventory have been multiplied by the corresponding energy demand values to find out the total embodied energy demand of a roof cover
where EEi is the embodied energy demand of an input i.
Results and discussion
Carbon footprint of roof-cover materials
Respective carbon footprints of roof-cover materials have been estimated for both traditional (residual landfill) and also recycling approaches to determine carbon saving benefits.
Traditional approach
As can been seen in Fig. 1a–c, the total carbon footprints of one hundred square metre of sheet metals, concrete tiles and clay tiles are 9.85 t CO2e-, 9.33 t CO2e-and 4.39 t CO2e-, respectively. Sheet-metal roofing is the most carbon-intensive roofing material, because it is made of aluminium, which is 16 and 12 times more carbon intensive than concrete and clay blocks, respectively (NZAS 2011; Dunlop 2013; FISIS 2013).

Carbon footprint and embodied energy demand of a sheet-metal tiles b concrete tiles and c clay tiles
Raw material acquisition accounted for a significant portion (96%) of the total carbon footprint of one hundred metre square of sheet-metal roof, followed by manufacture and processing (2.6%), transportation (0.77%), construction (0.18%) usage (0.02%) and demolition and disposal stages (0.19%). Raw material acquisition for sheet metal is very high due to aluminium production typically in Victoria State smelters using electricity generated from brown coal. This stage of the life cycle is a significant source of carbon dioxide emissions and consequently the use of virgin sheet metal is the least environmentally friendly roof material specification for residential buildings in WA, in locations where no recycling facilities exist. Whilst less timber structural framework is required to support a lightweight sheet-metal roof, this does not contribute to the overall reduction of GHG emissions. The use of carbon-intensive sheet-metal roofs outweighs the benefit associated with use of light, structural roof-carcassing materials. Like other studies (Stephan and Stephan 2014), this study also found that the demolition and disposal stage accounts for the very tiny portion (≤ 1%) of the overall impact.
Followed by sheet metal, concrete tile use ranked second in terms of output of carbon foot print 9.33 t of CO2e-. Acquiring the required materials alongside manufacturing to final product is deemed energy intensive. Whilst raw material acquisition accounted for 51%, a significant portion of carbon footprint was produced during the manufacturing stage (43% of the overall carbon footprint). The is due to the use of large amounts of natural gas (1.5 times more than clay tiles and 4 times more than sheet metal) to fire the kilns used to burn the limestone, clay shale and other materials.
Comparing these three options, clay tiles produced the lowest carbon footprint of 4.44 t of CO2e-. A large proportion of which is linked to the manufacturing and processing stage(s) (76%) followed by raw material acquisition (10%), transportation (10%), construction (2%), the usage (0.03%) and demolition and disposal stage (1%). Figure 1c shows that the combustion of natural gas in the furnace for clay tiles production contributed a large portion of the overall carbon footprint. In addition, the LCA analysis has also highlighted that transportation contributed 10% of the overall carbon footprint, which is significantly higher than the emissions from the transportation of sheet metal and concrete roofs. This is due to the heavy mass of clay tiles and long travel distance from the manufacturing factory to the construction site (tonnes × km travelled).
Recycling approach
Where local residual processing facilities exist, a recycling approach for roof material assessment is considered below, towards full environmental burden analysis of these materials.
Sheet metal has the potential to be 100% recovered, reused and recycled. This study, however, considered a more practicable local WA recycling rate of ~ 78% (Hyder Consulting 2009); subsequently this significant amount of carbon footprint offset can be attained. This LCA confirms that there is much potential for reducing GHG emissions from sheet-metal roofing (73%) through a recycling approach that reduces emissions from mining and processing of such energy-intensive metals. It is noted that the raw material acquisition stage of highly recyclable sheet-metal materials such as aluminium and zinc is an environmental ‘hot spot’ for this roof type, and so recycling significantly reduces the carbon footprint of a sheet-metal roof covering.
Concrete and clay tiles after their respective end of life are unlikely to be reused again as roof materials specifically, and therefore, recycling/crushing for alternative infrastructure applications can be considered. In the case of concrete tiles, 45% of the waste generated can be recycled/recovered as fine aggregates (e.g. sand) through concrete tile crushing, separation and grading for reuse as either sub-base file or as aggregate fines in recycled concrete. Consideration of this recycling strategy offsets emissions from the acquisition of the raw material stage. Once this recycling strategy has been considered, the overall GHG emissions from the use of 100 m2 of concrete tiles can be reduced to 8.44 t of CO2e- (i.e. by 10%).
To recycle clay tiles, the waste arising is crushed and graded into aggregates towards (localised) percentage replacement for virgin limestone in road construction. The amount of energy that could be avoided due to crushing clay tiles instead of limestone is only 3%. The material acquisition stage accounts for only 10% of the total GHG emission and so reducing (only) 3% of the total energy demand of raw material acquisition due to this recycling approach does not appear to decrease the overall GHG emission of clay tile roof.
For these three roof-covering materials, GHG emissions associated with the demolition and disposal decreased due to decreases in the amount of demolition wastes going to landfill. The emissions from the transportation of construction materials have been decreased for the sheet-metal roofs only, as recycled sheet metal is used for building roof application, which in turn would avoid the shipping of virgin materials from the eastern state. This is not the case for concrete and clay tiles, as recycled versions of these materials are used for different applications.
Embodied energy demand
When residual processing facilities are not available and a recycling approach is not considered, it is not the sheet-metal roof, but rather the concrete roof that is found to have the highest embodied energy demand (83 GJ), followed by sheet metal (58.6 GJ) and clay tiles (52.7 GJ). The embodied energy impact of a sheet-metal roof is not as great as its carbon footprint because GHG emissions are due to electricity generated from brown coal for aluminium production; on the other hand, as mentioned above the manufacturing energy for concrete is significantly higher than that for sheet metal and clay tiles. Concrete manufacturing involves the use of energy for crushing aggregates and mixing concrete constituents in batching plants. Since higher percentages of sheet metal can be recycled (than concrete tiles) with very high energy intensities (i.e. 240 MJ/kg for sheet metal, as opposed to cement for concrete of 7.5 MJ/kg, and clay of 0.05 MJ/kg), the use of recycling approaches are argued to be able to significantly reduce the embodied energy demand of sheet metal (i.e. 71%). Crushing and recycling of concrete and clay waste arisings reduces insignificant amounts of the embodied energy (concrete by 7% and clay tiles by 0.04%) due to the fact that most of the energy was consumed in the manufacturing stage of these materials.
Conclusions
This paper discusses how life cycle assessment (LCA) tool application can help inform the design process and specification choices of building materials in Western Australia, with particular regard to assessing key environmental impacts such as carbon footprint and embodied energy demand. This research compares three different roof alternatives which can be used as a guide for future study for a quick comparison, to guide choice of alternative specifications for (low carbon impact) roofing materials.
Where waste-processing facilities are not available and recycling strategies are not considered, this LCA analysis confirms that sheet metal is the most carbon-intensive roof-cover material, whilst concrete roof tiling has the highest embodied energy demand. Where residual processing facilities do exist on the other hand, recycling strategies are found to be most effective for sheet-metal roof covering, as 73% of GHG emissions and 71% of embodied energy demand can be reduced by recycling. However, a similar recycling of waste arisings approach makes less significant environmental savings (i.e. ≤ 10%) for concrete tile or clay tiles; albeit respective energy conservation during manufacture (of concrete and clay tiles) can reduce overall environmental impacts where waste recycling facilities exist.
The work here raises an awareness of the use of a simplified (off-the-peg software application) LCA approach, towards ongoing encouragement of designers and building materials specification stakeholders to incorporate environmental assessment into their decision-making process.
References
Atlas Steel (2014) Products. Altona, Melbourne, p 3018
Biswas W (2014) Carbon footprint and embodied energy consumption assessment of building construction works in Western Australia. Int J Sustain Built Environ 3(2):179–186
Bluescope steel (2014) Roofing. Wollongong DC NSW 2500 http://www.bluescopesteel.com.au/building-products/roofing. Accessed 30 June 2014
Boral (2014) Construction material and clay bricks across Western Australia: locations and availability. http://www.boral.com.au/home.asp. Accessed 27 Sep 2014
British Research Establishment (2014) Ecotoxicity . http://www.bre.co.uk/greenguide/page.jsp?id=2099. Accessed 15 May 2014
Building Products Innovation Council (2014) Building products life-cycle inventory. http://www.bpic.asn.au/lci/guidance-materials/guidancematerialforthebplci. Accessed 15 May 2014
Chenani SB, Lehvavirta S, Hakkinen T (2015) Life-cycle assessment of layers of green roofs. J Clean Prod 90:153–162
Crawford RH, Bartak EL, Stephan A, Jensen CA (2016) Evaluating the life cycle energy benefits of energy efficiency regulations for buildings. Renew Sustain Energy Rev 63:435–451
Department of Water and Environmental Regulations (2017) Rainwater, Government of Western Australia
Ding GK (2014) Life cycle assessment (LCA) of sustainable building materials: an overview. In: Pacheco-Torgal F, Cabeza LF, Labrincha J, de Magalhaes A (eds) Eco-efficient construction and building materials life cycle assessment (LCA), eco-labelling and case studies. Woodhead Publishing, Cambridge, pp 38–62
Dunlop RA (2013) Sustainable energy. Cengage Learning, Boston
Fatimah Y, Biswas WK (2016) Remanufacturing as a means for achieving low-carbon SMEs in Indonesia. Clean Technol Environ Policy 18:2363–2379
Fraunhofer Institute for Systems and Innovation Research (FISIS) (2013) Methodology for the free allocation of emission allowances in the EU ETS post 2012: sector report for the ceramics industry European Commission, Study Contract: 07.0307/2008/515770/ETU/C2, Ecofys Project Number: PECSNL082164
Grant T (2015) WA power mix. Australia. Life cycle strategy, Melbourne. www.lifecycles.com.au/#!australian_data__tools/c1s7h
Huberman N, Pearlmutter D, Gal E, Meir IA (2015) Optimizing structural roof form for life-cycle energy efficiency. Energy Build 104:336–349
Hyder Consulting (2009) Recycling activity in Western Australia. prepared for Waste Authority, Western Australia
IPCC (2007) AR4 SYR, Core Writing Team; Pachauri RK, Reisinger A (eds), Climate change 2007: synthesis report, contribution of working groups I, II and III to the fourth assessment report of the intergovernmental panel on climate change, IPCC. (ISBN 92-9169-122-4)
ISO (2006) ISO 14044:2006 - Environmental management—life-cycle assessment—requirements and guidelines. International Organization for Standardization, Geneva
Lawania KK (2016) Improving the sustainability performance of Western Australian house construction: a life-cycle management approach, unpublished Ph.D. thesis, Curtin University, Perth. https://espace.curtin.edu.au/handle/20.500.11937/1705. Accessed 6 Apr 2017
Lawania K, Biswas WK (2016) Cost effective GHG mitigation strategies for Western Australia’s housing sector: a life-cycle management approach. Clean Technol Environ Policy 18:2419–2428
Lawania KK, Biswas WK (2018) Application of life-cycle assessment approach to deliver low carbon houses at regional level in Western Australia. Int J life-cycle Assess 23:204–224
Life Cycle Strategies Pty Ltd (2015) Australasian unit process LCI library and methods. Version 2015_02_06, Melbourne, Australia
Majeau-Bettez G, Strømman AH, Hertwich EG (2011) Evaluation of process- and input–output-based life cycle inventory data with regard to truncation and aggregation issues. Environ Sci Technol 45(23):10170–10177
National Housing Supply Council (NHSC) (2011) The key findings of 2011, the state of supply report, the Australian government. National Housing Supply Council, Australia
New Zealand Aluminium Smelters Limited (NZAS) (2011) Sustainable development review, Tiwai Point 9877, New Zealand
PRé-Consultants (2015) Simapro 7.3 LCA Software. Stationsplein 121, 3818 LE, Amersfoort, The Netherlands
Robati M, McCarthy TJ, Kokogiannakis G (2016) Incorporating environmental evaluation and thermal properties of concrete mix designs. Constr Build Mater 128(15):422–435
Robati M, Kokogiannakis G, McCarthy TJ (2017) Impact of structural design solutions on the energy and thermal performance of an Australian office building. Build Environ 124(1):258–282
Saiz S, Kennedy C, Bass B, Pressnail K (2006) Comparative life-cycle assessment of standard and green roofs. Environ Sci Technol 40:4312–4316
Seidel C (2016) The application of life cycle assessment to public policy development. Int J Life Cycle Assess 21(3):337–348
Stephan A, Stephan L (2014) Reducing the total life cycle energy demand of recent residential buildings in Lebanon. Energy 74:618–637
Suh S, Tomar S, Leighton M, Kneifel JD (2014) Environmental performance of green building code and certification systems. Environ Sci Technol 48(5):2551–2560
Whyte A (2012) Life-cycle assessment of built-asset waste materials: sustainable disposal options. LAP LAMBERT Academic Publishing, Saarbrucken. ISBN: 978-3-8465-5960-4
Whyte A (2015) Integrated design and cost management for civil engineers. CRC Press/Taylor & Francis Group, London ISBN: 13:978-0-415-80921-4
Author information
Authors and Affiliations
Corresponding author
Appendices
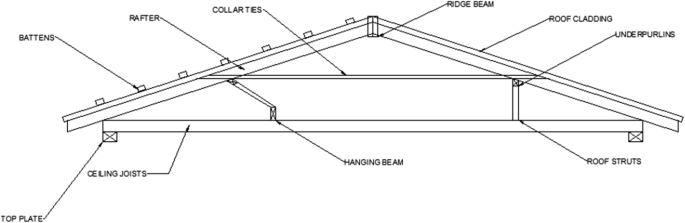
Appendix A: a sample calculation of timber structure
-
Details and specification were provided by drawings and the Design Engineer from City of Melville.
-
General specification of a residential house:
-
Joist spacing: 600 mm.
-
Rafter spacing: 600 mm.
-
70/75 mm frame.
-
Pitch angle: 20 degrees.
-
Single storey.
-
Specification of material:
-
Top plates (AS 1684.4 Table A22).
-
Roof type: sheet-metal roof.
-
Rafter Span = 9,000 mm.
-
Timber size: MGP10 2/45 × 70.
-
Roof type: clay and concrete tile.
-
Rafter Span = 9000 mm.
-
Timber size: MGP10 3/45 × 70.
-
Ceiling Joists (AS 1684.4 Table A27).
-
Joist span: 3600 mm.
-
Timber size: MGP10 120 × 45.
-
Hanging beam (AS 1684.4 Table A28).
-
Ceiling joist span: 3600 mm.
-
Hanging beam span: 3600 mm.
-
Timber size: MGP10 240 × 35.
-
Strutting beams (AS 1684.4 Table A32).
-
Sheet roof strutting beam span: 4800 mm.
-
Timber size: sheet metal: MGP10 2/190 × 35.
-
Timber size: clay and concrete tile: MGP10 2/240 × 45 Underpurlins (AS 1684.4 TA33).
-
Strut spacing: 2400 mm.
-
Timber size: sheet metal: MGP10 2/90 × 45.
-
Timber size: clay and concrete tile: MGP10 2/140 × 35 Rafters (HySPAN).
-
Timber size: sheet metal: MGP10 120 × 35.
-
Timber size: clay and concrete tile: MGP10 120 × 35 Ridge Beam (AS 1684.4 Table A36).
-
Beam spacing: 2400 mm.
-
Beam span: 3600 mm.
-
Timber size: sheet metal: MGP10 2/190 × 45.
-
Timber size: clay and concrete Tile: MGP10 2/240 × 45 Batten (AS 1684.4 Table A37).
-
Rafter spacing: 600 mm.
-
Batten spacing: 900 mm.
-
Timber size: sheet metal: MGP 45 × 70.
-
Rafter spacing: 600 mm.
-
Batten spacing: 330 mm.
-
Timber size: clay and concrete Tile -MGP10 35 × 42 Hip or Valley Rafters (HySPAN).
-
Timber size: sheet metal: MGP10 190 × 45.
-
Timber size: clay and concrete tile: MGP10 240 × 45 Roof Struts.
-
Timber size: MGP10 90 × 45.
-
The timber frame required was calculated by measuring the drawings to calculate the length and then calculating the volume using the dimension of the timber frame in the above section.
-
Timber frame required (tile: concrete & clay):
-
Total length of top plate (MGP10 2/45 × 70) = 43.2 m.
-
Total volume of top plate = 43.2 × 0.045 × 0.07 = 0.136 m3.
-
Total length of ceiling joists (MGP10 120 × 45) = 204 m.
-
Total volume of ceiling joists = 204 × 0.12 × 0.045 = 1.1 m3.
-
Total length of hanging beam (MGP10 240 × 35) = 44.6 m.
-
Total volume of hanging beam = 44.6 × 0.24 × 0.035 = 0.375 m3.
-
Total length of strutting beam (240 × 45) = 13.45 m.
-
Total volume of strutting beam = 13.45 × 0.24 × 0.045 = 0.145 m3.
-
Total length of underpurlin (MGP10 140 × 35) = 60.7 m.
-
Total volume of underpurlin = 60.7 × 0.14 × 0.035 = 0.3 m3.
-
Total length of rafter (MGP10 120 × 35) = 197 m.
-
Total volume of rafter = 197 × 0.12 × 0.035 = 0.83 m3.
-
Total length of ridge beam (MGP10 240 × 45) = 3.22 m.
-
Total volume of ridge beam = 3.22 × 0.24 × 0.045 = 0.035 m3.
-
Total length of batten (MGP10 35 × 42) = 317 m.
-
Total volume of batten = 317 × 0.035 × 0.042 = 0.47 m3.
-
Total length of valley rafter (MGP10 240×45) = 26 m.
-
Total volume of valley rafter = 26 × 0.24 × 0.045 = 0.28 m3.
-
Total length of roof struts (MGP10 90 × 45) = 36 m.
-
Total volume of roof struts = 36 × 0.09 × 0.045 = 0.15 m3.
-
Total timber volume = 3.821 m3.
-
Timber frame required (sheet metal):
-
Total length of top plate (MGP10 3/45×70) = 43.2 m.
-
Roof cladding required:
-
Clay tiles:
-
No. of tiles per m2: 11.9
-
No of tiles required: 11.9 × 150 = 1785 tiles.
-
Mass per tile: 3.1 kg.
-
Total mass of tiles = 3.1 × 1785.
-
Total mass of tiles = 5533.5 kg.
-
Total mass of quartz (60%) = 5533.5 × 0.6
-
Total mass of quartz (60%) = 3320.1 kg.
-
Total mass of clay minerals (40%) = 5533.5 × 0.4 Total mass of clay minerals (40%) = 2213.4 kg Concrete Tiles:
-
No. of tiles per m2: 9.4
-
No of tiles required: 9.4 × 150 = 1410 tiles.
-
Mass per tile: 5.55 kg.
-
Total mass of tiles = 5.55 × 1410.
-
Total mass of tiles = 7825.5 kg.
-
Total mass of quartz (70%) = 7825.5 × 0.7
-
Total mass of quartz (70%) = 5477.85 kg.
-
Total mass of Portland cement (30%) = 7825.5 × 0.3 Total mass of Portland cement (30%) = 2347.65 kg Steel Roofing:
-
Required steel roofing: 150 m2.
-
Mass: 4.3 kg/m2.
-
Total mass of metal roofing: 150 × 4.3
-
Total mass of metal roofing: 645 kg.
-
Total mass of Aluminium (55%): 354.75 kg.
-
Total mass of Zinc (43.5%): 280.575 kg.
-
Total mass of Silicon (1.5%): 9.675 kg.

Appendix B: calculation of the effects of varying solar reflectance of roofing materials
-
Physical Data: Physical data assumptions are detailed below for input into Eq. 1.
-
Temperature readings are taken from the (WA) Bureau of Meteorology (BOM). The temperature (T1) is the average temperature recorded at 3 pm from 1994 to 2011 at Perth Metro WA each month. Industry representatives (thanks to TT air-conditioning), the conformable temperature will vary individual to individual. However, industry representatives note that many buildings are set at a room temperature of 24 degrees C.
-
Average radiation figures for areas in Perth metro WA have been derived from BOM. A figure of 625 W/m2 for a 6 h day is typical. BOM has also provided data that the heat flow transfer coefficient is 25 W/m2.K.
-
The Building code of Australia, 2005 notes that roofing requires a total R value (= 1/U) of 2.2 m2. K/W.
-
According to Selby (2006) the absorption rate for clay tile, concrete tile and sheet metaling is 0.63, 0.67, and 0.38.
-
Q = rate of heat flow per square metre from roof to the inside.
-
U = the overall heat transfer coefficient between the ambient and inside (W/m2/K) Note that 1/U = R (the thermal resistance).
-
H = Outside transfer coefficient between roof and ambient (W/m2/K).
-
∂ = rate of absorption to solar radiation.
-
G = Solar radiation per unit area.
-
Calculation for January (Clay Tile):
-
Average temperature at 3 pm: 29 degrees.
-
Comfortable temperature: 24 degrees.
-
Change in temperature = 29 − 24 = 5 degrees (Cooling).
-
α = 0.63 (Clay tile).
-
h = 25 W/m2.K
-
G = 625 watts/m2.
-
R = 1/U = 2.2 m2 K/W (Building code of Australia, 2005).
-
Roof area = 100 m2.
-
Heat Loss = (1/2)*((0.63*635/25) + 5).
-
Heat Loss = 9.43 W.
-
Heat Loss = 0.94 kW.
-
Heat Loss over 6 h = − 0.94 × 6 = 5.66 GJr.
-
Heat Loss in a month = − 5.66 * 31 days = 175.43 GJr.
-
Heat Loss in 65 years = − 175.43 × 65 years = 11,403.07 GJr.
-
Total Cooling in 65 years during the month that requires cooling = 59,961.61 GJr.
-
Calculation for applied energy.
-
1 x Mitsubishi 4.2 kW Air Conditioner.
-
Energy Efficiency (Cooling): 2 stars (Sourced from TT air-conditioning).
-
COP: 3.25 (Energy Aus).
-
Energy efficiency (heating): 2.5 Stars (sourced from TT air-conditioning).
-
COP: 3.5 (Energy Aus).
-
Cool Capacity: 4.2 kW.
-
Heating Capacity: 5.4 kW.
-
Total Output Energy for Clay (Cooling): 59,961.61 GJr.
-
COP = output/input.
-
3.25 = 59,961.61 GJr/Input.
-
Input = 18,449.73 GJr.
Rights and permissions
About this article

Cite this article
Le, A.B.D., Whyte, A. & Biswas, W.K. Carbon footprint and embodied energy assessment of roof-covering materials. Clean Techn Environ Policy 21, 1913–1923 (2019). https://doi.org/10.1007/s10098-018-1629-9
Received:
Accepted:
Published:
Issue Date:
DOI: https://doi.org/10.1007/s10098-018-1629-9