
Abstract
Underground structures are well known to be earthquake resistant. However, the recent earthquakes showed that underground structures are also vulnerable to seismic damage. There may be several reasons such as high ground motions and permanent ground movements. This study attempts to describe various forms of damage to underground structures such as tunnels, caverns, natural caves and abandoned mines during major earthquakes. Results of various model tests on shaking table are also presented to show the effect of ground shaking on the response and collapse of underground structures in continuum and discontinuum. Furthermore, some empirical equations are proposed to assess the damage to underground structures, which may be useful for quick assessments of possible damage.
1 Introduction
It is well known that underground structures such as tunnels and powerhouses are generally resistant to earthquakes (Dowding and Rozen 1978; Sharma and Judd 1991). However, they may be damaged when permanent ground movements occur in/along the underground structures. There are several examples of damage to tunnels due to permanent ground movements during earthquakes such as the 1906 San Francisco, 1930 Tanna, 1978 Izu-Oshima-Kinkai, 1995 Kobe, 1999 Düzce-Bolu, 1999 Chi-chi, 2004 Chuetsu, 2005 Kashmir and 2008 Wenchuan earthquakes. Most of the tunnels worldwide have non-reinforced concrete linings. As the concrete lining fails in a brittle manner, permanent ground movements may induce the rupture of the linings and falling debris, which may cause secondary disasters with tremendous consequences to vehicles passing through. Therefore, this current issue must be urgently addressed. It should be noted that the same issue is also valid for the long-term stability of high-level nuclear waste disposal sites.
The seismic response and stability of settlement areas situated above the abandoned lignite mines in Japan due to urbanization in recent years are of great concern. The 26 July 2003 Miyagi-Hokubu earthquake (Mw 6.1) caused damage to the areas of abandoned lignite mines near Yamamoto town, which was located just above the hypocenter of the earthquake. It is also known that many collapses occurred in the abandoned mines exploited by the room and pillar technique during the previous earthquakes in Japan.
This study deals with the response and stability problems of underground openings in rock mass during earthquakes. A brief description of ground motions in underground openings and ground surface and an example of permanent ground deformation observed during the 1999 Kocaeli earthquake are first given. Some results of model tests on underground openings tested on a shaking table are presented. Numerical studies on the deep tunnels and shallow underground structures are also described. Then, a summary of damage to underground structures in various countries during major earthquakes are explained and their causes discussed. In the final part, damage to underground structures by earthquakes is classified and some empirical equations are proposed for assessing the seismic stability of underground structures.
2 Ground Motions
It is well known that the ground motions are generally smaller than those at the ground surface. Nasu (1931) carried out the first instrumental studies on tunnels during the aftershock activity following 1924 Izu earthquake with a 2.4 m offset. Kanai and Tanaka (1951) measured the ground acceleration in underground caverns and at the ground surface. These measurements indicated that the surface acceleration was generally twice or greater than twice of that at depths as expected theoretically.
Komada and Hayashi (1980) reported the results of an extensive monitoring program on ground motions during earthquakes on underground caverns and adjacent tunnels. They also investigated the frequency content and amplification in relation to magnitude and distance of earthquakes. However, these caverns were not in the epicentral area.
Figure 1 shows the acceleration records measured on the ground surface (GSA) and underground (GSG) during the 2009 Mw 6.3 L’Aquila earthquake. The GSA station is at Assergi and the GSG station is located in an underground gallery of Gran Sasso Underground Physics Laboratory of Italy. Both stations are founded on Eocene limestone with a shear wave velocity of 1 km/s. Although the epicentral distances and ground conditions are almost the same, the acceleration at ground surface is amplified almost 6.4 times that in the underground gallery.

Acceleration records at GSA and GSG strong motion stations (from Aydan et al. 2009c, strong motion records from Italian Strong Motion Network, RAN)
The recent global positioning system (GPS) also showed that permanent deformations of the ground surface occur after each earthquake (Fig. 2). Permanent ground deformation may result from different causes such as faulting, slope failure, liquefaction and plastic deformation induced by ground shaking. This type of ground deformations will have limited effect on small structures as long as the surface breaks do not pass beneath those structures. However, such deformations may cause tremendous forces on long and/or large structures. The ground deformation may induce large tensile or compression forces as well as bending stresses in structures depending on the character of permanent ground deformations. As an example, the ground deformations reported by Reilinger et al. (2000), which were caused by a strike–slip fault during the 1999 Kocaeli earthquake in Turkey, are shown in Fig. 2. Blind faults and folding processes may also induce some peculiar ground deformations and associated folding of soft overlaying sedimentary layers. Such deformations caused tremendous damage to tunnels during the 2004 Chuetsu earthquake, although no distinct rupturing took place.

Permanent ground deformations induced by the 1999 Kocaeli earthquake (from Reilinger et al. 2000)
3 Dynamic Model Experiments on Underground Openings
Model experiments on underground openings are one of the tools used in rock engineering since early times. If the design values are to be obtained directly from the model experiments, the similitude law between the model and actual structure is the most critical issue. As it is difficult to model an actual structure in a reduced scale of the geometry, stress conditions and constitutive parameters of materials, the model experiments should be used to validate the mathematical models for structural response under controlled conditions and material properties of the model experiments, as well as to study the mechanism of failure, which may be an extremely difficult task even in numerical analyses. The author and his co-workers prefer this second approach. Therefore, the model experiments presented in this section are intended to illustrate what we should expect under natural conditions and to understand the underlying mechanism of the response and stability of underground openings subjected to earthquakes.
3.1 Underground Openings in Continuous Medium
A series of model tests on underground openings with a diameter of 50 mm in a fine granular material made of crushed Ryukyu limestone with an apparent cohesion was carried out by varying the ratio of overburden to tunnel diameter (0.5–2.0) and the inclination of ground surface (0° and 30°). The unit weight, cohesion and friction angle of the compacted material are about 15 kN/m3, 7.2 kPa and 26.9°, respectively. The model box is made of an aluminum frame with a size of 300 × 300 × 50 mm, and the front and back of the model box made of 5-mm thick transparent acrylic plates. After compaction, the tunnel was excavated by pulling out the aluminum solid cylinder with a diameter of 50 mm similar to TBM excavations. Model tunnels were unsupported and some collapses occurred in the roof following the excavation. Then, tunnels were subjected to horizontal shaking perpendicular to the longitudinal axis of the tunnels. Applied accelerations and movement of the ground surface were measured using laser displacement transducers. Figure 3 shows some views of the experiments on model tunnels.

Views of a model tunnel before and after excavation and shaking (H/D = 1.0)
Figure 4 shows the applied acceleration wave and response of the model tunnel with sloping ground surface during shaking. Although the material was extremely weak, the maximum ground acceleration was greater than 0.6 g. This simple example clearly implies that underground openings are quite resistant to ground shaking.

Displacement response of model tunnel next to sloping ground during shaking
Natural caves may sometimes be of great concern and their actual configuration would be different from those used in rock engineering structures. Figure 5 shows a shaking model experiment in relation to the effects of karstic caves beneath the Gushikawa castle remains in Okinawa Island.

Views of model test on the karstic cave beneath the Gushikawa Castle remains
3.2 Underground Openings in Discontinuous Medium
Aydan and his co-workers (Aydan et al. 1994; Aydan and Kawamoto 2004; Genis and Aydan 2002, 2008; Aydan and Genis 2008a) have reported some of their experimental results on the response and stability of underground structures in a discontinuous medium. Some of these experiments involved model tests in non-breakable blocky media. The instability merely takes place in relation to the orientation of discontinuities (Fig. 6). In recent years, these experiments have been repeated using breakable blocks made of a mixture of BaSO4, ZnO and vaseline oil, which were used in base-friction model tests. The strength of this material depends on the compaction pressure, so that it is possible to achieve the failure of models with the desired strength values (Fig. 6).

Views of some model tests in discontinuous rock mass models
Some laboratory model tests on abandoned lignite mines were also carried out. In experiments, the overburden ratio (H/h) and excavation ratio (At/Ap), which are defined as the overburden height (H) to the seam height (h), and the total area (At) supported to the pillar area (Ap), were systematically varied. The model was fixed on a uniaxial shaking table apparatus and was shook. When the overburden ratio (H/h) was high, the failure was due to the compression failure of pillars for the excavation ratio (At/Ap) of 2 (Fig. 7a), while the failure was due to the failure of the roof layers for the excavation ratio (At/Ap) of 3 as seen in Fig. 7b.

Some views of models of abandoned lignite mines during shaking table tests. a Compressive failure of pillars. b Bending failure of roof layers
In some of the model tests, the effect of faulting was also investigated. Figure 8a, b shows views of a mine model test in jointed rock mass induced by vertical normal faulting. Figure 8c shows three closely spaced model tunnels subjected to thrust faulting with an inclination of 45°. The equipment used in faulting experiments was 780 mm long, 300 mm deep and 250 mm wide. The 400-mm long part of the base can be moved in the desired direction under gravity.

Views of damage to various underground opening models by faulting. a Underground opening just above the fault break. b Underground opening just next to the fault break. c Damage to tunnels due to faulting
4 Limit Equilibrium Method (LEM) Studies
4.1 Shallow Underground Openings in Discontinuous Media
It is well known that shallow underground openings are more vulnerable to stability problems as compared to deep underground openings. The shallow underground openings may completely fail during earthquakes as seen in Figs. 3, 4, 5, 6, 7 and 8. There are also many reports of such case histories in literature (i.e., Wang et al. 2001; Aydan and Kawamoto, 2004; Aydan et al. 2009b, 2009c; Karaca et al. 1995). The authors studied the stability of shallow underground openings under both static and dynamic conditions (Aydan et al. 1994; Genis and Aydan 2002). The model tests (see also Fig. 6) revealed that there were two or three regions potentially unstable (denoted regions I, II and III) in the close vicinity of shallow underground openings as illustrated in Fig. 9. Aydan et al. (1994) derived the following condition for the horizontal seismic coefficient (α H ) to initiate the sliding of a region along a discontinuity set emanating from the opening for a shallow underground opening as illustrated in Fig. 9:

Illustration of mechanical model for stability analysis of shallow underground openings (Aydan et al. 1994)
where θ* = θ A + θ B + ϕ A + ϕ B . W I , W II , θ A , θ B , ϕ A , ϕ B and β are weights of regions I and II, inclinations and friction angles of discontinuity sets A and B and angle of seismic force with respect to horizontal, respectively. The same method can be used to study the stability of region II. Aydan et al. (1994) checked experimentally the validity of the limit equilibrium conditions for layered media and those with two joint sets.
4.2 Shallow Room and Pillar Mines and Shallow Karstic Caves
Many collapses were observed in the abandoned mine area of Yamoto town due to the 2003 Miyagi-Hokubu earthquake (Aydan and Kawamoto 2004). However, there is no available approach to consider the effect of earthquakes on the stability of abandoned room and pillar mines. Although appropriate consideration would require the solution of the equation of motion, Aydan et al. (2006) proposed a simple approach based on the seismic coefficient approach for the seismic design of structures in earthquake engineering (Fig. 10). When the pillar is in full contact with overburden layers, the stress on a pillar may be given as follows

Mechanical model for roof stability under earthquake load for roof a is modified from Whittaker and Reddish (1989). a Pillar. b Roof
where ρ, g, H, A t , A p , w, α H and y are density, gravity, overburden height, area supported by the pillar, pillar area, pillar width, horizontal seismic coefficient and distance from the center of the pillar, respectively. The maximum compressive and tensile stress would occur at both the sides of the pillar. If the tensile strength between the roof layer and pillar is assumed to be nil and the yielding takes to a certain depth from the side of pillar, the maximum compressive stress on the pillar side can be obtained as follows:
where \( \xi = \frac{e}{w}, \) e = w − w*, A p * = w* × w*, \( \sigma_{po} = \rho gH{\frac{{A_{t} }}{{A_{p} }}} \) and w* is effective pillar width. The relation between the normalized yield distance and seismic coefficient α for no-tension condition between roof layer and pillar is obtained after some manipulations as follows:
The horizontal seismic coefficient at the collapse of the pillar may be obtained for the condition that the maximum compressive stress obtained from Eqs. 3 and 4 is the same. In Fig. 11, H and h stand for overburden height and pillar height, respectively. Model tests on room and pillar mines on shaking table indicated that the roof layers also fail by bending. Therefore, the load condition under horizontal shaking is assumed to consist of gravitational load inducing the bending stresses and the linearly varying axial stress along the roof axis from tension to compression due to horizontal shaking. On the basis of this assumption, the horizontal seismic coefficient at the time of roof layer failure by bending is obtained as follows:

Seismic stability charts for abandoned mines
where t and σ t are the thickness and tensile strength of the roof layer, respectively. Figure 11 shows a computed diagram of the relations between overburden ratio and seismic coefficient of various failure modes for the chosen parameters shown in the same figure in relation to experiments shown in Fig. 7. As noted from the figure, there are four different regions in the diagram, namely, region 1: roof layer and pillar are stable; region 2: roof layer is stable, while pillar is unstable; region 3: roof layer is unstable and pillar is stable; region 4: roof layer and pillar are both unstable. These results indicate that the shallow mines are prone to roof failure while the deeper mines are prone to pillar failure for actual strong ground motions during earthquakes.
The stability of the roof of the shallow karstic caves subjected to earthquake loads may be also analyzed using a similar mechanical model presented above. The seismic stability of shallow sinkholes is evaluated as a built-in beam subjected to horizontal and vertical seismic loads. On the basis of experimental observations, the horizontal seismic load will cause tension on one side and compression on the other side (Fig. 10b).
where
- γ:
-
unit weight of roof material;
- T :
-
roof thickness;
- t*:
-
surcharge load height;
- L :
-
opening width;
- β :
-
ratio of vertical seismic coefficient (α V ) to horizontal seismic coefficient (α H ).
We applied this approach to the sinkholes caused by the 2009 L’Aquila earthquake (Aydan et al. 2009c). The computational results are shown together with the observational values for the maximum horizontal component of ground accelerations taken at AQK strong motion station in Fig. 12. The ratio of vertical seismic coefficient to horizontal seismic coefficient was taken as 0.65 in view of measurement results. The roof thickness was assumed to be 300 cm, while the surcharge load height was varied between 0 and 300 cm. The unit weight and tensile strength of roof material were assumed to be 20 kN/m3 and 560 kPa, respectively. The site observations indicated that a 300-cm deep trench (this value is estimated) was excavated on one side of the sinkhole sites. Therefore, the trench excavations for sewage pipes drastically reduced the effective roof thickness. As expected, the increase in the surcharge load drastically reduces the seismic resistance of the roof of karstic caves.

Comparison of computational results with observational results
5 Numerical Studies
A series of parametric numerical analyses of the shape of underground openings under different high in situ stress regime, and direction and amplitude of earthquake-induced acceleration waves were carried out. The details of these numerical analyses can be found in the studies of Genis (2002) and Genis and Gerçek (2003). Figure 13 compares yield zone formations around circular and horse shoe-like tunnels subjected to in situ hydrostatic stress condition (P o = 20 MPa) under static and dynamic conditions. The reason for such an approach is to eliminate the effects of the in situ stress field on the geometry of the failure zone. To compare the yield zones determined in either static or dynamic analyses, a simple quantitative measure, i.e., “index of yield zone” or shortly IYZ, was used (Gerçek and Genis 1999). IYZ is the ratio of total area of yielded elements to the cross-sectional area of the opening. In the analyses, the rock mass behavior is assumed to be elastic brittle-plastic. The properties of the elastic zone and yielded zone were assumed to obey the Hoek–Brown failure criterion with γ = 25 kN/m3, E m = 27.4 GPa, v = 0.25, σ cm = 14.1 MPa and m = 3.43 for elastic zone, and σcr = 2.84 MPa and m r = 2.23 for the yielded zone. Three different acceleration records were used in these particular analyses. If the maximum amplitudes and dominant frequency characteristics of the earthquake records were almost the same, the yield zones formed under dynamic conditions were the same. They are almost circular for the circular tunnels, while almost elliptical for horse shoe-like tunnels, although the acceleration record was unidirectionally applied.

Yield zone formations around a deep opening (W/H = 1) under different waveforms (partly from Genis and Gerçek 2003)
Genis and Gerçek (2003) reported on a series of analysis of the effect of the direction of wave propagation on the geometry of the failure zone of an underground opening with aspect ratios (W/H) of 1 and 2 subjected to a hydrostatic in situ stress state of 20 MPa. Applied acceleration waves were sinusoidal with a frequency of 1.5 Hz and its amplitude was varied out. The propagation direction of acceleration waves was vertical, at 45° and horizontal. They reported that the size of the yield zone increased as the amplitude of acceleration waves increased, and the direction of wave propagation with respect to the opening did not significantly affect the size of the failure zone occurring around the arched roof openings with W/H = 1 or 2 under a hydrostatic in situ stress field and assumed constitutive model. Also, the effect of the W/H ratio of underground opening on the geometry of the failure zone was investigated. For this purpose, the three opening shapes (i.e., W/H = 1, 2 and 3) with the arched roof excavated in an anisotropic in situ stress field were considered. In anisotropic in situ stress fields, the optimum opening shape for stability might not be the same for static and dynamic conditions (Genis and Gerçek 2003). If the initial in situ stresses are anisotropic, the shape and size of yield zone are different compared with those under hydrostatic in situ stress conditions. When initial vertical stress is the minimum component, orienting the tunnel parallel to the larger of the horizontal stresses is more favorable. Nevertheless, when vertical stress is the maximum component, orienting the tunnel parallel to the smaller of the horizontal stresses is more preferable (Gerçek and Genis 1999). This is also valid under dynamic conditions (Genis 2002).
Genis and Aydan (2007) carried out a series of numerical studies for the static and dynamic stability assessments of a large underground opening for a hydroelectric powerhouse. The cavern is made of granite under high initial stress condition and approximately 550 m below the ground surface. The area in 1891 experienced the largest inland earthquake in Japan. In the numerical analyses, the amplitude, frequency content and propagation direction of waves were varied (Fig. 14). Numerical analyses indicated that yield zone formation is frequency and amplitude dependent. Furthermore, the direction of wave propagation also has a large influence on the yield zone formation around the cavern. When maximum ground acceleration exceeds 0.6–0.7 g, it results in the increase of plastic zones around the opening. Thus, there will be no additional yield zone around the cavern if the maximum ground acceleration is less than these threshold values.

Yield zone formation of underground powerhouse for different cases of input ground motions (arranged from Genis and Aydan, 2007)
The elastoplastic dynamic response of an underground shelter in Bukittinggi (Indonesia), which was excavated from very soft rock in 1942 and experienced the M6.8 Singkarak earthquake in 2007, was chosen as an actual example and its dynamic response and stability were analyzed (Aydan and Genis 2008b). There was no acceleration record in the vicinity of the underground shelter. However, the inferred maximum ground acceleration was about 0.3 g as shown by Aydan (2007). Therefore, sinusoidal waves with frequencies of 0.3, 1 and 3 Hz and amplitude of 0.3 g were applied horizontally to the base of the model. Figure 15 shows a three-dimensional perspective view of the underground shelter, acceleration responses at selected positions where some seismic damage were actually observed and displacement and yield zone distributions after the ground shaking disappeared. Although the analyses are limited to simple waveforms, the results can explain possible causes of the damage and its variation in the underground shelter.

Displacement response and yield zone around Bukittinggi underground shelter (arranged from Aydan and Genis 2008b)
6 Case Histories and Analysis
6.1 Case Histories
The authors compiled a number of case histories such as tunnel damage, caves and underground powerhouses from various reports, papers and their own observations (Kuno 1935; Okamoto 1973; Rozen 1976; Tsuneishi et al. 1978; Kawakami 1984; Asakura et al. 1996; Prentice and Ponti 1997; Asakura and Sato 1998; Berberian et al. 1999; Hashimoto et al. 1999; Sakurai 1999; Aydan et al. 2000; Ueta et al. 2001; Wang et al. 2001; Ulusay et al. 2002; Aydan 2003; Esghi and Zare 2003; Aydan and Kawamoto 2004; TEC-JSCE 2005; Yashiro et al. 2007; Aydan et al. 2009a, b, c). The earthquakes, which caused the damage to tunnels, are listed in Table 1. The damage to underground structures may be classified as:
-
1.
shaking-induced damage (Figs. 16, 17, 18, 19, 20);
Fig. 16 
Examples of damaged tunnels by the 1923 Kanto earthquake (JSCE Archive)
Fig. 17 
Views of the collapsed section of Bolu tunnel and its surface depression
Fig. 18 
Caving at Yamoto abandoned mine (from Aydan and Kawamoto 2004)
Fig. 19 
Sinkholes in L’Aquila (from Aydan et al. 2009c)
Fig. 20 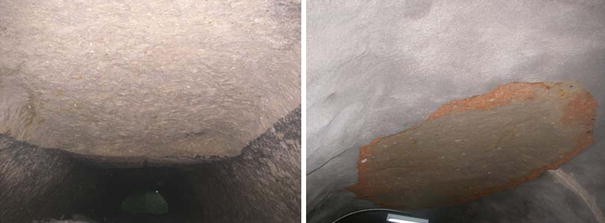
Spalling from the roof in Bukittinggi underground shelter by the 2007 Singkarak earthquake
-
2.
portal damage (Fig. 21) and
Fig. 21 
Examples of damaged portals of tunnels. a 1992 Erzincan. b 2005 Kashmir. c 2008 Wenchuan
-
3.
permanent ground deformations-induced damage (Figs. 22, 23).
Fig. 22 
Damage at the Rokko tunnel by the 1995 Kobe earthquake (from Asakura and Sato 1998)
Fig. 23 
Views of earthquake damage at Longqi (Longxi) and Jiujiaya tunnels


Permanent ground deformation-induced damage is generally caused either by faulting or slope movements.
6.2 Analysis and Discussion
Permanent ground deformations may result from relative movement along the earthquake faults, earthquake-induced slope failures involving tunnels and plastic deformation of ground due to high ground accelerations. The authors compiled case histories listed in Table 1 and developed databases for three different categories of damages, namely, faulting induced (18 cases histories), shaking induced (98 case histories) and slope failure induced (47 cases histories). The parameters of these databases are: the name of the tunnel, earthquake parameters (magnitude, hypocenter depth, relative slip), distances from epicenter and the earthquake fault surface trace (extrapolated surface trace when earthquake fault does not appear on the ground surface), geometry of tunnel, overburden, lining thickness, rock bolt density, rock unit and damage level index (DLI) defined in Table 2. Case histories are plotted in Fig. 24 with different symbols depending on the damage mode, the moment magnitude (Mw) of the earthquake and hypocentral distance (R) of the underground structure. As expected, the hypocentral distance of the damaged underground structures increases as the magnitude of the earthquake becomes larger. Furthermore, the limiting relations for fault-induced and ground shaking-induced damage on tunnels would be different. The available case history data also imply that there is no damage to underground openings by earthquakes when the magnitude is less than 6.

Empirical relations between magnitude and limiting damage distance
The limiting distance of damage to portals of underground openings would be more far-distant and the relation proposed by Aydan (2007, 2009a) for slope failure given below may be used for this purpose:
where θ is the angle of the location from the strike of the fault. Constants A and B of Eq. 7 are given in Table 2 according to ground conditions. Since ground accelerations differ according to the location with respect to fault geometry, the empirical bounds proposed herein can provide some basis for the scattering range of observations.
The definitions of damage to underground structures are generally too broad and a more refined classification of damage is felt to be necessary. The authors would propose a classification for this purpose as given in Table 3.
Figure 25 shows the re-plotted data shown in Fig. 24 as a function of distance (R f) from the surface trace or extrapolated surface trace of the earthquake fault. The vertical axis is the damage level index, the minimum and maximum values of which are 1 and 7, respectively. When the tunnel response is purely elastic, the damage level is assigned as 1. The functional form for the damage level index of underground openings subjected to earthquakes may be given in the following form:

Relation between distance (R f) from surface trace of the fault and damage level index (DLI)
where V s , R f, θ, M and δ max are the shear velocity of ground, the distance from the actual or extrapolated surface fault surface, the angle of the location from the strike of the fault (measured anti-clockwise with the consideration of the mobile side of the fault), earthquake magnitude and maximum relative slip of the earthquake fault. It is an extremely difficult task to select the specific functional form of Eq. 8. Aydan (2007) (see also Aydan et al. 2009a) proposed several empirical relations between the various characteristics and moment magnitude of earthquakes. For example, the attenuation relation for maximum ground motion parameters (maximum ground acceleration or velocity) are given in the following functional form:
or more specifically
where parameters A and C depend on the nature of earthquake (i.e., interplate or intraplate). Taking into account the empirical relation (Eq. 9a, b) by Aydan (2007) with a slight change and the maximum and minimum values of DLI, we propose the following functional form for the damage level index (DLI) and plot it for different magnitudes in Fig. 25:
where C* is assumed to be a function of moment magnitude as given below
It should be noted that the value of \( Ae^{{ - V_{s} /B}} \) must not be greater than 6 in view of the maximum value of the DLI. The authors plotted Eq. 10 in Fig. 25 for different magnitudes by assuming that θ = 90° and fixing the value of \( Ae^{{ - V_{s} /B}} \) to 6 with D = 0.5 and E = 2.5. As noted from Fig. 25, the chosen function can closely estimate the observed damage level index of underground openings subjected to earthquakes. Nevertheless, the authors also feel the necessity of including a function related to the relative slip of the fault in Eq. 10.
6.3 Possible Countermeasures
As proposed by Aydan (Aydan et al. 1999; Ulusay et al. 2002; Aydan 2003), the enlargement of cross sections of underground opening (i.e., tunnels) are necessary to accommodate the possible relative permanent ground deformations along active faults with the consideration of their sense of deformation. However, none of the structural geologists can definitely say which fault segment would move in the next earthquake. Furthermore, there may be negative and positive flower structures in the vicinity of the ground surface. Therefore, the possible ground movements would be diluted into a wide zone as seen in the 2008 Wenchuan earthquake and such a countermeasure may be difficult to implement. Nevertheless, the fracture path may follow already broken zones, such as fractures zones, so that such zones should be considered as potential locations of damage in risk assessments.
Non-reinforced concrete linings are commonly used for tunnels worldwide except the tunnel portals. As non-reinforced concrete linings fail in a very brittle manner, this may result in secondary disasters during their service life. Therefore, some countermeasures are necessary to deal with this problem. As suggested by Aydan et al. (2009b), there may be two possible ways to deal with this issue. The first alternative would be to line the concrete lining with thin steel platens together with rock bolts. The other alternative may be to use fiber-reinforced polymers together with rock bolts to line the inner side of the concrete lining.
7 Conclusions
The authors have tried to describe the response and stability issues of underground openings during earthquakes. Although the underground openings are regarded as earthquake resistant, the recent earthquakes worldwide showed that the underground openings are also vulnerable to seismic damage due to ground shaking as well as permanent ground induced by faulting and slope movements. This is a very important issue and it has to be well studied as the engineering use of underground space is becoming more widespread. Furthermore, the unknown natural caves beneath settlements and transportation facilities may also result in some problems during earthquakes. Although this article may not address all these issues, the following conclusions may be drawn.
The ground motions induced by earthquakes are generally smaller than those at the ground surface. Theoretical studies and monitoring results indicate that the surface acceleration was generally twice or greater than twice of that at depths.
The GPS measurements of ground deformations during earthquakes (M > 6) clearly indicated that permanent ground deformations do occur. Permanent ground deformations may result from different causes such as faulting, slope failure, liquefaction and plastic deformation induced by ground shaking. They may cause tremendous forces on long and/or large underground structures such as tunnels, powerhouses and underground storage facilities of oil, gas and nuclear wastes.
Model experiments on various underground openings show that they are strong against shaking. Nevertheless, the existence of discontinuities makes them vulnerable to collapses, particularly in case of shallow underground openings. This may have some important implications in areas where shallow abandoned mines, underground shelters and old tunnels exist.
Plastic zones around underground openings may form during the passage of seismic waves. The maximum amplitude and frequency content of the seismic waves may have some influence on the shape and size of plastic zone formations.
Case histories compiled by the authors indicated that the damage to underground structures might be classified as shaking-induced damage, portal damage and permanent ground deformations induced damage. Permanent ground deformation-induced damage is generally caused either by faulting or slope movements.
The definitions of damage to underground structures are generally too broad and a more refined classification of damage is necessary. The authors proposed such a classification as given in Table 3. This classification may serve as a better guideline for classifying the damage to underground structures, although further refinement of the classification may be done with compilation in analyzing more data on underground openings. The restrictions during the damage investigations imposed by authorities owning such underground structures should be eliminated so that better information may be gathered by scientists and engineers for constructing earthquake resistant new underground structures or retrofitting existing ones.
The proposed relations for assessing the seismic damage to underground structures under various circumstances may serve as guidelines. However, further refinement may be possible with more data on the underground structures.
Underground openings crossing faults and fracture zones may be enlarged to accommodate relative slips along faults and fracture zones. The lining of the openings should be ductile to accommodate permanent ground deformations at such zones. Furthermore, the brittle linings of the existing underground structures should be lined with ductile thin plates or fiber-reinforced polymers together with rock bolts at fracture and fault zones, where permanent ground deformations may occur.
References
Asakura T, Sato Y (1998) Mountain tunnels damage in the 1995 in Hyogo-ken Nanbu earthquake. 39(1), Railway Technical Research Institute (RTRI), p 9–16
Asakura T, Shiba Y, Sato Y, Iwatate T (1996) Mountain tunnels performance in 1995 Hyogo-ken Nanbu earthquake. Special report of the 1995 Hyogo-ken nanbu earthquake, Committee of Earthquake Engineering, JSCE
Aydan Ö (2003) Actual observations and numerical simulations of surface fault ruptures and their effects engineering structures. The eighth US–Japan workshop on earthquake resistant design of lifeline facilities and countermeasures against liquefaction. Technical report, MCEER-03-0003, 227–237
Aydan Ö (2007) Inference of seismic characteristics of possible earthquakes and liquefaction and landslide risks from active faults (in Turkish). The 6th national conference on earthquake engineering of Turkey, Istanbul 1:563–574
Aydan Ö, Genis M (2008a) Assessment of dynamic stability of an abandoned room and pillar underground lignite mine (in Turkish). Turkish J Rock Mech 16:23–44
Aydan Ö, Genis M (2008b) The seismic effects on the Bukit-Tinggi WWII underground shelter by 2007 Singkarak (Solok) earthquake. Proceedings of the ISRM international symposium 2008, fifth Asian rock mechanics symposium, Tehran, 917–924
Aydan Ö, Kawamoto T (2004) The damage to abandoned lignite mines caused by the 2003 Miyagi-Hokubu earthquake and some considerations on its causes. Third Asian rock mechanics symposium, Kyoto, 525–530
Aydan Ö, Shimizu Y, Karaca M (1994) The dynamic and static stability of shallow underground openings in jointed rock masses. The third international symposium on mine planning and equipment selection, Istanbul, October, 851–858
Aydan Ö, Ulusay R, Hasgür Z, Hamada M (1999) The behaviour of structures built in active fault zones in view of actual examples from the 1999 Kocaeli and Chi-chi Earthquakes. ITU-IAHS International Conference on the Kocaeli Earthquake 17 August 1999: a scientific assessment and recommendations for re-building, Istanbul, 131–142
Aydan Ö, Ulusay R, Kumsar H, Tuncay E (2000) Site investigation and engineering evaluation of the Düzce-Bolu earthquake of November 12, 1999. Turkish earthquake foundation, TDV/DR 09-51, p 220
Aydan Ö, Daido M, Ito T, Tano H, Kawamoto T (2006) Instability modes of abandoned lignite mines and the assessment of their stability in long-term and during earthquakes. Third Asian rock mechanics symposium, Singapore
Aydan Ö, Ohta Y, Hamada M (2009a) Geotechnical evaluation of slope and ground failures during the 8 October 2005 Muzaffarabad earthquake in Pakistan. J Seismol 13(3):399–413
Aydan Ö, Hamada M, Itoh J, Ohkubo K (2009b) Damage to civil engineering structures with an emphasis on rock slope failures and tunnel damage induced by the 2008 Wenchuan earthquake. J Disaster Res 4(2):153–164
Aydan Ö, Kumsar H, Toprak S, Barla G (2009c) Characteristics of 2009 l’Aquila earthquake with an emphasis on earthquake prediction and geotechnical damage. J Mar Sci Technol 9(3):23–51
Berberian M, Jackson JA, Qorashi M, Khatib MM, Priestley K, Talebian M, Ghafuri-Ashtiani M (1999) Ghafuri-Ashtiani M (1999) The 1997 May 10 Zirkuh (Qa’enat) earthquake (Mw.2): faulting along the Sistan suture zone of eastern Iran. Geophys J Int 136(3):671–694
Dowding CH, Rozen A (1978) Damage to rock tunnels from earthquake shaking. J Geoetech Engr Div, ASCE, GT2, 175–191
Esghi S, Zare M (2003) Bam (SE Iran) earthquake of 26 December 2003, Mw6.5: A preliminary reconnaissance report, http://www.iiees.ac.ir/
Genis M (2002) Investigation of the effects of geometrical design parameters on the dimensions of failure zone occurring around deep underground openings under static and dynamic conditions. Dissertation (in Turkish), Zonguldak Karaelmas University, Department of Mining Engineering, Zonguldak, Turkey, 352 p
Genis M, Aydan Ö (2002) Evaluation of dynamic response and stability of shallow underground openings in discontinuous rock masses using model tests. Korea-Japan joint symposium on rock engineering, Seoul, Korea, 787–794
Genis M, Aydan Ö (2007) Static and dynamic stability of a large underground opening. In: N. Bilgin et al. (eds) Proceedings of the second symposium on Underground excavations for Transportation (in Turkish), TMMOB, Istanbul, 138, 317–326
Genis M, Aydan Ö (2008) Assessment of dynamic response and stability of an abandoned room and pillar underground lignite mine. In: The 12th international conference of international association for computer methods and advances in geomechanics (IACMAG), Goa, India, 3899–3906
Genis M, Gerçek H (2003) A numerical study of seismic damage to deep underground openings. ISRM 2003-technology roadmap for rock mechanics, 10th ISRM congress, South African institute of mining and metallurgy, 351–355
Gerçek H, Genis M (1999) Effect of anisotropic in situ stresses on the stability of underground openings. In: Proceedings of the ninth international congress on rock mechanics, ISRM, Rotterdam, Balkema, vol 1, 367–370
Hashimoto S, Miwa K, Ohashi M, Fuse K (1999) Surface soil deformation and tunnel deformation caused by the September 3, 1998, Mid-North Iwate Earthquake. Seventh Tohoku regional convention, Jpn Soc Eng Geol
Japan society of civil engineers (1923) Archives of structural damage by the 1923 Great Kanto Earthquake. http://www.jsce.or.jp
Kanai K, Tanaka T (1951) Observations of earthquake motion at different depths of the earth. Bull Earthq Res Inst Tokyo Univ 28:107–113
Karaca M, Egger P, Aydan Ö, Sezaki M (1995) Mechanics of failure around shallow tunnels in jointed rock. In: Rossmanith (ed) Mechanics of jointed and faulted rock, Balkema, Rotterdam
Kawakami H (1984) Evaluation of deformation of tunnel structure due to Izu-Oshima Kinkai earthquake of 1978. Earthq Eng Struct Dyn 12(3):369–383
Komada H, Hayashi M (1980) Earthquake observation around the site of underground power station. CRIEPI report, E379003, Central Research Institute of Electric Power Industry, Japan, 1–34
Kuno H (1935) The geologic section along the Tanna Tunnel. Bull Earthq Res Inst 14:92–103
Nasu N (1931) Comparative studies of earthquake motions above ground and in a tunnel. Bull Earthq Res Inst 9:454–472
Okamoto S (1973) Introduction to earthquake engineering. University of Tokyo Press
Prentice C, Ponti D (1997) Coseismic deformation of the Wrights tunnel during the 1906 San Francisco earthquake: a key to understanding 1906 fault slip and 1989 surface ruptures in the southern Santa Cruz Mountains, California. J Geophys Res 102:635–648
Reilinger RE, Ergintav S, Burgmann R, McClusky S, Lenk O, Barka A, Gürkan O, Hearn L, Feigl KL, Çakmak R; Aktug B, Özener H, Toksöz MN (2000) Coseismic and postseismic fault slip for the 17 August 1999, M = 7.5, Izmit, Turkey Earthquake, Science, vol 289
Rozen A (1976) Response of rock tunnels to earthquake shaking. Dissertation in Civil Engineering. Massachusetts Institute of Technology
Sakurai T (1999) A report on the earthquake fault appearing in the Tanna tunnel under construction by North-Izu earthquake 1930 (in Japanese). J Japan Soc Eng Geol 39(6):540–544
Sharma S, Judd WR (1991) Underground opening damage to underground facilities. Eng Geol 30:263–276
TEC-JSCE (Tunnel Engineering Committee-JSCE) (2005) Report of the 2004 Mid Niigata Prefecture earthquake (in Japanese). JSCE
Tsuneishi Y, Ito T, Kano K (1978) Surface faulting associated with the 1978 Izu-Oshima- Kinkai earthquake. Bull of the Earthq Res Inst Tokyo Univ 53:649–674
Ueta K, Miyakoshi K, Inoue D (2001) Left-lateral deformation of head-race tunnel associated with the 2000 western Tottori earthquake. J Seismol Soc Jpn 54(2):547–556
Ulusay R, Aydan Ö, Hamada M (2002) The behavior of structures built on active fault zones: examples from the recent earthquakes of Turkey. Struct Eng Earthq Eng JSCE 19(2), special issue:149–167
Wang WL, Wang TT, Su JJ, Lin CH, Seng CR, Huang TH (2001) Assessment of damage in mountain tunnels due to the Taiwan Chi-Chi earthquake. Tunnel Undergr Space Technol 16:133–150
Whittaker BN, Reddish DJ (1989) Subsidence: occurrence, prediction and control. Dev Geotech Eng, 56, Elsevier, 528 p
Yashiro K, Kojima Y, Shimizu M (2007) Historical earthquake damage to tunnels in Japan and case studies of railways tunnels in the 2004 Niigata-ken Chuetsu earthquake. Q R RTRI 48(3):136–141
Acknowledgments
The authors would like to sincerely thank Emeritus Professor T. Kawamoto of Nagoya University for encouraging the authors to undertake these studies, Dr. H. Komada of Central Research Institute of Electric Power Companies (Japan) for providing information and data on underground powerhouses, Prof. Z. Hasgür of Istanbul Technical University, Prof. R. Ulusay of Hacettepe University, Prof. M. Hamada of Waseda University, Prof. K. Kawashima of Tokyo Institute of Technology, Prof. K. Konagai of Tokyo University, Prof. G. Barla of Politecnico di Torino for joining the authors during many site investigations of worldwide earthquakes since 1992 and former and current undergraduate and graduate students of Aydan’s laboratory in Tokai University for experimental studies in laboratory. The authors would also like to thank Prof. G. Barla for inviting them to contribute to the special issue on rock dynamics.
Author information
Authors and Affiliations
Corresponding author
Rights and permissions
About this article
Cite this article
Aydan, Ö., Ohta, Y., Geniş, M. et al. Response and Stability of Underground Structures in Rock Mass during Earthquakes. Rock Mech Rock Eng 43, 857–875 (2010). https://doi.org/10.1007/s00603-010-0105-6
Received:
Accepted:
Published:
Issue Date:
DOI: https://doi.org/10.1007/s00603-010-0105-6