
Abstract
Aortic aneurysm and/or dissection (AAD) is a life-threatening condition, and several syndromes are known to be related to AAD. In this study, two new technologies, resequencing array technology (ResAT) and next-generation sequencing (NGS), were used to analyze eight genes associated with syndromic AAD in 70 patients with non-syndromic AAD. Eighteen sequence variants were detected using both ResAT and NGS. In addition one of these sequence variants was detected by ResAT only and two additional variants by NGS only. Three of the 18 variants are likely to be pathogenic (in 4.3% of AAD patients and in 8.6% of a subset of patients with thoracic AAD), highlighting the importance of genetic analysis in non-syndromic AAD. ResAT and NGS similarly detected most, but not all, of the variants. Resequencing array technology was a rapid and efficient method for detecting most nucleotide substitutions, but was unable to detect short insertions/deletions, and it is impractical to update custom arrays frequently. Next-generation sequencing was able to detect almost all types of mutation, but requires improved informatics methods.
Introduction
Aortic aneurysm and/or dissection (AAD) is a life-threatening condition. As significant symptoms do not usually appear before the rupture of the AAD, which can be lethal, it is often difficult to prevent death from AAD. Timely cardiovascular surgery may prevent AAD rupture and save the patient’s life. Approximately 20% of patients with thoracic aortic disease have a family history of the disease, which is typically inherited in an autosomal dominant manner with decreased penetrance and variable expressivity (Wang et al. 2010). Therefore, if a causative mutation is detected in a patient, it is worth checking for the mutation in their asymptomatic family members to prevent future aortic events by medical and/or surgical intervention. Several genes are known to be associated with syndromes presenting with hereditary AAD and vascular disruption: FBN1 (Dietz et al. 1991; Lee et al. 1991a), TGFBR2 (Mizuguchi et al. 2004), TGFBR1 (Loeys et al. 2005), MYH11 (Zhu et al. 2006), ACTA2 (Guo et al. 2007), COL3A1 (Superti-Furga et al. 1988), PLOD1 (Hautala et al. 1993), and SLC2A10 (Coucke et al. 2006) (Table 1). Most AAD patients who have been surgically treated are not affected by these syndromes. However, the contribution of these genes to non-syndromic AAD has not been thoroughly investigated. A comprehensive study of these genes by conventional Sanger sequencing is a huge and expensive undertaking. Even high-resolution melting methods and denaturing high performance liquid chromatography require the amplification of at least 210 exons from these eight genes (Table 1). Therefore, it has been unrealistic for most laboratories to analyze these genes in multiple samples.
Resequencing array technology (ResAT) enables the investigation of multiple genes on one chip. This technology has been used for multiple-gene analysis in childhood hearing loss (Kothiyal et al. 2010), breast-ovarian cancer syndrome (Schroeder et al. 2010), dilated cardiomyopathy (Zimmerman et al. 2010), X-linked intellectual disability (Jensen et al. 2011), familial hypercholesterolemia (Chiou et al. 2011), and hypertrophic cardiomyopathy (Fokstuen et al. 2011). Different research groups have shown ResAT to be a highly efficient, relatively accurate, cost-effective, and rapid method. However, several drawbacks have been pointed out, including its insensitivity in detecting nucleotide insertions/deletions (indels) and nucleotide changes in GC-rich regions and repeat sequences.
Next-generation sequencing (NGS) is now regarded as the most powerful technology for detecting mutations (Ng et al. 2010; Tsurusaki et al. 2011). This platform is advantageous in finding almost all types of mutations including small indel mutations. The high throughput and multiplexing of NGS allows multiple genes to be sequenced in many samples in a single run (Farias-Hesson et al. 2010; Gabriel et al. 2009).
In this study, we analyzed the eight AAD-associated genes (FBN1, TGFBR2, TGFBR1, COL3A1, PLOD1, MYH11, SLC2A10, and ACTA2) in 70 patients with non-syndromic AAD by two methods: ResAT (all eight genes on one chip) and multiplex NGS. We describe here a comparison of the results.
Materials and methods
Patients
Seventy Japanese patients, who had surgery for AAD, were recruited from Yokohama City University Hospital and Yokohama City University Medical Center. The patients’ clinical information is summarized in Table 2. Thoracic AAD involves the aorta above the diaphragm and abdominal AAD is located along the portion of the aorta passing through the abdomen. None of the patients in this study had any clinical test results supporting a diagnosis of syndromic AAD. Experimental protocols were approved by the Institutional Review Board of Yokohama City University School of Medicine. Informed consent for genetic analysis was obtained from the patients. DNA was extracted from peripheral blood leukocytes using a QuickGene-610L kit (Fujifilm, Tokyo, Japan).
Array design
Eight genes (FBN1, TGFBR2, TGFBR1, COL3A1, PLOD1, MYH11, SLC2A10 and ACTA2) (Table 1) associated with AAD were selected for one custom chip (Affymetrix, Santa Clara, CA). All coding exons as well as 29 bp of sequence from each intron (21 bp on the 5′-side and 8 bp on the 3′-side of each exon) were analyzed. Repetitive sequences and intragenic low complexity regions larger than 25 bp were excluded from the chip. A total of 33,116 bp from the eight genes could be sequenced using this chip.
PCR amplification, purification, hybridization, scanning, and data analysis
The targeted regions were amplified as 124 fragments by PCR (ranging from 965 to 2,999 bp) using Blend Taq Plus (TOYOBO, Osaka, Japan) or KOD FX (TOYOBO) and genomic DNA as a template in a 20 μL volume. The PCR conditions were: denaturing at 94°C, 35 cycles of 94°C for 30 s, 62°C for 30 s, and 72°C for 3 min, and a final extension at 72°C for 7 min. The DNA concentration of the amplicons was determined using a Quant-iT PicoGreen dsDNA Assay Kit (Invitrogen, Carlsbad, CA, USA) with a Spectra Fluor F129003 (Tecan, Männedorf, Switzerland). The PCR amplicons were pooled in equimolar quantities (110 fmol). The mixed samples were purified and the volume was reduced using a Microcon YM-100 filter (Millipore, Brussels, Belgium). Fragmentation of the products, labeling with biotin, hybridization, washing, and scanning procedures were carried out based on the CustomSeq resequencing array protocol version 2.1 (Affymetrix). An FS450 fluidics station (Affymetrix) was used for washing and staining and a GCS3000 7G scanner (Affymetrix) was used for scanning. To test the efficiency of mutation detection, PCR products containing 20 known heterozygous mutations (Table 3) from three genes (FBN1, TGFBR2, and TGFBR1), as well as another 104 PCR products amplified from normal control DNA, covering all the other exons, were analyzed using the chip. Affymetrix GCOS and GSEQ software were used to process the raw data and analyze the nucleotide sequences, respectively. The default settings of GSEQ were adopted.
Multiplex next-generation sequencing
The PCR amplicons from one patient were mixed and processed using a multiplexing sequencing primers and PhiX control kit (Illumina, San Diego, CA, USA) according to the manufacturer’s instructions but with minor changes. In brief, amplicons were fragmented with Covaris S1 (Covaris, Woburn, MA, USA), and purified using Agencourt AMPure (Beckman Coulter, Brea, CA, USA) instead of gel extraction. DNA quality was checked with an Agilent 2100 bioanalyzer (Agilent Technologies, Santa Clara, CA, USA) and a bar code DNA tag (Illumina) was ligated on. The bar code DNA tags contain unique 6 bp sequences and allow the processing of up to 96 DNA fragments in a single run using an Illumina GAIIx (Illumina). Twelve processed DNA fragments, each with a different tag, were mixed and analyzed with single 76 bp reads in one lane of the flow cell. Six lanes were necessary for the analysis of 70 samples. Image analysis and base calling were performed by sequence control software real-time analysis (Illumina) and offline Basecaller software v1.8.0 (Illumina). The reads were aligned to the human reference genome sequence (UCSC hg19, GRCh37) using the ELAND v2 algorithm in CASAVA software v1.7.0 (Illumina).
Mapping strategy and variant annotation
An average of 2.4 million reads (ranging from 1.7 to 4.0 million reads) for each sample passed quality control (Path Filter) and were mapped to the human reference genome using mapping and assembly with qualities (MAQ) (Li et al. 2008), NextGENe software v2.00 (SoftGenetics, State College, PA, USA), and Burrows-Wheeler Aligner (BWA)/sequence alignment/map tools (SAMtools) (Li and Durbin 2010; Li et al. 2009). Single nucleotide polymorphisms (SNPs) and indels were extracted from the alignment data using an original script created by BITS, Tokyo, Japan along with information on the registered SNPs (dbSNP131). A consensus quality score of 40 or more was used for the SNP analysis in MAQ. SNPs in MAQ-passed reads were annotated using the SeattleSeq website (http://gvs.gs.washington.edu/SeattleSeqAnnotation/). A minimum base quality of 13, a minimum root mean square mapping quality for SNPs of 10, and a minimum read depth of 2 were used in BWA/SAMtools (Li and Durbin 2010; Li et al. 2009). NextGENe (SoftGenetics) was also used to analyze the reads, employing default settings apart from using the no-condensation mode. For base substitutions, we focused on variants detected in common by both MAQ and NextGENe. Small indel variants were classified as positive if found by both BWA and NextGENe.
Validation of novel variants
Novel variants (not in dbSNP131, the 1,000 genomes dataset or our in-house database) identified by ResAT and NGS were validated by Sanger sequencing. Surplus PCR products were treated with ExoSAP IT (GE Healthcare, Piscataway, NJ) and sequenced using a standard protocol using BigDye terminators (Applied Biosystems, Foster City, CA, USA) on an ABI PRISM 3100 genetic analyzer (Applied Biosystems). Furthermore, novel variants were screened in 94 Japanese controls by high-resolution melt curve analysis (LightCycler 480; Roche Diagnostics, Basel, Switzerland) and subsequent Sanger sequencing. Novel variants were evaluated using web-based programs including PolyPhen (http://genetics.bwh.harvard.edu/pph/), PolyPhen2 (http://genetics.bwh.harvard.edu/pph2/), Mutation Taster (http://www.mutationtaster.org/), and ESEfinder (http://rulai.cshl.edu/cgi-bin/tools/ESE3/esefinder.cgi?process=home).
Results
Array performance
Across all 70 samples, the mean nucleotide call rate was 95.7% (range 87.3–97.6%) using the default settings of GSEQ. We observed an improvement of the call rate as the number of samples increased. For example, the call rate by GCOS for the first two samples was 90.1 and 90.6% and was 93.3 and 93.9% when 10 samples were analyzed, and was 94.9 and 95.5% when 33 samples were analyzed. However, between 34 and 70 samples, the call rate did not greatly improve (only by 1%). We had constant difficulty in reading approximately 4% of the sequences per array (i.e., no sequence called), mostly in regions of high GC and CC content.
Detection of known mutations by ResAT
To validate the quality of mutation detection in our resequencing array, we analyzed amplicons containing 16 known nucleotide substitutions, three small deletions (1–2 bp), and one 1 bp insertion, plus all the other normal exons (Sakai et al. 2006; Togashi et al. 2007) (Table 3). Fourteen out of 16 nucleotide substitutions were detected (87.5%) by GSEQ in the automated mode. Two mutations (c.772C > T in FBN1 and c.1142G > C in TGFBR2) were not detected. The former was insensitive, and the latter was indicated as a no-call. Visual inspection in the manual mode enabled easy detection of the TGFBR2 mutation. The mutation detection rate was 93.8% (15/16) using both the automated and manual modes. None of the small indels were detected by our array in either the automated or manual modes.
Variant detection by ResAT
We detected 70 nucleotide substitutions in the automated mode in the 70 patients analyzed (0–3 variants per sample). Fifty-one variants were already registered in dbSNP131 and/or in our in-house database (Supplementary table). The remaining 19 novel variants were validated by Sanger sequencing (Table 4). One variant (c.976–16C > T in PLOD1) was homozygous and the others were heterozygous. No indel mutations were detected.
Variant detection by NGS
The target regions were completely covered by NGS reads (100%). The average read depth (coverage of sequence reads) was approximately 600 for each gene (Table 5). The NextGENe software detected a mean of 876 variants in the 70 patients with mutation scores of 10 or more (ranging from 581 to 1209 with SD = 131). MAQ and SeattelSeq detected a mean of 271 variants (ranging from 111 to 384 with SD = 52). Semi-automatic exclusion of variants that were out of the target regions (22 bp or more away from the 5′-end of exons and 9 bp or more away from the 3′-end of exons) or were known variants in dbSNP131 was performed using Excel 2008 for Mac (Microsoft, Redmond, WA, USA), narrowing the data down to 0–6 variants per sample. Twenty novel variants were detected by both MAQ and NextGENe, which were further validated by Sanger sequencing. No indel mutations were detected by MAQ, NextGENe, or BWA/SAMtools.
Comparison of ResAT and NGS variants
Eighteen novel variants were detected by ResAT and NGS. One was detected by ResAT only and two by NGS only. The two variants undetected by ResAT were c.1388G > A (p.Arg463Gln) in PLOD1 and c.136A > C (p.Ser46Arg) in TGFBR2. The former was indicated as a no-call, but was detected later in the manual mode. The latter was within a repetitive sequence. One variant (c.1815 + 5G > A in COL3A1) was undetected by NGS due to our set criteria (the variant was detected by MAQ, but not by NextGENe or BWA/SAMtools).
Pathological significance of the variants
We realized that none of the known pathogenic mutations were identified. The pathological impact of the variants was considered if none of the healthy controls showed the same change, if the variants altered evolutionarily conserved amino acids in functional repeats/domains, or if they were predicted to cause abnormal splicing resulting in protein truncation or degradation. Moreover, homozygous and compound heterozygous changes that were found in PLOD1 and SLC2A10 may confer autosomal recessive effects. At least three heterozygous variants were considered as putative pathogenic gene alterations (Table 6):
-
1.
c.1815 + 5G > A in COL3A1 (patient 29). A similar mutation, c.1815 + 5G > T, associated with the skipping of exon 25, was reported in a patient with Ehlers–Danlos syndrome type IV (EDS IV) (Lee et al. 1991b). ESEfinder suggested that the binding position of the splice donor matrix was changed similarly by c.1815 + 5G > A and c.1815 + 5G > T. Thus, C.1815 + 5G > A is highly likely to be pathogenic.
-
2.
c.4963C > T (p.Arg1655Cys) in MYH11 (patient 16). In addition to this mutation, the patient had two novel heterozygous variants: c.4625G > A (p.Arg1542Gln) in MYH11 and c.1220T > G (p.Leu407Arg) in SLC2A10. Mutations in SLC2A10 cause autosomal recessive arterial tortuosity syndrome (MIM #208050) (Coucke et al. 2006), although it is unknown whether the heterozygous variant we identified would be related to this, assuming a second-hit model of recessive disease. Both p.Arg1542Gln and p.Arg1655Cys in MYH11 were similarly predicted to be pathogenic by three programs (PolyPhen, PolyPhen2, and Mutation Taster). These residues are located in the coiled-coil region, and both are evolutionarily conserved amino acids (Fig. 1). Paircoil2 (http://groups.csail.mit.edu/cb/paircoil2/) was used to predict the effect of variants on the parallel coiled coil fold using pairwise residue probabilities (McDonnell et al. 2006). Paircoil2 indicated that p.Arg1655Cys altered the p score from 0.00096 (wild type) to 0.00579 (mutation), while p.Arg1542Gln did not alter the p score, 0.00016 (mutation) and 0.00018 (wild type) (Fig. 1). Thus, p.Arg1655Cys was more likely than p.Arg1542Gln to be pathogenic.
Fig. 1 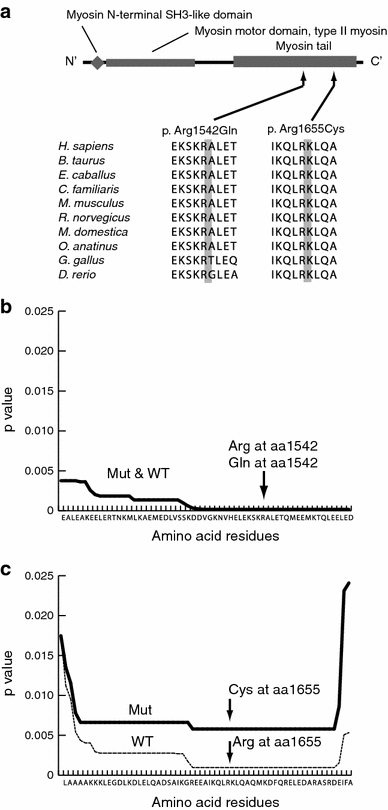
Double mutations in MYH11. a Schematic representation of the MYH11 protein. Three functional domains are indicated: the myosin N-terminal SH3-like domain, the myosin motor domain for type II myosin, and the myosin tail. Both the mutations are located in the myosin tail. b, c Paircoil2 analysis showing a significantly decreased probability of coiled-coil formation for p.Arg1655Cys relative to the wild-type sequence, but no change for p.Arg1542Gln
-
3.
c.482T > C (p.Val161Ala) in ACTA2 (patient 27). The patient was found retrospectively to suffer from familial thoracic AAD. The patient has an affected brother, but his DNA was unavailable. Valine at amino acid 161 is evolutionarily conserved and located within the actin domain. However, as we could not analyze the DNA of the affected brother, it may be more appropriate to call this variant ‘of unknown significance’.

Discussion
Exon-by-exon Sanger sequencing is the gold standard for genetic analysis, but multiple-gene analysis in many patients is a huge task in terms of time and cost. In this study, we applied two emerging technologies providing rapid and efficient analysis of eight genes in 70 AAD patients. We also compared the results of the two technologies.
The overall mean call rate of our custom array by GSEQ software was 95.7%, which is comparable with previous studies (Bruce et al. 2010; Chiou et al. 2011; Jensen et al. 2011; Schroeder et al. 2010). The call rates became higher as the number of patients increased. Approximately 33 samples were necessary to attain the maximum call-rate in GSEQ. A similar observation was described previously (Fokstuen et al. 2011). No-call regions are one of the problems of ResAT. Other groups have previously suggested that most of the no-call regions are GC- and CC-rich (Bruce et al. 2010; Chiou et al. 2011; Fokstuen et al. 2011). In our custom array, approximately 4% of the target sequences were difficult to obtain (no-calls) in most of the samples.
The mean detection rate of known variants using our custom array and GSEQ with the default settings (automated analysis) was 87.5%. This rate increased to 93.8% after manual inspection. For our ResAT data, the detection rate of nucleotide substitutions in the automated mode was higher, and that in the manual mode was slightly lower, compared with detection rates in previous studies (82.1 vs. 81%, respectively, in automated mode, and 97.4 vs. 100%, respectively, in manual mode) (Bruce et al. 2010; Chiou et al. 2011). Our ResAT analysis was unable to detect any small indel mutations; this is similar to other studies (Hartmann et al. 2009; Kothiyal et al. 2010). In the human gene mutation database (HGMD; http://www.hgmd.cf.ac.uk/ac/index.php), insertions/deletions account for a substantial proportion of the total registered mutations in our genes of interest: FBN1 23.6%, TGFBR2 6.4%, TGFBR1 10%, COL3A1 12.8%, PLOD1 46.2%, MYH11 20%, SLC2A10 21.1%, and ACTA 20%. Thus, the incapability of ResAT to detect indel mutations is one of its most significant drawbacks.
Our NGS analysis missed one of 21 variants (c.1815 + 5G > A in COL3A1). Our protocol focused on variants identified by two different informatics methods, to increase the true-positive rate. For example, MAQ (single-end reads) can detect nucleotide substitutions well, but is not good at detecting small indels (Li et al. 2008). BWA is more sensitive at detecting small indels because it can align gapped sequence (Krawitz et al. 2010). NextGENe is based on the Burrows-Wheeler transform algorithm, which is good at detecting small indels. NGS needs more efficient informatics methods to extract all the nucleotide changes correctly with lower error rates.
In this study, concomitant variants in two genes were detected in four patients (Table 4): c.4625G > A and c.4963C > T in MYH11, and c.1220T > G in SLC2A10 (patient 16); c.136A > C in TGFBR2 and c.130–18T > C in ACTA2 (patient 24); c.84T > C in COL3A1 and c.692C > T in TGFBR2 (patient 28); c.119C > T in COL3A1 and c.330C > T in SLC2A10 (patient 89) (Table 4). It may be quite difficult to detect variants in two or more genes by conventional methods. ResAT and NGS permitted us to find multiple variants in multiple genes easily and rapidly. Double or triple mutations in unusual clinical cases will also be found using such technologies.
Three different putative pathological mutations in a heterozygous state in three of 70 patients were found in this study (4.3%). Interestingly, all the three patients suffered from thoracic AAD. Considering only those patients with thoracic AAD (n = 35), the rate increased to 8.6%. Thus, non-syndromic AAD (especially thoracic AAD) can be explained to some extent by aberrations of genes related to Mendelian disorders, although our sample size was small. Interestingly, among these three patients, only patient 29 showed hyperlipidemia and the other two (patients 16 and 27) did not, which supports the genetic origin of thoracic AAD.
In this study, we compared ResAT and NGS. Considering the drawbacks of ResAT, including its inability to detect small indels and its no-call regions, we believe that NGS is the better technology for comprehensive analysis of multiple genes, especially with improved informatics methods, as it can detect all types of mutations with no bias. Another advantage of NGS is its flexibility. Resequencing array technology requires a custom-made sequencing array. It is not easy or practical to update arrays frequently. However, NGS is currently quite expensive for most laboratories. Next-generation sequencing combined with the pooled genomic DNA method with indexing may improve its cost-effectiveness (Calvo et al. 2010; Druley et al. 2009).
In conclusion, we found that 4.3% of non-syndromic AAD patients (8.5% of thoracic AAD patients) have abnormalities in genes that cause Mendelian disorders. ResAT and NGS enabled multiple genes to be analyzed efficiently. In addition to the 70 AAD patients, a patient with familial Marfan syndrome and a patient with Loeys–Dietz syndrome were initially included before their diagnosis was known. We detected c.6793T > G (p.Cys2265Gly) in FBN1 in the Marfan syndrome patient [by ResAT (NGS was not done)] and c.797A > G (p.Asp266Gly) in TGFBR1 in the Loeys–Dietz patient (by ResAT and NGS). We excluded these two patients from this study because they are syndromic AAD patients, but the efficient detection of their mutations highlights the validity of our approach. Finally, high throughput technologies have the potential to routinely identify novel variants of known or unknown significance in clinical settings. Therefore, more sophisticated methods to evaluate gene variants as well as databases containing normal (rare) variants are needed.
References
Bruce CK, Smith M, Rahman F, Liu ZF, McMullan DJ, Ball S, Hartley J, Kroos MA, Heptinstall L, Reuser AJ, Rolfs A, Hendriksz C, Kelly DA, Barrett TG, MacDonald F, Maher ER, Gissen P (2010) Design and validation of a metabolic disorder resequencing microarray (BRUM1). Hum Mutat 31:858–865
Calvo SE, Tucker EJ, Compton AG, Kirby DM, Crawford G, Burtt NP, Rivas M, Guiducci C, Bruno DL, Goldberger OA, Redman MC, Wiltshire E, Wilson CJ, Altshuler D, Gabriel SB, Daly MJ, Thorburn DR, Mootha VK (2010) High-throughput, pooled sequencing identifies mutations in NUBPL and FOXRED1 in human complex I deficiency. Nat Genet 42:851–858
Chiou KR, Charng MJ, Chang HM (2011) Array-based resequencing for mutations causing familial hypercholesterolemia. Atherosclerosis 216(2):383–389
Coucke PJ, Willaert A, Wessels MW, Callewaert B, Zoppi N, De Backer J, Fox JE, Mancini GM, Kambouris M, Gardella R, Facchetti F, Willems PJ, Forsyth R, Dietz HC, Barlati S, Colombi M, Loeys B, De Paepe A (2006) Mutations in the facilitative glucose transporter GLUT10 alter angiogenesis and cause arterial tortuosity syndrome. Nat Genet 38:452–457
Dietz HC, Cutting GR, Pyeritz RE, Maslen CL, Sakai LY, Corson GM, Puffenberger EG, Hamosh A, Nanthakumar EJ, Curristin SM et al (1991) Marfan syndrome caused by a recurrent de novo missense mutation in the fibrillin gene. Nature 352:337–339
Druley TE, Vallania FL, Wegner DJ, Varley KE, Knowles OL, Bonds JA, Robison SW, Doniger SW, Hamvas A, Cole FS, Fay JC, Mitra RD (2009) Quantification of rare allelic variants from pooled genomic DNA. Nat Methods 6:263–265
Farias-Hesson E, Erikson J, Atkins A, Shen P, Davis RW, Scharfe C, Pourmand N (2010) Semi-automated library preparation for high-throughput DNA sequencing platforms. J Biomed Biotechnol 2010:617469
Fokstuen S, Munoz A, Melacini P, Iliceto S, Perrot A, Ozcelik C, Jeanrenaud X, Rieubland C, Farr M, Faber L, Sigwart U, Mach F, Lerch R, Antonarakis SE, Blouin JL (2011) Rapid detection of genetic variants in hypertrophic cardiomyopathy by custom DNA resequencing array in clinical practice. J Med Genet 48(8):572–576
Gabriel C, Danzer M, Hackl C, Kopal G, Hufnagl P, Hofer K, Polin H, Stabentheiner S, Proll J (2009) Rapid high-throughput human leukocyte antigen typing by massively parallel pyrosequencing for high-resolution allele identification. Hum Immunol 70:960–964
Guo DC, Pannu H, Tran-Fadulu V, Papke CL, Yu RK, Avidan N, Bourgeois S, Estrera AL, Safi HJ, Sparks E, Amor D, Ades L, McConnell V, Willoughby CE, Abuelo D, Willing M, Lewis RA, Kim DH, Scherer S, Tung PP, Ahn C, Buja LM, Raman CS, Shete SS, Milewicz DM (2007) Mutations in smooth muscle alpha-actin (ACTA2) lead to thoracic aortic aneurysms and dissections. Nat Genet 39:1488–1493
Hartmann A, Thieme M, Nanduri LK, Stempfl T, Moehle C, Kivisild T, Oefner PJ (2009) Validation of microarray-based resequencing of 93 worldwide mitochondrial genomes. Hum Mutat 30:115–122
Hautala T, Heikkinen J, Kivirikko KI, Myllyla R (1993) A large duplication in the gene for lysyl hydroxylase accounts for the type VI variant of Ehlers–Danlos syndrome in two siblings. Genomics 15:399–404
Jensen LR, Chen W, Moser B, Lipkowitz B, Schroeder C, Musante L, Tzschach A, Kalscheuer VM, Meloni I, Raynaud M, van Esch H, Chelly J, de Brouwer AP, Hackett A, van der Haar S, Henn W, Gecz J, Riess O, Bonin M, Reinhardt R, Ropers HH, Kuss AW (2011) Hybridisation-based resequencing of 17 X-linked intellectual disability genes in 135 patients reveals novel mutations in ATRX, SLC6A8 and PQBP1. Eur J Hum Genet 19(6):717–720
Kothiyal P, Cox S, Ebert J, Husami A, Kenna MA, Greinwald JH, Aronow BJ, Rehm HL (2010) High-throughput detection of mutations responsible for childhood hearing loss using resequencing microarrays. BMC Biotechnol 10:10
Krawitz P, Rodelsperger C, Jager M, Jostins L, Bauer S, Robinson PN (2010) Microindel detection in short-read sequence data. Bioinformatics 26:722–729
Lee B, Godfrey M, Vitale E, Hori H, Mattei MG, Sarfarazi M, Tsipouras P, Ramirez F, Hollister DW (1991a) Linkage of Marfan syndrome and a phenotypically related disorder to two different fibrillin genes. Nature 352:330–334
Lee B, Vitale E, Superti-Furga A, Steinmann B, Ramirez F (1991b) G to T transversion at position +5 of a splice donor site causes skipping of the preceding exon in the type III procollagen transcripts of a patient with Ehlers-Danlos syndrome type IV. J Biol Chem 266:5256–5259
Li H, Durbin R (2010) Fast and accurate long-read alignment with Burrows-Wheeler transform. Bioinformatics 26:589–595
Li H, Ruan J, Durbin R (2008) Mapping short DNA sequencing reads and calling variants using mapping quality scores. Genome Res 18:1851–1858
Li H, Handsaker B, Wysoker A, Fennell T, Ruan J, Homer N, Marth G, Abecasis G, Durbin R (2009) The Sequence Alignment/Map format and SAMtools. Bioinformatics 25:2078–2079
Loeys BL, Chen J, Neptune ER, Judge DP, Podowski M, Holm T, Meyers J, Leitch CC, Katsanis N, Sharifi N, Xu FL, Myers LA, Spevak PJ, Cameron DE, De Backer J, Hellemans J, Chen Y, Davis EC, Webb CL, Kress W, Coucke P, Rifkin DB, De Paepe AM, Dietz HC (2005) A syndrome of altered cardiovascular, craniofacial, neurocognitive and skeletal development caused by mutations in TGFBR1 or TGFBR2. Nat Genet 37:275–281
McDonnell AV, Jiang T, Keating AE, Berger B (2006) Paircoil2: improved prediction of coiled coils from sequence. Bioinformatics 22:356–358
Mizuguchi T, Collod-Beroud G, Akiyama T, Abifadel M, Harada N, Morisaki T, Allard D, Varret M, Claustres M, Morisaki H, Ihara M, Kinoshita A, Yoshiura K, Junien C, Kajii T, Jondeau G, Ohta T, Kishino T, Furukawa Y, Nakamura Y, Niikawa N, Boileau C, Matsumoto N (2004) Heterozygous TGFBR2 mutations in Marfan syndrome. Nat Genet 36:855–860
Ng SB, Bigham AW, Buckingham KJ, Hannibal MC, McMillin MJ, Gildersleeve HI, Beck AE, Tabor HK, Cooper GM, Mefford HC, Lee C, Turner EH, Smith JD, Rieder MJ, Yoshiura K, Matsumoto N, Ohta T, Niikawa N, Nickerson DA, Bamshad MJ, Shendure J (2010) Exome sequencing identifies MLL2 mutations as a cause of Kabuki syndrome. Nat Genet 42:790–793
Sakai H, Visser R, Ikegawa S, Ito E, Numabe H, Watanabe Y, Mikami H, Kondoh T, Kitoh H, Sugiyama R, Okamoto N, Ogata T, Fodde R, Mizuno S, Takamura K, Egashira M, Sasaki N, Watanabe S, Nishimaki S, Takada F, Nagai T, Okada Y, Aoka Y, Yasuda K, Iwasa M, Kogaki S, Harada N, Mizuguchi T, Matsumoto N (2006) Comprehensive genetic analysis of relevant four genes in 49 patients with Marfan syndrome or Marfan-related phenotypes. Am J Med Genet A 140:1719–1725
Schroeder C, Stutzmann F, Weber BH, Riess O, Bonin M (2010) High-throughput resequencing in the diagnosis of BRCA1/2 mutations using oligonucleotide resequencing microarrays. Breast Cancer Res Treat 122:287–297
Superti-Furga A, Gugler E, Gitzelmann R, Steinmann B (1988) Ehlers-Danlos syndrome type IV: a multi-exon deletion in one of the two COL3A1 alleles affecting structure, stability, and processing of type III procollagen. J Biol Chem 263:6226–6232
Togashi Y, Sakoda H, Nishimura A, Matsumoto N, Hiraoka H, Matsuzawa Y (2007) A Japanese family of typical Loeys-Dietz syndrome with a TGFBR2 mutation. Intern Med 46:1995–2000
Tsurusaki Y, Osaka H, Hamanoue H, Shimbo H, Tsuji M, Doi H, Saitsu H, Matsumoto N, Miyake N (2011) Rapid detection of a mutation causing X-linked leucoencephalopathy by exome sequencing. J Med Genet 48(9):606–609
Wang L, Guo DC, Cao J, Gong L, Kamm KE, Regalado E, Li L, Shete S, He WQ, Zhu MS, Offermanns S, Gilchrist D, Elefteriades J, Stull JT, Milewicz DM (2010) Mutations in myosin light chain kinase cause familial aortic dissections. Am J Hum Genet 87:701–707
Zhu L, Vranckx R, Khau Van Kien P, Lalande A, Boisset N, Mathieu F, Wegman M, Glancy L, Gasc JM, Brunotte F, Bruneval P, Wolf JE, Michel JB, Jeunemaitre X (2006) Mutations in myosin heavy chain 11 cause a syndrome associating thoracic aortic aneurysm/aortic dissection and patent ductus arteriosus. Nat Genet 38:343–349
Zimmerman RS, Cox S, Lakdawala NK, Cirino A, Mancini-DiNardo D, Clark E, Leon A, Duffy E, White E, Baxter S, Alaamery M, Farwell L, Weiss S, Seidman CE, Seidman JG, Ho CY, Rehm HL, Funke BH (2010) A novel custom resequencing array for dilated cardiomyopathy. Genet Med 12:268–278
Acknowledgments
The authors would like to thank the patients for their participation in this study. This work was supported by research grants from the Ministry of Health, Labour and Welfare (N. Matsumoto), the Japanese Science and Technology Agency (N. Matsumoto), the Takeda Science Foundation (N. Matsumoto), the Japanese Prize Foundation (T. Mizuguchi) and a Grant-in-Aid for Scientific Research from the Japanese Society for the Promotion of Science (N. Matsumoto).
Author information
Authors and Affiliations
Corresponding author
Electronic supplementary material
Below is the link to the electronic supplementary material.
Rights and permissions
About this article
Cite this article
Sakai, H., Suzuki, S., Mizuguchi, T. et al. Rapid detection of gene mutations responsible for non-syndromic aortic aneurysm and dissection using two different methods: resequencing microarray technology and next-generation sequencing. Hum Genet 131, 591–599 (2012). https://doi.org/10.1007/s00439-011-1105-7
Received:
Accepted:
Published:
Issue Date:
DOI: https://doi.org/10.1007/s00439-011-1105-7