
Abstract
In this paper, we present a robust 2-D self-potential (SP) inversion algorithm that has proven to be suitable for both environmental and hydrogeological applications. The work proposed here continues from the recent advances in theoretical and experimental aspects of the self-potential method by detecting the depth and the shape of shallow electrical current density sources using the least square subspace preconditioned (LSQR) method to compute (an approximation to) the standard-form Tikhonov solution. The preconditioner is based on the subspace defined by the columns of the Kernel matrix and the method adopted for choosing the fixed value of the regularization parameter is the generalized cross-validation. The decrease of resolution, due to the fact that the self-potential field decays quickly with the distance, is controlled by a depth weighting matrix. A laboratory experimental setup has been assembled for locating two buried ferro-metallic bodies of any size at different depths using the inversion of self-potential signals associated with the redox process. The inverse problem is solved by accounting for the electrical conductivity distribution and the self-potential data in order to recover the source current density vector field. Both synthetic and real simulations, performed on a sand model with anomalies included, provide low-error inverted models whereas anomalies are well-detected for position and shape. The inversion algorithm has been also applied to a field data set collected in the San Vittorino Plain, located in Central Italy, in order to identify the location of sinkholes and investigate the effects of different resistivity structure assumptions on the streaming potential inversion results.
1 Introduction
The self-potential technique involves the passive measurement of the electrical potential distribution at the Earth’s surface acquired by non-polarizable electrodes. SP anomalies are associated with charge polarisation mechanisms occurring at depth. The two main mechanisms are (1) the streaming potential due to electrokinetic coupling (Birch 1998; Fournier 1989) and (2) the “electro-redox” effect associated with redox potential gradients (Corry 1985; Naudet et al. 2004; Naudet and Revil 2005). These mechanisms are related to chemical potential gradients of charges carriers creating polarization in the porous media.
Since the first measurements of self-potential in the 19th century, the method has been applied for mineral exploration, oil well logging and geothermal exploration. Early research for explaining all driving forces that give rise an SP response can be attributed to Marshall and Madden (1959), Sato and Mooney (1960) and Nourbehecht (1963). Historically, the self-potential method has been mainly used in qualitative analysis of the measured data. However, in the last decades, many researches have given a more quantitative interpretation of SP anomalies for hydrogeological, environmental and engineering applications.
Several graphical and numerical methods have been developed to interpret SP anomalies including curve matching (De Witte 1948; Meiser 1962), characteristic points, parametric curve (Paul 1965), derivative and gradient analysis (Abdelrahman et al. 1998) and Fourier analysis techniques (Rao et al. 1982). Assuming a simple geometry for the sources requires a prior knowledge of the shape of the anomalous body and most of these methods use few characteristic points and distances, nomograms, or standardised curves to determine the depth. Thus, they are highly subjective and can lead to major errors in interpreting the self-potential anomalies of horizontal and vertical cylinders, spheres, sheets and geological contacts. Methods using derivative analysis and gradients (Abdelrahman et al. 2003) and Fourier analysis are instead influenced by noise in measured data and can lead to serious errors.
Other methods are based on the continuous wavelet transform (CWT), which allows the characterization of discontinuities or abrupt changes in the measured signal and a quick analysis of potential field data (Fedi et al. 2010). Gibert and Sailhac (2008) noted, however, that the CWT is not simply related to the source distribution, so it cannot be easily used as an imaging method.
Recently, inverse algorithms based on optimization techniques have proven to be very useful to invert self-potential signals (Jardani et al. 2006, 2007; Minsley et al. 2007). Like for any potential field approach (e.g. gravity and magnetism), the self-potential inversion is an ill-posed and generally under-determined problem, which is addressed by introducing model regularization. Furthermore, the self-potential problem is known to be non-unique (Pascual-Marqui et al. 2002). In other words, an infinite number of source configurations can produce the same measured self-potential field. Therefore, it is important to add constraints or priori information regarding the number of sources or the spatial extension of the electrical distribution to reduce the parameter space of the solution. This explains the emerging interest in the combined use of geophysical (non-invasive) prospecting methods. In addition to the non-uniqueness associated with the source distribution, the inverted current density distribution depends on to the knowledge of the resistivity distribution. It follows that a reconstruction of the source current density can be biased because of the poor knowledge of the electrical resistivity distribution, which can be derived independently by DC resistivity tomography or electromagnetic methods.
The aim of this work was to explore a more robust regularization-based solution through the application of subspace preconditioned LSQR (SP-LSQR) (Paige and Saunders 1982) to the inversion of the electrical potential measurements and the reconstruction of the distribution of the source current density field. In this sense, we present a Matlab© algorithm suitable for laboratory and field investigations, because of its high flexibility and reliability now reached by forward and inversion routines, with the primary aim of extending the approach to engineering and environmental applications.
2 Forward Modelling
The electrical potential is a solution of the following elliptic (Poisson-type) equation with a source term s corresponding to the divergence of the source current density in a conductive medium (Stoll et al. 1995; Bigalke and Grabner 1997):
where \(\sigma\) is the electrical conductivity (Sm\(^{-1}\)), \(\Psi\) is the electric potential (V), \(\mathbf {J}_s\) (Am\(^{-2}\)) is the source or driving current density occurring in the conductive medium and s denotes the volumetric current density (Am\(^{-3}\)). This latter parameter can be written as (Bolève et al. 2007; Castermant et al. 2008):
where Eq. (2a) is valid if self-potential signals are associated with groundwater flow and Eq. (2b) for electro-redox potentials; \(Q_v\) is the excess of charge (of the diffuse layer) per unit pore volume (\(\hbox {Cm}^{-3}\)), \(\mathbf {u}\) is the seepage velocity (\(\hbox {ms}^{-1}\)) and \(E_H\) is the redox potential (V).
Hence, the self-potential forward problem consists of calculating \(\Psi\) from Eq. (1), given s and \(\sigma\). Using the Green’s method of integration, the electrical potential distribution is written as (Patella 1997):
where \(x=MP\) is the distance from the source, located at position M, to the self-potential station at position P, \(\Omega\) represents the conducting subsurface, dV is the infinitesimal volume element of the conductive medium and \(\uprho\) is the resistivity function that characterizes the inhomogeneous and isotropic subsurface volume \(\Omega\). The first term of the right-hand side of Eq. (3) corresponds to the primary source term while the second term corresponds to secondary sources associated with heterogeneities in the distribution of the electrical resistivity in the medium. It is also possible to rewrite Eq. (3) as the following convolution product, according to Jardani et al. (2008):
where \(\mathbf {K}(P,M)\) denotes a linear mapping function referred to as the Kernel. The elements of the Kernel are the Green’s functions \(\mathbf {K}(P,M)\) connecting the self-potential data at a set of measurement stations P located at the ground surface (possibly in boreholes) and the sources of current density at a set of source points M located in the conducting ground \(:\Psi (P) = \mathbf {K}(P,M)\cdot \mathbf {J_s}(M)\). We consider a collection of m elementary sources (in two dimensions (x,z), there are 2m components of the current density to retrieve) and n observation stations P. Each element of \(\mathbf {K}\) is (Jardani et al. 2008):
To determine the elements of the Kernel, we consider that each elementary cell used to discretize the system has a uniform electrical resistivity and each elementary current density can be written as \(\mathbf {J_s}(M)=\mathbf {m}\delta (M)\) where \(\mathbf {m}\) is the dipole moment, \(\delta (\mathbf {r})\) is the Dirac function, and M is the position of the elementary source. For all these elementary dipoles, we solve the Poisson equation. The Kernel \(\mathbf {K}\) depends on the number of measurement stations at the ground surface, the number of discretized elements in which the source current density is going to be determined, and the resistivity distribution.
To solve Eq. (1), subjected to mixed boundary conditions, a numerical approach based on the Galërkin formulation of the finite-element method (Bastos and Sadowski 2003) was employed. A Neumann boundary condition is usually specified at the air-earth interface, such that \(\mathbf {n}\cdot \sigma \nabla \Psi = 0\). Within the earth, a Dirichlet boundary condition requires that \(\Psi \rightarrow\) 0 as the distance from the sources becomes large (\(r\rightarrow \infty\)).
The modelling method is a three-step process. First, the diffusion equation (Bear 2013) is solved with appropriate (Neuman or Dirichlet) boundary conditions for the pressure or groundwater flow. Then, the current source density is calculated on the basis of previously obtained hydraulic and/or redox gradient distribution (\(\mathbf {J_s} = Q_v\mathbf {u}\) and/or \(\mathbf {J_s} = -\sigma \nabla E_H\)). Finally, the SP signals are computed by solving Eq. (1) with appropriate boundary conditions on the electrical potential (Fig. 1). An interactive interface was developed to call all the functions in order to add geometry, mesh, physics settings, boundary conditions, solvers, post-processing and visualizations. During code execution, the procedure first loads the mesh, which is created in Netgen©, an adaptive mesh generator able to retain an accurate forward solution without drastically increase the number of elements, a huge problem using standard machines with limited local memories (for further details sourceforge.net/projects/netgen-mesher). Next, the designed algorithm requires a priori information in terms of hydraulic and electrical conductivities. Then, the solver is executed for the hydraulic and the electrical problem. Furthermore, it permits to arbitrarily include equations that may describe a material property, boundary, source or sink term, or even a unique set of partial differential equations.

Heart of the finite element method: local, global stiffness and mass matrices and right hand side are all computed by the function FEMstatic.m whether we use stationary simulations [after (Oliveti and Cardarelli 2017)]
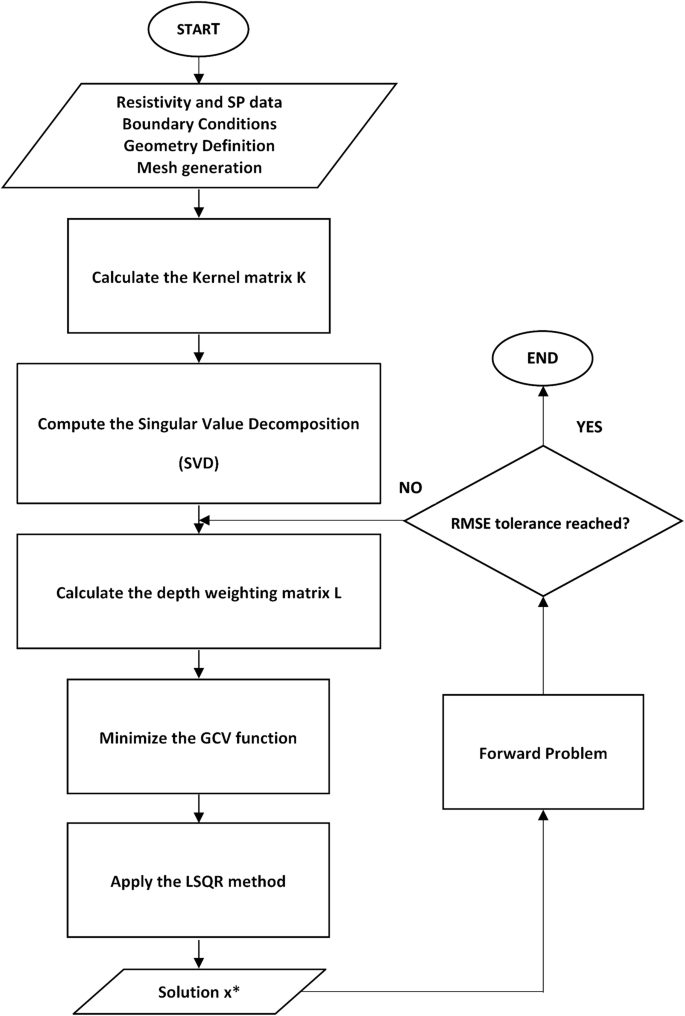
Flowchart of the inverse algorithm for searching the best source current density model
3 LSQR Method
Our goal is to provide a methodology for the inversion of self-potential data to determine the spatial distribution of the amplitude and direction of the source current density vector. For this purpose, a numerical environment in Matlab© was created, able to load, save and control geophysical data and to solve SP forward and inverse problems. In particular, a large-scale iterative least-squares QR factorization (LSQR) approach for computing solutions to the Tikhonov regularization problem (Tikhonov and Arsenin 1977) was employed. This work focuses on an efficient implementation of an iterative algorithm developed by Jacobsen et al. (2003), who discussed a ‘two-level method’ for the solution of the Tikhonov problem. According to this methodology, the two levels are created by a splitting of the solution space \(\mathbb {R}^n\) into two subspaces \(\mathcal {V}\) and \(\mathcal {W}\) of dimensions k and \(n - k\), respectively. The residual is projected into the small dimensional subspace \(\mathcal {V}\) (the coarse grid) in which the problem is solved with a direct method, while the component of the solution in the remaining subspace \(\mathcal {W}\) is computed by an iterative algorithm. The algorithm is based on the least squares formulation:
where \(\varvec{V}\in \mathbb {R}^{n\times k}\) and \(\varvec{W}\in \mathbb {R}^{n\times (n-k)}\) are the matrices whose columns span the subspaces \(\mathcal {V}\) and \(\mathcal {W}\) with basis vectors \(\mathbf {v}\) and \(\mathbf {w}\), respectively while the “stacked” matrix and vector represent:
where \(\lambda\) is the regularization parameter, \(\mathbf {L}\) is the depth weighting matrix and \(\mathbf {y}\) is the self-potential data vector. The subspace \(\mathcal {V}\) consists of the principal k right singular vectors in the SVD of the matrix \(\mathbf {K}\).
Introducing the QR factorization:
with \(\mathbf {Q}= \begin{bmatrix} \mathbf {Y}&\mathbf {Z} \end{bmatrix}\) orthogonal and \(\mathbf {R}\) upper triangular. The source current density is obtained in the form:
with \(\mathbf {w} = \text {argmin} \Vert \mathbf {Z}^T \mathbf {\widehat{K}}\mathbf {W}\mathbf {w} - \mathbf {Z}^T\mathbf {\widehat{y}}\Vert _2^2\) and \(\mathbf {Rv} = \mathbf {Y}^T (\mathbf {\widehat{y}} - \mathbf {\widehat{K}}\mathbf {W}\mathbf {w})\).
The regularization parameter \(\lambda\) is chosen according to the generalized cross-validation (GCV) method (Wahba 1990), known for its efficiency and robustness. GCV intends to balance the data error and the regularization error by means of the global minimization of the generalized cross-validation function. Numerator and denominator of generalized cross-validation criteria can be regarded as representing the variance of the estimated observation error, and the bias resulting from the regularization term, respectively.
The depth-weighting matrix in Eq. (7), introduced for reducing the loss of depth resolution, is expressed as (Li and Oldenburg 1998):
where \(\mathbf {L}\) is the depth weighting (\(N\times 2M\)) matrix designed to provide cells at distinct depths similar probabilities of obtaining non-zero values during the inversion, h is the height of data points and the parameter \(\upbeta\) is referred to Structural Index or Attenuation Rate. The \(\upbeta\) exponent plays a critical role to correctly estimate the depth to the causative body and it depends on the different geometric types of sources that give rise to different decays of their field (Cella and Fedi 2012; Abbas and Fedi 2015). Despite it should be 2 because the used sources can be approximated to dipoles (Fedi and Abbas 2013), in the presented study we determined its value by trial and error from the best fit between the reconstruction of source current density distribution and the known location and shape of the ferro-metallic bodies.
4 Proposed Algorithm
The whole geophysical process (data processing, forward modelling and inversion) has been included through an interactive Matlab© algorithm. It models the medium under investigation using a simplex-based finite element representation, and reconstructs images using regularized inverse techniques. It is a two-dimensional code which allows to solve forward and inverse problems for electrical potential equation. It gives also the possibility to couple groundwater equation with electrical potential equation. Simulations can be run in transient and stationary modes and performed on heterogeneous domains with SP anomalies included, providing low-error inverted models whereas sources are well-detected both for shape and position. The main steps illustrated in Fig. 2 can be summarized as follows:
-
a deterministic and local approach, which consists of inverting for the source current density distribution using the linear formulation of the forward problem and the modified singular value decomposition, is applied (Sect. 2);
-
the decrease of resolution, due to the fact that the self-potential field decays quickly with the distance, is controlled by the depth weighting matrix (Eq. 10);
-
the GCV method is adopted for choosing the regularization parameter;
-
the inversion process is based on the subspace preconditioned LSQR algorithm to compute (an approximation to) the standard form Tikhonov solution for a fixed value of the regularization parameter (Sect. 3).
-
when the solution \(\mathbf {x}^*\) in Eq. (9) is obtained, the forward problem is solved together with the RMSE absolute value. Then, when necessary, the model \(\mathbf {x}^*\) is updated to compute new SP distribution until the desired RMSE tolerance criterion, depending on the nature of the problem under investigation, is fulfilled.
To estimate the goodness of the model, the associated Root Mean Square Error (RMSE) is defined as follows:
The algorithm consists of four primary subfolders:
-
Meshing: contains functions for generating geometry and meshes.
-
Finite Element Formulation: contains all functions necessary for implementing the finite elements method.
-
Inversion: contains inversion and regularization functions.
-
Graphical Output: contains post-processing functions which permit to visualize results.
Separating all the functions in different folders depending on their functionality makes the code cleaner and easier to understand and modify.
The main of the algorithm is divided in sections, where the operator can act to change:
-
Creating Geometry and Mesh: this step is performed by Netgen code. Read a mesh file or Make a new mesh for 2D geometries: MakeMesh permits to build an adaptive mesh by Netgen. ReadMesh is able to read a .mat file generated by MakeMesh or a .vol file generated by Netgen.
-
Fixing Boundary Conditions: the algorithm uses SetBoundary for defining boundary conditions. Suppose you want to solve your problem and apply non homogeneous Dirichlet boundary conditions on top and bottom boundaries and non homogeneous Neuman boundary conditions on remaining borders. You can define your borders as follows :
bdFlag = SetBoundary (node,elem,’Dirichlet’,’(y==ymax) | (y==ymin)’,... ’Neumann’,’(x==xmin) | (x==xmax)’)
where \(\textit{node}\) is a 2 column vector containing all nodes coordinates and \(\textit{elem}\) is a 3 column vector containing for each triangle the node numbers of the vertices. After defining your boundaries you create vectors containing values you want to affect to those boundaries. For example, if we want to impose Dirichlet boundary conditions with values zero, we do as follows :
function DirichletBoundaryValue = dc(x)
DirichletBoundaryValue = zeros(size(x,1),1)
where \(\textit{dc}\) denotes the data on the Dirichlet boundary and \(\textit{y = dc(x)}\) returns function values at N discrete points on the Dirichlet boundary. This input data has to be choosen by the user. x has dimension \(N \times 2\) and y has dimension \(N \times 1\).
-
Assembling Stiffness, Mass matrices, Right Hand Side and Solving Linear System of the Problem: Local, global Stiffness and Mass matrices and right-hand side are all computed by FEMstatic function whether we use stationary simulations (Fig. 1) This function returns the solution of the problem and the Stiffness/Mass matrices. Code syntax is used as follows:
[A,b,u] = FEMstatic(Q,node,elem,Dirichlet,Neumann,S)
Inputs:
-
\(\text{Q: sink source;}\)
-
\(\text{node: node coordinates;}\)
-
\(\text{elem: mesh connectivities;}\)
-
\(\text{Dirichlet, Neumann: boundary edges;}\)
-
\(\text{S: material properties}\)
-
\(\text{in the case of ground water flow, it is the hydraulic conductivity}\),
-
\(\text{in the case of electrical potential, it is the electrical conductivity;}\)
-
Outputs:
-
\(\text{u: solution of the problem;}\)
-
\(\text{A: Stiffness matrix;}\)
-
\(\text{b: right-hand side;}\)
-
-
Inverse Problem: The inverse problem consists to recover the horizontal and vertical components of the source current density. It can be done with the function:
x = invlsqr(K,L,y,lambda,V,max,stop); Inputs:
-
\(\text{K: Kernel matrix;}\)
-
\(\text{L: depth weighting matrix;}\)
-
\(\text{y: vector of observed data;}\)
-
\(\text{lambda: regularization parameter;}\)
-
\(\text{V: principal right singular vectors of K;}\)
Output:
-
\(\text{x: solution of the problem;}\)
The function \(\textit{invlsqr}\) implements the subspace preconditioned LSQR algorithm to compute (an approximation to) the standard-form Tikhonov solution \(\textit{x}\) for a fixed value of the regularization parameter \(\lambda\). The preconditioner is based on the subspace defined by the columns of the matrix V whose columns should be “smooth” and preferably chosen such that a significant component of the exact solution lies in the range of V. The parameter \(\textit{max}\) is the maximum allowed number of iterations (default value is maxit \(= 300\)). The parameter \(\textit{stop}\) is used a stopping criterion for the norm of the least squares residual relative to the norm of the right-hand side (default value is tol \(= 1e^{-12}\)). The output holds all the solution iterates as columns, and the last iterate \(\textit{x(:,end)}\) is the best approximation.
Another important step in the inversion process is the choice of the regularization parameter. It is calculated using the function named RegularizationParameter adopting the GCV method.
For example, suppose we want to compute the regularization parameter with the GCV method, we do like this:
lambda = Regularization Parameter(’GCV’,’TIKHONOV’); 200 logarithmically distributed regularization parameters are generated, and GCV function is plotted for these values. Then the minimizer of the GCV function is computed via \(\textit{fmin}\).
-
5 Synthetic Example
The efficiency of the algorithm based on LSQR approach was firstly tested by a numerical simulation model. The source used for synthetic example is a vertical iron bar with a height of 7 cm and a width of 3.5 cm, located at a depth of 4 cm to the top (Fig. 3a). The finite-element mesh is made of rectangles (64\(\times\)32 cells). The electrical conductivity was assigned as shown in Fig. 3b in order to simulate the vadose and the phreatic zones. Self-potential signals obtained by solving the forward problem (Fig. 3c) were contaminated by a zero-mean Gaussian noise having a standard deviation of 2 \(\%\). The inverse problem was solved choosing different values for the depth-weighting exponent \(\upbeta\) (integers between 0 and 3). The best depth estimates occurred for \(\upbeta\) = 3. The inverse solution, shown in Fig. 3d, recovers reasonably well the shape and the position of the principal source as well as its amplitude. The RMSE value results in 3\(\%\), close to the noise level added, underlining the reliability of the inverse method.

Synthetic example. a True source current density. b Distribution of the electrical conductivity. c The self-potential signal calculated at the surface of the model (\(z=20 \hbox {cm}\)). d Result of the inversion using LSQR algorithm

Sketch of the experimental setup showing the location of depth SP data points (upper right) and the position of surface data points (lower right) for the actual experiment, the iron bar installed during placement of sand (upper left) and patterns of ferric staining of pore fluid and sand below the phreatic surface at the conclusion of the study (lower left)
6 Laboratory Experiment
A controlled experiment, inspired by the works of Castermant et al. (2008) and Rittgers et al. (2013), was designed to apply the inversion algorithm presented here in an effort to recover the 2D vector distribution of source current throughout a tank for two purposes:
-
localizing nonintrusively active corrosion processes at an intermediate scale, between the core sample and field scales;
-
detecting the major causative sources of observed electrical disturbances of any size at different depths.
An electrochemical system was developed to facilitate corrosion of iron bodies inserted in calibrated sand infiltrated by water. The iron objects served to transmit electrons between the electron donor and oxygen used as the terminal electron acceptor. The first step in corroding iron consists in its oxidation to ferrous ions according to \(F_e \rightarrow F_e^{+2} + 2e^{-}\) in the lower part of the metallic body. Then, \(F_e(II)\) ions are further oxized to form ferric ions (\(F_e(III)\)) according to \(F_e^{+2} \rightarrow F_e^{+3} + 1e^{-}\). In this latter oxidation reaction, the formation of a green rust called fougerite, which may occur away from the erosion, is an intermediate step.Therefore, the elctrons flow in the iron piece providing the source current density \(\mathbf {J}_s\). These electrons are used to reduce oxygen according to \(1/4 O_2 + 1/2 H_2O + e^{-} \rightarrow OH^{-}\) at the bottom of the iron bar. Consequently the redox reaction for iron is \(F_e + 3/4 O_2 + 1/2 H_2O \rightarrow F_eOOH\). This sequence of redox reactions is responsable for:
-
a perturbation of the distribution of the redox potential in the vicinity of the iron bar: the redox potential can reach hundreds of millivolts close to the top surface of the tank (because of the effect of the oxygen) and is close to 0 mV or strongly negative around the metallic object as it corrode . This indicates reduced conditions close to the iron object;
-
a vertical gradient in the redox potential at distance from the iron bar: the far field contribution can vary mainly with depth and range from hundreds of mV at the top surface of the tank to \(-\,50\) mV at the bottom. This feature implies an abrupt change from oxidizing to reducing conditions. It is likely that the chemical reactions at the surface of the iron bar consumed the dissolved oxygen of the pore solution and make its diffusion slower;
-
a depletion in the concentration of oxygen inside the tank;
-
a dipolar anomaly in the vicinity of the metallic object, negative above the metallic pipe and positive below it;
-
a basic pH front diffusing inside the tank. The positive or basic pH anomaly developed near the top of the vertical pipe suggests that the reduction processes at the surface of the upper half of the vertical pipe helps to produce \(OH^{-}\) ions in solution above the phreatic surface. As the metallic body corrode, the pH increases above it;
-
the formation of a crust on the surface of the bar, probably responsible for an increase of the resistivity at the surface of the iron bar.
The self-potential signals were measured at the surface (at different time lapses) and inside the tank on a regular grid at the end of the experiment. Also electrical conductivity distribution within the tank was determined because it is required in the formulation of the kernel matrix used for localization, so as to represent a more realistic scenario in application. This type of experiment is extremely complementary to field measurements, allowing to test the physics of these problems, and providing relative orders of magnitude for the material properties. In this sense, the occurrence of a self-potential dipolar anomaly and the role of the electrical resistivity distribution are the major issues to be addressed.
6.1 Material and Methods
The laboratory experiment was conducted in the Plexiglas cylinder adopted by De Donno (2013) for acquisition of frequency-domain electrical tomography data. The tank having a height of 25 cm and a diameter of 50 cm was filled with silica sand to depth of 20 cm by taking care to avoid air entrapment (Fig. 4). The material properties of the sand are described in Table 1. The sand was added in uniform, submerged layers to a standing water column. Each newly added layer was sprinkled over the surface of the standing water and allowed to settle out of suspension before it was combed and tamped to remove cavities and air bubbles and mixed uniformly with the underlying sand. This study was carried out during two phases called experiments 1 and 2, each over the course of about two months. Experiment 1 was performed from early to late winter of 2016 as a proof of concept, where a vertical metallic body consisting of a rectangular piece of iron with a thickness of 2.5 cm and a height of 11 cm was centered at the phreatic surface (Fig. 3). Experiment 2 was carried out with the same setup and procedure during the summer of 2017, where a 9.5-cm-diameter iron sphere was buried and centered through and in the capillary fringe within the tank (Fig. 5). In both experiments the phreatic surface was maintained constant by adding small amounts of water to the base of the tank through a vertical plastic tube installed prior to filling with sand. A hood filter-paper was inserted inside the tank upon the phreatic surface for reducing evaporation. A total of 49 holes were drilled through a Plexiglas plate every 5 cm in an 77 grid and used as a template for electrode placement and manual insertion at five elevations. Because the SP electrodes were not permanently installed throughout the tank, this plate was fitted to the tank to allow for accurate repopulation of the data collection grid for the duration of the study.

Cross section of the cylinder showing the elevation of the established phreatic surface and the metallic body buried in the capillary fringe

Photos showing the Ag/AgCl non-polarizing electrodes and the high-impedance voltmeter during the SP data acquisition along the cross section
Both experiments began by first taking measurements at the surface of the tank at the 49 positions indicated in Fig. 4b and then collecting data along the cross section shown in Fig. 4a to further explore the nature of the SP signals, once significant surface anomalies were observed to develop. These data were manually collected throughout the tank at 4-cm-depth intervals from 0- to 20-cm depth, resulting in a total of 53 measurements at the end of experiment. These latter were performed with Ag/AgCl non-polarizing electrodes (pellet electrodes with a diameter of 2 mm, a length of 4 mm and a exposed wire of 70 mm) and a calibrated voltmeter (ABEM Terrameter SAS300 resistivity meter with a sensitivity of \(1\mu \hbox {V}\) and an internal impedance of 10 \(\hbox {M}\Omega\)). These micro Ag/AgCl electrodes were adopted by inserting their wires into a 1-cm-diameter flexible plastic tube (to minimize the invasiveness of the depth measurements) and threading them with banana plugs. To avoid damage and insertion trauma, electrodes were placed into a thin plastic cover and then used to manually probe the sand at depth throughout the tank with minimal introduction of oxygen to the system (Fig. 6).
The reference electrode for the self-potential measurements should be ideally placed at infinity, where the potential is assumed to be zero. The reference electrode was collocated at the upper side of the tank to be far from the perturbed zone, approximately 2 cm below the surface of the sand (Fig. 4b). Bulk electrical-conductivity distribution in the tank was determined by performing a 2D resistivity tomography using Syscal-Pro resistivimeter (IRIS Instruments) with 10 channels and a dipole-dipole array. The maximum “a” and “n” value used are 5 and 6, respectively. Data were collected utilizing 17 gold electrodes along a single midline with electrodes spaced 2.5-cm apart (Fig. 7).

Photos showing the gold electrodes and the Syscal-Pro resistivimeter during the resistivity data acquisition along the central profile of the measuring grid

Self-potential data processing. a Three steps to obtain correction of raw SP data. b Configuration of the sandbox used in the preliminary test with the position of the electrodes

Sequence of 2D SP data (plan-view) collected on the surface of the sand in experiment 1. Redox processes resulted in the development of a − 45 mV anomaly in 2 months. Black crosses indicate positions of the self-potential stations
Electrical resistivity tomography (ERT) dataset were inverted with the VEMI algorithm - Versatile interface for Electrical Modelling and Inversion-, built within the EIDORS environment (Adler and Lionheart 2006). This algorithm is able to perform both 2D and 3D inversion, by solving the forward problem with a finite-element approximation of the Poisson equation governing the physical problem while inversion is carried out using a Gauss–Newton formulation (De Donno 2013; De Donno and Cardarelli 2014, 2017). The code incorporates the electrode size (penetration depth for rods and plate length for surface electrodes) within the forward modelling. It is also possible to add a priori information to the inversion process. In this particular case, for all the boundaries, Neumann-type boundary conditions were assumed.

Development of a − 60 mV anomaly in less than two months during experiment 2. Black crosses indicate positions of the self-potential stations

2D vertical cross sections of SP data collected at the end of experiments. a A relatively large dipolar perturbation in the electrical potential field can be seen to have developed along the vertical iron bar. b Self-potential signals produced by the metallic sphere exhibits a clear dipolar distribution with a negative pole located near the surface of the tank and a positive pole located at depth

2D resistivity tomography. The resistivity ranges from 200 \(\Omega\)m in the saturated portion of the tank (and in the capillary fringe) to nearly 3500 \(\Omega\)m close to the top surface of the tank
6.2 Results
Self-potential measurements were performed for several weeks at the top surface of the tank. The collected self-potential data were corrected as illustrated in Fig. 8 and gridded by kriging with a linear variogram model. Before introducing the metallic objects into the tank, monitoring was conducted with Ag/AgCl electrodes inserted into the silica sand at 49 locations. The average value of these preliminary measurements was assumed as back- ground noise and subtracted from all the actual SP signals associated with the redox potential gradient. In addition, during the actual experiment the electrode drift was checked after each survey and removed from the raw data. The drift was calculated as the difference between the tip-to-tip potential recorded between the reference and a working electrode before and after each 2D surface data set. This difference was then divided by the total number of measurements. After these steps, the measurement performed in position 1 of Fig. 8 was subtracted from all the data to reallocate the first data to zero (reference point). The first electrode is used as a common reference for each profile and over time.
Figure 9 shows the progressive development of the negative SP anomaly located above the vertical bar during experiment 1.
Figure 10 shows the surface self-potential maps for the experiment 2, indicating corrosion of the iron sphere during the monitoring period.
On the 6th and 8th week of two experiments, respectively for the bar and the sphere, the negative surface anomaly, indicating a flux of electrons through the metallic bodies, was deemed to have reached a steady-state condition. At this step, SP data were collected at different depths on the 2D vertical midsection as shown in Fig. 11a, b. The polarity of the anomaly agrees with field observations (Sato and Mooney 1960) and the amplitude is similar to those reported in the laboratory by Rittgers et al. (2013). The self-potential distribution has a dipolar character, with a positive anomaly located in the bottom part of the metallic objects and a negative anomaly located in the vicinity of their top part.
Figure 12 illustrates the results of 2D inversion of surface electrical-resistivity measurements. Resistivity varies from 200 \(\Omega \hbox {m}\) in the saturated portion of the tank to 3500 \(\Omega \hbox {m}\) close to the surface of the tank. Note the vertical and horizontal gradients in this field, resulting from the vertical variations in water saturation and subhorizontal variations in pore fluid conductivity likely due to varying ferric ion species concentrations. Since the parameter did not vary significantly between the two experiments as to alter the redox kinetics between the two tests, it is assumed the same resistivity model for the experiment 2.

Picture showing the almost totally clean surface of the bar after a week (upper) and the presence of lepidocrocite at the end of the experiment (lower)

Inversion results showing magnitude of the current density distribution \(\mathbf {J}_s\) for the iron bar (a) and the sphere (b) for \(\upbeta = 3\)

Inversion results showing magnitude of the current density distribution \(\mathbf {J}_s\) for the iron bar (a) and the sphere (b) for \(\upbeta = 2\)
After the two experiments, the objects were removed from the tank and evidence of corrosion was observed on their surfaces (Fig. 13). It was possible to notice that the colour of the sand in the vicinity of the iron bar turns into a blue-greenish colour over time. If the sand is exposed to air, this colour turns to ochre.
The resistivity model and potential data at depth were used as input in the inversion for \(\mathbf {J_s}\) to localize the causative source bodies. In the first step, the kernel computation accounted for the electrical resistivity distribution (Fig. 12) and for the insulating boundary conditions applied to the system and governed by the tank walls. In the second one, the reconstruction of the electric source current density required self-potential data along the cross-section perpendicular to the tank (Fig. 11a, b). Figure 14a, b illustrate 2D inversion results, where the magnitude of the recovered source current density distribution is calculated using the recovered 2D vector field of source current density distribution. The development of a SP anomaly associated with the corrosion rate of the metallic objects is clear. Using the GCV approach to selecting an appropriate regularization term and imposing weighted smoothness constraints on depth as described in Sect. 3, the inversion for the iron bar returns a predominantly vertical current density that is elongated in the z-direction (Fig. 14a), which means a single dominant vertical dipole extending from top to bottom of the body. Regarding the second experiment, although the shape of the metallic sphere is not perfectly reconstructed, the amplitude source current distribution reveals indication of its position (Fig. 14b). In fact, the vertical EH gradient stronger than the horizontal one, in combination with a lower water saturation in the upper region of the tank, resulted in a more spatially extensive and larger amplitude SP anomaly and a vertically elongated current density. The coordinate discrepancy could mainly due to the spatial refinement of the kernel matrix and resultant model parameterization spacing used for this study. Additional constraints such as object’s location, size, and orientation would help to ensure that source currents in the recovered model were predominantly in the exact position but they were not applied to the inversion procedure so as to represent a more realistic scenario where the target object’s dimensions are unknown.

Aerial plan of the surveyed area and position of the ERT and SP line

Piping sinkhole phenomena near the area A [after (Cardarelli et al. 2014)]

a Inverted model of ERT line. b Inverted model of STR line [after (Cardarelli et al. 2014), modified]. Black arrow indicates the sinkhole marked as A. Black dashed lines indicate the shape of the anomalous zones
However, for both cases the results of the inversion were found to be in very good agreement with the measured distribution of the redox potential. There is very good comparison between the measured and recovered SP distribution in terms of trend with a negligible change in values (RMSE = 10 mV for experiment 1 and RMSE = 8 mV for experiment 2), demonstrating that this inversion process is useful in reconstruction of the source current density distribution at depth. It is worth to underline that the estimate of the shape and the position of the main sources is given higher priority than the reconstruction of their strength.
Note that the models are obtained by setting \(\upbeta =3\) and the results confirm that the causative source is recovered at its correct position (Fig. 14), while there is not a good agreement between the experimental and modelled locations for \(\upbeta =2\) (Fig. 15).
7 Field Survey: The San Vittorino Sinkhole Plain
Finally, in order to identify the location of sinkholes, the inversion algorithm was applied to a field data set collected in the San Vittorino Plain, located in Central Italy, along the Velino River Valley. The spatial distribution of sources provides useful information that can subsequently be interpreted in terms of physical processes that generate the SP data. The geological setting and details of the forward modelling has been presented by Oliveti and Cardarelli (2017).
The middle valley of the Velino River and the S. Vittorino Plain are the areas of discharge of important fractured carbonate aquifers belonging to the carbonate platform domain (Petitta 2009). The development of sinkholes in the study area is mainly due to deep suffusion and deep piping processes, linked to fluid upwelling along fracture-fault systems and to dissolution (by \(H_2S\) and \(CO_2\)) in the continental deposits (Centamore et al. 2009). The wide circulation of waters in this area, which includes the presence of the Peschiera Spring system with a relevant discharge rate of about 18 m\(^3\)s\(^{-1}\), emphasized the action of karst processes. In addition, the minimum depth to the water table in the alluvial-detrital deposits, the complex hydrodynamics of subsurface water discharge and the aggressiveness of waters in some sectors play a crucial role, in developing sinkholes.

Inversion results for the current distribution \(\mathbf {J}_s\). a Magnitude of the inverted two-dimensional streaming current source density accounting for the resistivity distribution shown on Fig. 15. b Distribution of the reconstructed self-potential signals

Comparison between the predicted self-potential signals (empty circles) and the self-potential data measured along profile (filled circles)
7.1 Data Acquistion
Cardarelli et al. (2014) employed self-potential method in combination with electrical and seismic tomography for detection of piping sinkholes in the San Vittorino Plain.
We focused only on the results of the ERT and SP surveys performed on the line illustrated in Fig. 16, where surface evidence of a piping sinkhole appeared with the formation of a small water pond (around 2.0 m diameter) after about one year from the geophysical measurements (Fig. 17). The goal was to verify that negative SP signals are associated with the position of this sinkhole (marked as “A” in Fig. 16).
ERT line was carried out using Iris Syscal Pro resistivity meter equipped with 48 electrodes (stainless steel stakes) spaced 2 m apart, depending on the target depth and the required resolution. ERT 2D pseudosection was inverted using the VERDI algorithm (Cardarelli and Fischanger 2006). The pole-dipole array was employed, as it combines consistent signal strength with good resolution and depth of investigation.
SP measurements were collected with Pb/PbCl2 non-polarizable electrodes and ABEM Terrameter SAS300 resistivity meter using a simple scheme for data acquisition with a reference (fixed) electrode and a moving one. The SP contribution of the main groundwater flow in the SW-NE direction towards the Velino River (Petitta 2009), which can be considered as linear on first approximation, was removed from the raw data in the x and y-directions, by a linear interpolation along both directions.
7.2 Inversion of Field Data
Because sinkholes are associated with self-potential and electrical conductivity anomalies, the inversion was performed with both field SP and ERT data for delineating the location of the piping sinkhole. In fact, the self-potential method is the only geophysical method that is sensitive to the flow of groundwater while the inversion of the resistivity data provides the distribution of electrical conductivity, which is sensitive to the water and clay contents of the shallow cover. On the other hand, also seismic refraction tomography (SRT) was very effective for locating the low-stiffness (poor-velocity) area which is associated with the effect of existing or previous piping phenomena.
The results of the ERT and SRT investigations are reported in Fig. 18. The shape of the anomaly “A” (marked by a black dashed line) corresponds to the conductive geometry in the ERT section in Fig. 18a. This anomaly is clearly U-shaped in the SRT section (Fig. 17b) but is not well resolved in depth by ERT, probably because of the effect of the water table, which is supposed to be at about 3–5 m depth, as indicated by seismic velocities above 1500 \(\hbox {ms}^{-1}\) . Anyway, the ERT and SRT anomalous areas confirms the geometrical reconstruction and identifies morphologies that suggest the presence of an incipient sinkhole.
The result of the application of the inversion algorithm to the self-potential anomaly observed at the top surface is shown in Fig. 19. The positions of the insulating boundary conditions and the reference electrode were used to determine the kernel. The solution depends on the value of the regularization parameter \(\lambda\) and a prior model. To determine the value of \(\lambda\) the GCV method was used while no a prior model was adopted. A depth-weighting matrix (see Sect. 3) was introduced to reduce the loss of depth resolution and to force the source to depth within the model space. The behavior of the kernel matrix with depth is influenced by the chosen norm. To overcome the problem ambiguity in case of underdetermined systems, one must incorporate additional constraints in the solution. In its simplest form, this leads to the computation of the minimum-length solution, which leads to shallow distributions of the sought property. On the other hand, the use of other weighted norms leads to a more general regularization problem of Tikhonov form. For instance, the use of a second derivative leads to smooth distributions of the property around the center of the solution domain (Fedi et al. 2005). The source (Fig. 19a) and the negative anomaly (Fig. 19b) are located in correspondence with the incipient sinkhole markes as A. Although the inversion of surface self-potential data tends to generate a shallower source current density distribution (Fig. 19a) because the sensibility of the self-potential field decays quickly with the depht, the proposed approach permits however highly precise localization of the sinkhole. Negative anomalies, associated with the percolation of water in the sinkhole, are of a few tens of millivolts as showed by Jardani et al. (2006). It is worth noting that there is also a minor anomaly likely associated with a shallow smaller sinkhole at x = 125 m. A comparison between the self-potential data measured at the ground surface and the self-potential values calculated from the inversion process along the same profile is shown in Fig. 20. It is possibile to see a good agreement between the model and the data (RMSE = 2 mV). This indicates clearly that self-potential signals can be used to observe remotely the pattern of groundwater flow (or changes in this pattern) and to detect the occurrence of sinkholes when the support volume of the source is small with respect to the distance between the position of the center of the source and the reference point. Therefore, the joint interpretation of ERT and SRT allowed to detect anomalies zone associated with the piping process, although only SP measurements could distinguish the presence of a water flow (active piping) at the time of measurement.
8 Conclusion
The aim of this work was to apply a inversion algorithm implemented in Matlab© in an effort to recover the 2D vector distribution of source current for two purposes: (1) to localize the major causative sources of observed electrical disturbances and (2) test the reliability of the algorithm. We explored thoroughly potential and limits of quantitative reconstruction of self-potential distribution for environmental and engineering applications, starting from the controlled laboratory conditions and ending with field investigations.
Thanks to the experimental apparatus which was adopted, we could simulate SP anomalies observed in the vicinity of buried metallic objects. Preliminary tests have highlighted the main problems due to saturation, electrode effects and sand performance. These preliminary measurements seem to be essential to ensure the generation of a large-amplitude SP response and to remove potential errors into recovered datasets. The physical model built up in the laboratory have demonstrated that, to produce SP signals associated with a redox potential gradient, an electronic conductor localized in the capillary fringe has to intercept an area of strong redox potential gradient. The generation of an electrical current in the metallic material is associated with the corrosion of the metallic material and the formation of a dipolar SP anomaly. This feature implies an abrupt change from oxidizing to reducing conditions. It is likely that the chemical reactions at the surface of the iron bodies consumes the dissolved oxygen of the pore solution and make its diffusion slower. The corrosion modifies the conductivity distribution (by forming a resistive crust on the surface of the metallic object) and the distribution of the redox potential in the vicinity of the metallic object.
Simulations with Gaussian noise, performed on a heterogeneous model with a synthetic anomaly included, provide low-error inverted models whereas sources are well-detected both for shape and position. The decrease of resolution, due to the fact that the self-potential field decays quickly with the distance, is controlled by the numerical procedure even though the amplitude response is not completely satisfactory whereas there is not an adaptive mesh. The adopted depth weighting of the kernel is aimed at reducing the loss of depth resolution, and it effectively forces the sources to depth within the model space to recover more realistic and meaningful models.
Laboratory and field investigation results have confirmed the reliability of the proposed algorithm. The presented inversion approach demonstrated to be appropriate for reconstructing of source current density distribution in terms of location and shape. In fact, there is a good agreement between the measured and predicted SP signals, as shown by the resulting approximations of both synthetic and true model. The causative source was recovered at its correct position when the depth-weighting exponent was set to values close to 3. This indicates clearly that the inversion algorithm can be used to observe remotely the pattern of groundwater flow (or changes in this pattern) and to detect the occurrence of sinkholes, as well as the buried SP sources at depth in regions where electronic conductors exist. In light of this the goal to develop an accurate and stable finite element algorithm to solve forward and inverse problems for the self-potential has been achieved. Future work should concern further developments on the optimization of the inversion approach, looking also at the 3-D formulation and new engineering and environmental applications. For instance, this approach to modeling SP data could be used in detecting and imaging corroded bar in armed concrete or in locating electrically conductive mineral deposits such as disseminated or massive sulfide ore deposits. In this sense the algorithm developed in this work including the whole geophysical data processing, can be improved through the insertion of new functions in order to extend the basic approach to allow for real scenarios where anomalies are due to deeper sources.
References
Abbas, M., & Fedi, M. (2015). Fractional-order local wavenumber-an improved source-parameter estimator. In 77th EAGE Conference and Exhibition 2015.
Abdelrahman, E.- S. M., Ammar, A. A. B., Hassanein, H. I., & Hafez, M. A., (1998). Derivative analysis of sp anomalies. Geophysics, 63(3), 890–897.
Abdelrahman, E.- S. M., El-Araby, H. M., Hassaneen, A.- R. G., & Hafez, M. A., (2003). New methods for shape and depth determinations from sp data. Geophysics, 68(4), 202–1210.
Adler, A., & Lionheart, W. R. B. (2006). Uses and abuses of eidors: An extensible software base for eit. Physiological Measurement, 27(5), S25.
Bastos, J. P. A., & Sadowski, N. (2003). Electromagnetic modeling by finite element methods. London: CRC Press.
Bear, J. (2013). Dynamics of fluids in porous media. Courier Corporation.
Bigalke, J., & Grabner, E. W. (1997). The geobattery model: A contribution to large scale electrochemistry. Electrochimica Acta, 42(23–24), 3443–3452.
Birch, F. (1998). Imaging the water table by filtering self-potential profiles. Ground Water, 36(5), 779–782.
Bolève, A., Revil, A., Janod, F., Mattiuzzo, J., & Jardani, A. (2007). A new formulation to compute self-potential signals associated with ground water flow. Hydrology and Earth System Sciences Discussions, 4(3), 1429–1463.
Cardarelli, E., Cercato, M., De Donno, G., & Di Filippo, G. (2014). Detection and imaging of piping sinkholes by integrated geophysical methods. Near Surface Geophysics, 12(3), 439–450.
Cardarelli, E., & Fischanger, F. (2006). 2d data modelling by electrical resistivity tomography for complex subsurface geology. Geophysical Prospecting, 54(2), 121–133.
Castermant, J., Mendonça, C., Revil, A., Trolard, F., Bourrié, G., & Linde, N. (2008). Redox potential distribution inferred from self-potential measurements associated with the corrosion of a burden metallic body. Geophysical Prospecting, 56(2), 269–282.
Cella, F., & Fedi, M. (2012). Inversion of potential field data using the structural index as weighting function rate decay. Geophysical Prospecting, 60(2), 313–336.
Centamore, E., Nisio, S., & Rossi, D. (2009). The san vittorino sinkhole plain: relationships between bedrock structure, sinking processes, seismic events and hydrothermal springs. Italian Journal of Geosciences, 12(8), 629–639.
Corry, C. E. (1985). Spontaneous polarization associated with porphyry sulfide mineralization. Geophysics, 50(6), 1020–1034.
De Witte, L. (1948). A new method of interpretation of self-potential field data. Geophysics, 13(4), 600–608.
De Donno, G. (2013). 2d tomographic inversion of complex resistivity data on cylindrical models. Geophysical, Prospecting, 6(1), 586–601.
De Donno, G., & Cardarelli, E. (2014). 3d complex resistivity tomography on cylindrical models using eidors. Near Surface, Geophysics, 12(5), 587–598.
De Donno, G., & Cardarelli, E. (2017). Vemi: A flexible interface for 3d tomographic inversion of time-and frequency-domain electrical data in eidors. Near Surface Geophysics, 15.
Fedi, M., & Abbas, M. A. (2013). A fast interpretation of self-potential data using the depth from extreme points method. Geophysics, 78(2), E107–E116.
Fedi, M., Cella, F., Quarta, T., & Villani, A. (2010). 2d continuous wavelet transform of potential fields due to extended source distributions. Applied and Computational Harmonic Analysis, 28(3), 320–337.
Fedi, M., Hansen, P. C., & Paoletti, V. (2005). Analysis of depth resolution in potential-field inversion. Geophysics, 70(6), A1–A11.
Fournier, C. (1989). ne des Puys (Puy-de-Dôme, France) Spontaneous potentials and resistivity surveys applied to hydrogeology in a volcanic area: Case history of the chaîne des puys (puy-de-dôme, france). Geophysical Prospecting, 37(6), 647–668.
Gibert, D., & Sailhac, P. (2008). Comment on “Self-potential signals associated with preferential groundwater flow pathways in sinkholes”. Journal of Geophysical Research, 113(B3), B03210.
Jacobsen, M., Hansen, P. C., & Saunders, M. A. (2003). Subspace preconditioned lsqr for discrete ill-posed problems. BIT Numerical Mathematics, 43(5), 975–989.
Jardani, A. , Dupont, J. , & Revil, A. (2006). Self-potential signals associated with preferential groundwater flow pathways in sinkholes. Journal of Geophysical Research: Solid Earth, 111(B9).
Jardani, A., Revil, A., Bolève, A., Dupont, J.- P., & Jardani, C. (2008, 09). 3d inversion of self-potential data used to constrain the pattern of ground water flow in geothermal fields. Journal of Geophysical Research 113.
Jardani, A., Revil, A., Santos, F., Fauchard, C., & Dupont, J. (2007). Detection of preferential infiltration pathways in sinkholes using joint inversion of self-potential and em-34 conductivity data. Geophysical Prospecting, 55(5), 749–760.
Li, Y., & Oldenburg, D. W. (1998). 3-d inversion of gravity data. Geophysics, 63(1), 109–119.
Marshall, D. J., & Madden T. K. (1959). Induced polarization, a study of its causes. Geophysics, 24(1), 790–816.
Meiser, P. (1962). A method for quantitative interpretation of selfpotential measurements*. Geophysical Prospecting, 10(2), 203–218.
Minsley, B. J., Sogade, J., & Morgan, F. D. (2007). Three-dimensional self-potential inversion for subsurface dnapl contaminant detection at the savannah river site, south carolina. Water Resources Research, 43(4).
Naudet, V. , & Revil, A. (2005). A sandbox experiment to investigate bacteria-mediated redox processes on self-potential signals. Geophysical Research Letters, 32(11).
Naudet, V., Revil, A., Rizzo, E., Bottero, J.- Y., & Bégassat, P. (2004). Groundwater redox conditions and conductivity in a contaminant plume from geoelectrical investigations. Hydrology and Earth System Sciences Discussions, 818–22.
Nourbehecht, B. (1963). Irreversible Thermodynamic Effects in Inhomogeneous Media and their Applications in Certain Geoelectric boblems, Ph.D. thesis, M.I.T.
Oliveti, I., & Cardarelli, E. (2017). 2D approach for modelling self-potential anomalies: application to synthetic and real data. Bollettino di Geofisica Teorica ed Applicata, 58(4), 415–430.
Paige, C. C., & Saunders, M. A. (1982). Lsqr: An algorithm for sparse linear equations and sparse least squares. ACM Transactions on Mathematical Software (TOMS), 8(1), 43–71.
Pascual-Marqui, R. D., Esslen, M., Kochi, K., Lehmann, D. (2002). Functional imaging with low-resolution brain electromagnetic tomography (loreta): A review. Methods and findings in experimental and clinical pharmacology, 24(Suppl C), 91–95.
Patella, D. (1997). Self-potential global tomography including topographic effects. Geophysical Prospecting, 45(5), 843–863.
Paul, M. (1965). Direct interpretation of self-potential anomalies caused by inclined sheets of infinite horizontal extensions. Geophysics, 30(3), 418–423.
Petitta, M. (2009). Hydrogeology of the middle valley of the velino river and of the s. vittorino plain (rieti, central italy). Italian Journal of Engineering Geology and Environment, 1, 157–181.
Rao, D. A., Babu, H. R., & Sinha, G. S. (1982). A fourier transform method for the interpretation of self-potential anomalies due to two-dimensional inclined sheets of finite depth extent. Pure and Applied Geophysics, 120(2), 365–374.
Rittgers, J. B., Revil, A., Karaoulis, M., Mooney, M. A., Slater, L. D., & Atekwana, E. A. (2013). Self-potential signals generated by the corrosion of buried metallic objects with application to contaminant plumes. Geophysics, 78(5), EN65–EN82.
Sato, M., & Mooney, H. M. (1960). The electrochemical mechanism of sulfide self potentials. Geophysics, 25(1), 226–249.
Stoll, J., Bigalke, J., & Grabner, E. (1995). Electrochemical modelling of self-potential anomalies. Surveys in Geophysics, 16(1), 107–120.
Tikhonov, A. N., & Arsenin, V. I. (1977). Solutions of ill-posed problems Solutions of ill-posed problems. Hoboken: Wiley.
Wahba, G. (1990). Spline models for observational data Spline models for observational data (59). Siam.
Acknowledgements
The laboratory set-up is part of a PRIN financing (2007–2010). The authors would like to offer their special thanks to Giorgio De Donno (Sapienza University of Rome) for his scientific contribution and his useful suggestions. They wish to acknowledge the help provided by Francesco Pugliese (Sapienza University of Rome) during the laboratory experiences.
Author information
Authors and Affiliations
Corresponding author
Additional information
Publisher's Note
Springer Nature remains neutral with regard to jurisdictional claims in published maps and institutional affiliations.
Rights and permissions
About this article

Cite this article
Oliveti, I., Cardarelli, E. Self-Potential Data Inversion for Environmental and Hydrogeological Investigations. Pure Appl. Geophys. 176, 3607–3628 (2019). https://doi.org/10.1007/s00024-019-02155-x
Received:
Revised:
Accepted:
Published:
Issue Date:
DOI: https://doi.org/10.1007/s00024-019-02155-x