
Abstract
Reasonable arrangement of stiffeners is of great significance for improving the strength and stiffness of the transmission housing. Taking the transmission housing of passenger car as the research object, the strength and stiffness of the transmission housing were predicted by finite element method (FEM), and the rationality of stiffener arrangement was evaluated. Then the mechanical analysis of unreasonable stiffener was carried out, and specific optimization measures were put forward from the position, direction, quantity and size of stiffener, so as to improve the mechanical properties of the transmission housing. Finally, the finite element analysis and experimental verification of the optimization scheme were carried out. The results show that compared with the original scheme of the transmission housing, the strength of the optimization scheme is increased by more than 26%, the stiffness is equivalent, and the structure does not have the risk of cracking and resonance. The optimization scheme had passed the bench strength test, which verified that the proposed stiffener optimization measures are effective, and the stiffener optimization measures have certain engineering reference value.
Access provided by Autonomous University of Puebla. Download conference paper PDF
Keywords
1 Introduction
As an important support part, the transmission housing should have enough strength and stiffness to resist the gear meshing force caused by engine torque and the transmission inertia force caused by uneven road, so as to support and protect the gear mechanism and ensure the normal operation of the transmission. The strength and stiffness of the transmission housing are not only related to the material type, such as cast iron, cast aluminium, etc., but also related to the important characteristic structure of the stiffener. The stiffener improves the structural strength and stiffness by changing the load path of the housing and improving the local stiffness of the housing.
Transmission housing is a complex spatial structure. At present, there are two main methods to arrange the stiffeners. The first method is to arrange the stiffeners according to the magnitude and direction of the bearing holes and in combination with engineering experience. For example, Yang Luyi mentioned some case design experience [1], including the layout experience and method of stiffeners. Deng Xiaomei and others put forward more detailed design principles of stiffeners [2]; Song Jinggui and others gave the structural dimension principle of stiffeners [3]; The second is to optimize the conceptual layout of stiffeners by using topology optimization method, and then lay out the stiffeners in detail based on the optimization results, such as Xu Yan and others applied the element strain energy sensitivity to optimize the stiffener layout of the truck transmission housing [4]; Zhu Jianfeng and others applied the variable density method to optimize the overall structure design of the housing and the layout of stiffeners [5]. The first method is widely used.
In this paper, the transmission housing of passenger car was taken as the research object. Firstly, the first method was used to arrange the stiffeners, and then the initial design structure of the housing was given. Then, the strength and modal finite element analysis were carried out, and the rationality of the stiffener arrangement was evaluated through the strength, frequency and vibration mode of the housing. Finally, starting from the local structure of the stiffeners, the unreasonable stiffeners were optimized one by one, and the optimization scheme was put forward, which was verified by calculation and test, so as to provide technical support for improving the transmission housing structure.
2 Overview of Transmission Housing
As shown in Fig. 1, the transmission housing is mainly composed of two parts. According to the arrangement on the vehicle, 1 is the right housing and 2 is the left housing. Bearing cap 3 and seal cap 4 are also included in the seal cavity with the housing. The right housing and the left housing are of transverse split structure. It can be seen that the stiffener arrangement has the following characteristics: near the bearing hole, the star shaped divergent stiffener is mainly used, supplemented by annular stiffener as support; the large wall of the housing is dominated by low and crisscross stiffeners.

Overview of transmission housing
3 Finite Element Analysis of Transmission Housing
The rationality of stiffener layout was confirmed by the strength and modal finite element analysis of transmission housing.
3.1 Strength Finite Element Analysis
3.1.1 Model Preprocessing
The smaller the mesh size of the finite element model is, the higher the accuracy of stress calculation will be, but the larger the calculation scale will be. In order to balance the contradiction between the mesh size and the calculation scale, the following meshing principles were followed. The housing structure was complex, so tetrahedral mesh should be adopted, and the basic mesh size was the same as the housing wall thickness (4 mm); the contact position of the bearing hole and the mesh at both ends of the stiffener should be divided into fine mesh, the mesh size was 1/2 of the wall thickness, and at least 2 rows of elements should be arranged at the fillet of both ends of the stiffener. The gear shaft and bearing were force transmission components, whose mesh size could be enlarged to twice of the wall thickness; gears were both force transmission components, but did not directly contact with the housing, so it could be greatly simplified, and was simulated using rigid body element (rbe2), the independent node of rbe2 was the gear mesh node, and the dependent node was selected from the contact part between needle roller bearing and gear shaft. The established finite element analysis model is shown in Fig. 2, in which the left figure is the housing finite element model, and the right figure is the finite element model of gear transmission mechanism inside the housing.

Finite element analysis model of housing strength
According to ABAQUS software recommendation, C3D10M should be selected for the tetrahedral mesh used in contact nonlinear problems. The material of main parts in the model is shown in Table 1.
3.1.2 Strength Calculation
The maximum design torque of each forward gear is the same, and the gear ratio of the first gear is the largest. Therefore, the meshing force of the gear passing through the first gear torque is the largest, which makes the housing bear the maximum force and the strength is the lowest. In addition to its large gear ratio, reverse gear also has the opposite rotation direction of the output shaft to the forward gear. As the harsh working conditions often occur in the first gear and the reverse gear [6], therefore, the first gear and the reverse gear are the necessary working conditions for the strength.
The first gear torque and reverse torque were applied in the same way, and the meshing force calculated according to the gear meshing parameters and gear torque was loaded on the corresponding gear nodes. The displacement boundary conditions of the first gear and the reverse gear were the same, one was to fix the bolt hole on the end face of the right housing, which was used to simulate the supporting effect of the flywheel housing on the transmission; the other was to restrict the axial rotation freedom of each gear shaft to meet the statics solution conditions. The reaction force on the degree of freedom of rotation was equal to the torque of the gear shaft. When defining the output of the result, the output of the reaction force should be defined at the same time, so as to check the correctness of the meshing force loaded.
The stress results of the housing is shown in Figs. 3 and 4 when the transmission is in the first gear and the reverse gear respectively. It can be seen that the stress in most areas of the housing is less than 50 MPa, which is far less than the material tensile strength of 240 MPa, so these regions meet the strength requirements; the larger stress value is mainly located on the stiffener near the bearing hole and the fillet of the intersection between the stiffener and the housing wall, and the stress exceeds the material tensile strength of 240 MPa, and the main reasons for the larger stress at these positions are as follows: ① the stiffener is the abrupt structure on the housing, and its shape changes greatly, resulting in high local stress concentration and large stress; ② the layout of some stiffeners is unreasonable, including the position, direction, quantity and size of the stiffeners, which results in partial load and overload at the partial locations of the stiffeners. In order to illustrate the problem clearly, the location of large stress is divided into 9 regions, and the larger stress values in corresponding regions are shown in Table 2. It can be seen that the stress values of regions 1, 2, 3, 4, 5, 6, 7 and 9 far exceed the material tensile strength, and there is a risk of local structural cracking, which should be focused on. The maximum stress value of Region 2 is 1277 MPa, which is in the state of compressive stress; the stress value of Region 8 is the minimum, which is 258 MPa, in the state of tensile stress.

Stress distribution of transmission housing in first gear

Stress distribution of transmission housing in reverse gear
Based on the stress results in Figs. 3 and 4, further considering the structural stress gradient, local stress state and material mechanical properties, the safety factor of the housing was calculated by using FEMFAT software. The safety factor of the housing is shown in Fig. 5 for the first gear and in Fig. 6 for the reverse gear. By comparing the safety factor and stress under the same working condition, it can be seen that the distribution of safety factor is basically the same as that of stress distribution, and the smaller safety factor is mainly concentrated on the stiffener and the fillet where the stiffener intersects with the housing wall. In Table 2, the minimum safety factors of each region are calculated. It can be seen that the safety factors of 9 dangerous regions are all less than 1.00, of which the maximum safety factor is 0.98 in Region 8, and the minimum safety factor is 0.47 in Region 2. Because 1.5 times of the maximum design torque of the transmission is used in the strength calculation, and the impact effect of the engine is taken into account, so the threshold value of the housing safety factor is taken as 1.00. According to the safety factor less than the threshold value of 1.00, which does not meet the strength requirements, and the strength of 9 dangerous regions is weak, and there are unreasonable local stiffeners, so it is necessary to optimize the stiffeners.

Safety factor distribution of transmission housing in first gear

Safety factor distribution of transmission housing in reverse gear
3.2 Modal Finite Element Analysis
According to the Formula (1) of modal frequency, only when the contribution of stiffeners to the housing stiffness \(k\) is greater than that to the housing mass m, the housing frequency can be increased. Therefore, the frequency reflects the stiffness of the housing.
where f is the frequency in Hz; k is the stiffness in n/mm; m is the mass in kg.
3.2.1 Free Modal Calculation
The free modal frequency of the housing is shown in Table 3. Limited to the length of the article, only the mode shapes corresponding to the first order frequency are given. As shown in Fig. 7, the vibration mode is mainly the normal vibration of the sealing cover, which is not coupled with the excitation direction of the engine, so the resonance of the housing is less likely to be aroused.

The first mode of free mode of the initial design housing
The in-line four cylinder four stroke engine works with the transmission, and the maximum operating speed is 5500 r/min. According to Formula (2), the second-order ignition excitation frequency of the engine is 183 Hz; while the vehicle is driving, the road excitation frequency is generally not more than 100 Hz [7]. Since the first free mode frequency of the housing is far greater than the second-order excitation frequency of the engine and the road excitation frequency, the housing will not be excited, and the housing free mode meets the design requirements.
where \(f_{e}\) is the engine ignition excitation frequency in Hz; \(n_{e}\) is the engine speed in r/min; \(Z_{e}\) is the engine cylinder number; \(\tau_{e}\) is the engine stroke number.
3.2.2 Constrained Modal Calculation
The constraint mode boundary conditions were applied to the bolt holes on the end face of the right housing and the flywheel housing to simulate the supporting effect of the flywheel housing on the transmission housing. The constrained modal frequency of the housing is shown in Table 3, and the modal vibration mode of the first frequency is shown in Fig. 8. The vibration mode mainly refers to the rotation of the housing around the y-axis, which is uncoupled with the excitation direction of the engine, and the housing is less likely to be excited resonance. Because the first order constrained modal frequency of the housing is far greater than the second-order excitation frequency of the engine and the road excitation frequency, the constrained modal frequency of the housing is outside the main excitation frequency range, so the housing will not be excited, and the constrained mode meets the design requirements.

The first mode of constrained mode of the initial design housing
4 Optimization Design of Stiffeners
4.1 Optimization Design Scheme
According to the main load types (tensile load, compression load, bending moment, etc.) of stiffeners, the local optimization design of stiffeners was carried out for 9 regions in Figs. 3 and 4 where the strength did not meet the requirements. The specific load type of stiffener could be judged by combining the Mises stress distribution and the maximum principal stress distribution. If the Mises stress distribution of the same stiffener was similar to the maximum principal stress distribution, it meant that the stiffener mainly borne tensile load, otherwise it borne compression load. Taking the stiffener shown in Fig. 9 as an example, according to the above method, it can be determined that the two stiffeners in Region 5 mainly bear tensile load, and the two stiffeners in Region 9 mainly bear compression load. Among them, there is obvious uneven stress distribution at the root of the left stiffener in Region 5, so it can be judged that the local “uneven stress distribution” still bears large bending moment.

Stress distribution of stiffener
The following is the analysis of the rationality of stiffener layout, and the optimization design scheme is proposed. In Figs. 10, 11 and 13, 14, 15, 16 and 17, the left part is the original scheme and the right part is the improved scheme.

Optimization scheme of Region 1

Optimization scheme of Region 2, Region 3, and Region 7
-
1.
In Fig. 10, the a-stiffener in Region 1 bears the tensile load of the annular stiffener plate, but also bears the additional bending moment. Therefore, it should be changed into straight stiffener, and the location near the housing outer wall should be thickened to improve the local connection strength.
-
2.
In Fig. 10, the b-stiffener in Region 1 is suspended on the annular stiffener plate. The normal stiffness of the annular stiffener plate is small and the supporting effect is poor. The b-stiffener should be extended to the housing outer wall.
-
3.
In Fig. 11, the c-stiffener in Region 2 is along the radius of bearing hole, but there is an angle between it and the actual radial force direction of bearing, so that the stiffener bears additional bending moment while bearing pressure load. The direction of c-stiffener should be adjusted to be consistent with the radial force direction of bearing, and additional stiffener should be added to bear the bearing radial force with c-stiffener together. The judgment method of bearing radial force is shown in Fig. 12. The line between the maximum deformation point of bearing hole and the centre of bearing hole is the direction of bearing radial force.
Fig. 12 
Determination method of bearing radial force
-
4.
In Fig. 11, when there is no d-stiffener in Region 3, the bending moment at the joint between the end face of bearing hole and the root of bolt boss is large. With the increase of d-stiffener, the local bending moment of the structure decreases, and the tensile cross-section area of the bearing hole is increased, and the stress concentration is reduced.
-
5.
In Fig. 11, the tensile load and bending moment of the housing outer wall in Region 7 are mainly borne by e-stiffener. Considering that the tensile section area of the stiffener is small and the bending section modulus is small, it is suggested to remove it so that the housing bottom wall with larger tensile cross-section area can directly bear the housing outer wall load.
-
6.
In Fig. 13, the f-stiffener in Region 4 bears tensile load. Since the compressive strength of 360 MPa for aluminium alloy material is significantly higher than the tensile strength of 240 MPa, the stress of stiffener here should be designed as compression state, and the stiffener should be arranged inside the housing, such as h-stiffener in Fig. 14.
Fig. 13 
Optimization scheme of Region 4
Fig. 14 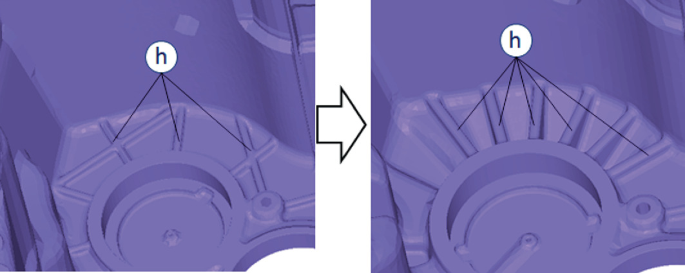
Optimization scheme of Region 6
-
7.
In Fig. 15, the g-stiffener in Region 5 bears the tensile load. By increasing the transition fillet connected with the housing wall, the local stress concentration is reduced, and the two ends of the stiffener are widened to improve the structural connection strength.
Fig. 15 
Optimization scheme of Region5
-
8.
In Fig. 16, the i-stiffener in Region 8 bears the tensile load, and the tensile load is shared by adding a stiffener.
Fig. 16 
Optimization scheme of Region 8
-
9.
In Fig. 17, the j-stiffener in Region 9 bears the tensile load. The improvement method is as follows: firstly, increase the fillet at both ends of j-stiffener; secondly, close the k-stiffener nearby to j-stiffener, so that k-stiffener can share more load and reduce the load borne by j-stiffener.
Fig. 17 
Optimization scheme of Region 9


4.2 Calculation of Stiffener Optimization Scheme
4.2.1 Strength Finite Element Analysis
The stress comparison of the housing before and after optimization is shown in Fig. 18. It can be seen that compared with the original scheme, the stress in 9 dangerous regions of the improved scheme has been reduced, with the maximum reduction range of 929 MPa in Region 2, the maximum reduction rate of 91% in Region 4, and the minimum reduction range of 51 MPa and the minimum reduction rate of 20% in Region 8.

Comparison of stress before and after optimization
The safety factors comparison of the housing before and after optimization is shown in Fig. 19. It can be seen that compared with the original scheme, the safety factor of 9 dangerous Regions in the improved scheme has been improved, with the maximum increase rate of 852% in Region 4 and the minimum increase ratio of 26% in Region 8. Among the 9 dangerous regions, the safety factor of Region 5 is minimum, which is 1.01, but it reaches the threshold and the housing strength meets the requirements.

Comparison of safety factor before and after optimization
4.2.2 Modal Finite Element Analysis
The modal frequencies comparison of the housing before and after optimization is shown in Fig. 20. It can be seen that the free modal frequency and constrained modal frequency of the improved scheme are equivalent to the original scheme, and are far greater than the second-order excitation frequency of the engine and the road excitation frequency, and the housing mode meets the design requirements.

Comparison of modal frequencies before and after optimization
4.2.3 Bench Strength Test
Based on the transmission assembly, the static torsional test of the first gear bench and the static torsion test of the reverse gear bench were carried out, as shown in Fig. 21. After the test, there is no structural fracture failure phenomenon, and the optimization scheme of the housing meets the strength requirements.

Static torsional test of transmission bench
5 Conclusions
-
1.
Through the optimization design of stiffeners, the overall strength of the housing is greatly improved, which meets the design requirements and is verified by bench test.
-
2.
The stiffener is an important characteristic structure on the transmission housing. When the basic structure size of the housing is determined, the strength and stiffness of the housing mainly depend on the arrangement of the stiffeners. Local optimization of stiffeners can effectively improve the strength of the housing, but has little effect on the overall stiffness.
-
3.
The structural parameters of stiffeners include position, direction, quantity and size, etc. The optimization design of stiffeners can start from the above parameters, and then improve the mechanical properties of the housing.
-
4.
In order to improve the effectiveness of the stiffeners, the stiffeners should be arranged in the direction of force transmission. The design principle is to bear the positive pressure load and the positive tension load. The bending moment should be avoided as far as possible, otherwise the strength of the housing will be greatly reduced.
-
5.
The conventional stiffener layout principle is applicable to the initial design of the housing. The detailed design of the housing should be simulated by CAE for many times, and the stiffener optimization design should be carried out based on the CAE results, so as to effectively improve the mechanical properties of the housing.
References
Yang L (2008) Application of housing design principle in six speed manual transmission. Automobile Technol Mater 7:43–46
Deng X, Liu H (2016) Stiffener design of housing. Jiangxi Chem Ind 3:211–213
Song J, Gong Z et al (2013) Theoretical basis, selection, design and application of automobile transmission. China Machine Press, Beijing
Xu Y, Chen Y et al (2009) Location optimization of stiffeners of transmission housing for a truck. J Harbin Inst Technol 41(3):157–160
Zhu J, Lin Y et al (2013) Structural topology optimization based design of automobile transmission housing structure. J Jilin Univ (Eng Technol Ed) 43(3):25–27
Chen X, Yuan M et al (2012) Design of automatic transmission housing and simulation optimization. Automot Technol 10:24–28
Deng Q, Wang X et al (2014) Modal research on transmission housing of electric vehicles. Automot Technol 4:25–27
Author information
Authors and Affiliations
Corresponding author
Editor information
Editors and Affiliations
Rights and permissions
Copyright information
© 2022 The Author(s), under exclusive license to Springer Nature Singapore Pte Ltd.
About this paper

Cite this paper
Kang, Y., Cao, Z., Liu, Y., Li, J., Zhang, Y., Yan, B. (2022). Optimization Design of Transmission Housing Stiffener Based on Fem. In: Proceedings of China SAE Congress 2020: Selected Papers. Lecture Notes in Electrical Engineering, vol 769. Springer, Singapore. https://doi.org/10.1007/978-981-16-2090-4_26
Download citation
DOI: https://doi.org/10.1007/978-981-16-2090-4_26
Published:
Publisher Name: Springer, Singapore
Print ISBN: 978-981-16-2089-8
Online ISBN: 978-981-16-2090-4
eBook Packages: EngineeringEngineering (R0)