
Abstract
The results of the development of new software for processing the results of measuring the intensities of optical fields of interference patterns, created by optical means for measuring small linear and angular displacements of control object surfaces, are discussed. These measurement means are proposed on the base of a laser two-way interferometer with aligned branches; examples of their use are given. The offered software was certificated in Russia due to the state registration of corresponding computer programs. This software allows one to improve the quality of measurement results in solving various actual practical problems of studying the properties and processes of defect formation in new materials, diagnosing the state of construction materials of the power elements of goods by acoustic nondestructive testing at all stages of their life cycle.
Access provided by CONRICYT-eBooks. Download conference paper PDF
Keywords
1 Introduction
At present, the introduction of modern methods and means of laser interferometry opens new possibilities in the solution of various actual practical problems of studying the properties and processes of defect formation in new materials (including layered, polymer, and composite) and also in the diagnostics of the state of construction materials for power elements of goods at all stages of their life cycle.
One of the most preferred for solving scientific and production problems is a laser two-way interferometer with combined branches, proposed in [1, 2]. Experimental studies of the functional characteristics of above-mentioned interferometer, modified for the contactless measurement of the small displacements of control object surfaces in the diagnostics of the state of materials by acoustic nondestructive testing methods, were described in detail in works [3,4,5].
New mathematical models and original software for modeling the intensities of the optical fields of interference patterns , created by above interferometer, modified for solving measurement problems, were developed. This software was certificated in Russia due to the state registration of computer programs. Numerical simulation for various variants of optical schemes taking into account the features of their constituent parts (geometric characteristics, beam splitter type, etc.) was carried out, the results and analysis of which are described in detail in works [6, 7].
Based on the results of numerical and experimental modeling, new optical facilities for contactless measurements of small linear and angular displacements of the control object surfaces, methods, and means for recording the intensities of the optical fields of interference patterns, unambiguously associated with the measured displacements, were proposed. Moreover, the methods and means of protecting the developed measuring means from the influence of external and internal destabilizing influences on measurement results were developed. Technical solutions, implemented in the proposed measuring facilities, were patented in Russia. The functional characteristics of the prototypes of these measuring instruments were numerically and experimentally investigated and grounded. The results of the development and scientific calculation and experimental justification of the proposed optical measuring means were described in detail in works [8,9,10]. Works [11, 12] describe new scientifically grounded method and an optical device for measuring small spatial (linear and all angular) displacements of the surfaces of control objects. Works [9, 10] present technical solutions, patented in Russia, allowing the use of the developed optical means as components of mobile diagnostic setups and measuring controlled small displacements without loss of functional properties and accuracy of characteristics at the site of operation of the diagnosed objects.
The above-mentioned measuring facilities have been successfully used in experimental studies of defect formation processes in thin samples of tape high-temperature superconductors, as well as in the development of methods for monitoring their quality during manufacture. Descriptions of experimental measuring devices are given in the works [13, 14]. Experimental operation of the above optical measuring means has shown that one of the directions for improving the quality of measurement results can be the development and use of new software for processing the results of measuring the intensities of optical fields of interference patterns that are unambiguously associated with measurable small displacements of the surfaces of control objects.
This paper describes the results of the development and use of this software in solving measurement problems.
2 Software for Processing the Measurements Results of the Optical Field Intensities of Interference Patterns and Examples of Its Use
It is developed software in MathCad 2000 Professional and above versions for processing the measurement results of the optical field intensities of interference patterns . These patterns are created by optical means for measuring small linear and angular displacements of the control object surfaces , proposed on the base of a laser two-way interferometer with combined branches.
This software includes a set of computer programs, developed on the base of the same typical algorithm. These programs model a certain variant of information collection, connected with the intensity of optical field of interference pattern (a single photodetector device, a group of photodetectors, a matrix of photoreceivers with predetermined geometric characteristics, etc.). This information is collected from predetermined areas of the interference pattern (in one or several rings of the interference pattern, in the selected region of the interference pattern, and so on). The software also uses various methods of statistical processing of information obtained.
In each computer program of the software, a typical algorithm for simulating the process of measuring small displacements of the control object surfaces by optical interference measuring means is implemented. The essence of this algorithm can be visually shown in the simplest example of measuring a small linear displacement of the control object surface by a single photodetector device (e.g., a photodiode of FD9 type) installed in one of the rings of the interference pattern.
The initial data for processing is a set of images of interference patterns (n = 1, 2 …, N), presented in standard graphic formats. Each (nth) of them corresponds to a certain moment of measurement (to small linear displacement) during registration of the image of the interference pattern. In this process, it is performed a reproduction of the given value of a small linear displacement of the control object surface, as well as the geometric characteristics of the photodetector device.
In a whole, this algorithm, implemented in the software, consists of the following steps:
-
1.
Visualization and analysis of the intensity of the optical field of the initial interference pattern (n = 1), characterizing the initial position of the surface of the control object, whose appearance is represented in Fig. 1.
Fig. 1 
Appearance of the original interference pattern (n = 1)
-
2.
Visualization and analysis of the intensities of optical fields of all interference patterns, included in a set of images (n = 1, 2, …, N, e.g., N = 31), corresponding to certain measuring moments (to linear displacements) during registration (the appearances of interference patterns n = 1, 2 … 9 are shown in Fig. 2).
Fig. 2 
Appearances of interference patterns n = 1, 2, …, 9
-
3.
The choice of the region in the initial interference pattern (n = 1), restricted by the given geometric characteristics of the photodetector device, by applying horizontal and vertical lines (marking) and its visualization (see Fig. 3).
Fig. 3 
Appearance of the marking on the original interference pattern (n = 1)
-
4.
Visualization of the selected region of the original interference pattern (n = 1), restricted by the given geometrical characteristics of the photodetector device (see Fig. 4).
Fig. 4 
Appearance of the original interference pattern (n = 1) with the selected region
-
5.
Specification and visualization of the selected area in all interference patterns (n = 1, 2, …, 31), belonging the set by using the parameters of the original interference pattern (the appearances of the interference patterns n = 1, 2, …, 9 are shown in Fig. 5).
Fig. 5 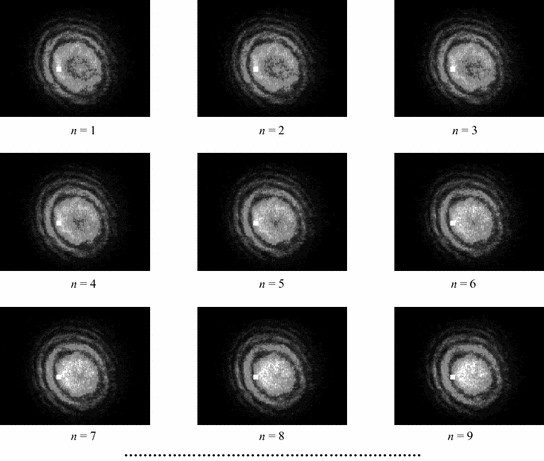
Appearances of interference patterns n = 1, 2, …, 9 with selected areas
-
6.
Determination of the summary intensity I s for the chosen region for all interference patterns, belonging the set (n = 1, 2, …, 31), and constructing the dependence of the change in the calculated summary intensity I s for the chosen region for each of the registration moments (see Fig. 6).
Fig. 6 
Dependence of summary intensity I s for selected region of interference patterns n = 1, 2, …, 31
-
7.
Processing the results obtained using, for example, various built-in tools that implement methods of statistical processing and forecasting and known software. Figure 7 shows, for example, the dependence of the summary intensity I s for the selected region of interference patterns n = 1, 2, …, 31 after statistical processing using the built-in tools of MathCad 2000 Professional software.
Fig. 7 
Dependence of summary intensity I s for selected region of interference patterns n = 1, 2, …, 31 after statistical processing


The developed software also includes computer programs for processing the results of intensity measurements obtained with the aid of two photoreceivers, mounted in adjacent interference pattern rings (see Fig. 8), and also when recording the intensity from the selected region of the interference pattern, characterized by maximum contrast (see Fig. 9).

Appearance of the original interference pattern (n = 1) with the selected regions for the registration variant using two photoreceivers

Appearance of the original interference pattern (n = 1) with selected region for the registration variant of intensity from the selected area
The programs described above, included in the software, have been tested and used in processing the results of experimental studies of the functional characteristics of promising optical measuring facilities.
Further development of the proposed algorithm and software will be connected with the improvement of standard unified algorithms for modeling various options for measuring and processing the results of measurements of small spatial displacements of control object surfaces and also will be directed to automation of the processing test data.
3 Conclusions
New software has been developed for processing the measurement results of the optical field intensities of interference patterns , created by optical means, for measuring small linear and angular displacements of control object surfaces , proposed on the base of a laser two-way interferometer with combined branches.
The proposed software has been certified in Russia due to the state registration of corresponding computer programs and allowed improving the quality of measurement results by solving various actual practical problems of studying the properties and processes of defect formation in new materials, diagnosing the state of construction materials of the power elements of goods by acoustic nondestructive testing methods of control at all stages of their life cycle.
The proposed software can also be successfully used to simulate the measurement of small linear and angular displacements of control object surfaces by creating new methods for processing the intensities of the optical fields of interference patterns, created by optical measuring means, developed on the base of laser interferometers of various types.
The software and technical solutions, described in the article, were presented at the International Innovation Salons INVENTIONS GENEVA 2017 (Switzerland) and EUROINVENT 2017 (Romania), where were awarded gold medals.
References
A.N. Matveev, Optics (High School, Moscow, 1985), 351 p (in Russian)
A.S. Batrakov, M.M. Butusov, G. P. Grechka, Laser Interferometry Systems (Radiocommunication, Moscow, 1981), 456 p (in Russian)
I.P. Miroshnichenko, A.G. Serkin, Meas. Tech. 49(5), 22 (2006)
I.P. Miroshnichenko, A.G. Serkin, Russ. J. Nondestr. Test. 43(4), 234 (2007)
I.P. Miroshnichenko, A.G. Serkin, Russ. J. Nondestr. Test. 44(5), 318 (2008)
I.P. Miroshnichenko, A.G. Serkin, V.P. Sizov, Meas. Tech. 50(1), 10 (2007)
I.P. Miroshnichenko, A.G. Serkin, V.P. Sizov, J. Opt Technol. 75(7), 437 (2008)
I.P. Miroshnichenko, I.A. Parinov, E.V. Rozhkov, A.G. Serkin, V.P. Sizov, in Piezoelectrics and Related Materials: Investigations and Applications, ed. by I.A. Parinov. (Nova Science Publishers, New York, 2012), p. 239
I.P. Miroshnichenko, I.A. Parinov, E.V. Rozhkov, V.P. Sizov, V.A. Shevtsov, in Physics and Mechanics of New Materials and their Applications, ed. by I.A. Parinov, S.-H. Chang (Nova Science Publishers, New York, 2013), p. 145
I.P. Miroshnichenko, I.A. Parinov, E.V. Rozhkov, S.-H. Chang, in Advanced Materials—Manufacturing, Physics, Mechanics and Applications, ed. by I.A. Parinov, S-H. Chang, V.Y. Topolov. Springer Proceedings in Physics, vol 175 (Springer Cham, Heidelberg, 2016) p. 341
I.P. Miroshnichenko, I.A. Parinov, IOP Conf. Ser.: Mater. Sci. Eng. 209, 8 (2017)
I.P. Miroshnichenko, I.A. Parinov, J.-K. Wu, W.-L. Hong, M.-Y. Yeh, in Advanced Materials—Techniques, Physics, Mechanics and Applications, ed. by I.A. Parinov, S.-H. Chang, M.A. Jani. Springer Proceedings in Physics, vol. 193 (Springer Cham, Heidelberg, 2017), p. 591
I.P. Miroshnichenko, I.A. Parinov, E.V. Rozhkov, A.G. Serkin, Metallurgist 50(7–8), 408 (2006)
I.P. Miroshnichenko, A.G. Serkin, Metallurgist 54(3–4), 189 (2010)
Acknowledgements
The study was performed under partial support of the Russian Foundation for Basic Research (No. 16-08-00740). I. P. Miroshnichenko and I. A. Parinov acknowledge financial support of the Russian Ministry of Education and Sciences in the framework of “Organization of Scientific Research” Government Assignment.
Author information
Authors and Affiliations
Corresponding author
Editor information
Editors and Affiliations
Rights and permissions
Copyright information
© 2018 Springer Nature Singapore Pte Ltd.
About this paper

Cite this paper
Miroshnichenko, I.P., Parinov, I.A. (2018). On Increasing Quality of Measurement Results at Testing State of Construction Materials. In: Prakash, R., Jayaram, V., Saxena, A. (eds) Advances in Structural Integrity. Springer, Singapore. https://doi.org/10.1007/978-981-10-7197-3_55
Download citation
DOI: https://doi.org/10.1007/978-981-10-7197-3_55
Published:
Publisher Name: Springer, Singapore
Print ISBN: 978-981-10-7196-6
Online ISBN: 978-981-10-7197-3
eBook Packages: EngineeringEngineering (R0)