
Abstract
The motility of live spermatozoa indicating energy requirement and thus presence of intrinsic metabolic pathways in the cell has led researchers to speculate relationship of sperm metabolism with semen quality parameters. Over the period, many assays, some quantitative and some qualitative, to estimate metabolic aspects of sperm life have been developed. Investigators have reported significant relationship of metabolic assays with that of sperm concentrations and motility. Moreover, a significant relationship of resazurin reduction assay with that of oxidative stress of spermatozoa has also been reported recently. This chapter outlines principle and procedures involved in various assays employed for estimating metabolic rates of bovine spermatozoa. Modification of resazurin assay to objectively measure colour changes using spectrophotometer and, in fructose estimation, protocols to evaluate metabolic rates in sperm suspension and frozen-thawed samples have been included.
Access provided by CONRICYT-eBooks. Download chapter PDF
Keywords
10.1 Introduction
Although the specific biochemical pathways of spermatozoa metabolism is too involved and detailed to discuss at length in this chapter, we have attempted to cover basic understanding of spermatozoa metabolism, its importance in modulated semen and substrates for energy production in relation with various protocols to determine metabolic activity of spermatozoa. This chapter sets forth the broad outlines of major concepts of spermatozoa metabolic pathways.The motile characteristic of unicellular spermatozoon is a direct indication of metabolic processes within. Spermatozoa contain numerous mitochondria located strategically in the midpiece where they can efficiently power the flagellum. The sperm axoneme engine requires a continuous supply of adenosine triphosphate (ATP) to maintain motility first in the distal part of the male (MRT) and subsequently in the female reproductive tract. The axial filament derives the direct energy for sperm cell motility from the breakdown of ATP contained in the helical strands that band the fibrils. Apparently, ATP stored within the cells provides energy for motility, to maintain active transport process of membrane and for fertilization process itself. The production of energy by sperm cells is regulated by cAMP (cyclic adenosine monophosphate) which therefore has a direct control on sperm activity. The nucleotide, ATP, is composed of the base, adenosine, a five-carbon ribose ring and three phosphate bonds, the last two of which are energy rich (p ~ p) and can be built into the compound only by addition of large quantities of energy. In the presence of the specific enzyme, the first energy-rich phosphate bond is broken, liberating energy, leaving ADP (adenosine diphosphate) and inorganic phosphate:
The second energy-rich bond can then be broken from ADP, liberating energy for fibril contraction, leaving AMP. The released energy can then be used for motility or biosynthesis (membrane transport) or may simply escape as heat. Obviously, when supply of p ~ p in ATP and ADP is exhausted, the contraction of the sperm fibrils stops, and consequently motility ceases. This is precisely for this reason that exogenous source of energy in the form of various substrates is required in the extender to rebuild the ADP and ATP. In the presence of oxygen, the rebuilding of ADP and ATP may occur by respiration and glycolysis whereas in its absence by glycolysis only. Fortunately, the reactions are reversible making semen processing much easier.
Despite absence of many of the organelles associated with normal metabolic process, sperm cell contains all necessary enzymes required for biochemical reactions, viz. glycolysis, (Embden-Meyerhof pathway), fatty acid oxidation, electron transport, the tricarboxylic acid cycle (TCA) and possibly hexose monophosphate shunt. Mostly, mammalian sperm can produce energy by anaerobic glycolysis, by oxidation of the metabolic products of glycolysis or by oxidation of endogenous substrates [1, 2]. During most of the extra-gonadal life of sperm cells, spermatozoa break down fructose (a principal sugar present in bovine and ram seminal plasma), glucose or mannose under anaerobic conditions to lactic acids (fructolysis). This important attribute helps spermatozoon to survive under modulated conditions of sperm storage. However, sperm produce energy more efficiently under aerobic conditions by oxidation pathway carried out in the mitochondria. By this means, spermatozoa utilizes a variety of substrates (lactate or pyruvate resulting from breakdown of fructose) to produce energy (most converted into ATP), carbon dioxide and water. Though spermatozoa depend on seminal plasma for their requirement of substrates for energy production, in the absence of exogenous source of such substrates, spermatozoa use their intracellular depot of plasmalogen to provide energy on a short-term basis. Anaerobic metabolism (fructolysis) is essential in animals with internal fertilization under conditions of O2 scarcity (presumably in highly concentrated semen). However, by the time sperm dilution, dispersal and ascent in the female reproductive tract begin, availability of even scarce O2 (sperm can maintain respiration at very low level, 1% of O2) is utilized by the cells to oxidize the lactic acids (exogenous respiration) and their own intracellular lipid reserve (endogenous respiration) [3].
On a more practical way, provision of energy is relatively less important where sperm are to be frozen, for they will remain active only for a few hours at most before ultra-low temperature suspends all metabolic activity. However, if semen is to be used chilled, when sperm metabolism is to be sustained for several days, provision of exogenous source of energy is important. For this reason, most diluents make some provision of energy substrates for sperm. In general, simple sugars such as glucose, fructose, mannose and arabinose are suitable substrates, although the rate at which these sugars are metabolized varies substantially between species [4]. Lactose, which is present in the milk-based extenders, is not metabolized to any appreciable extent, whereas egg yolk, a component of many diluents, provides many substrates for sperm metabolism [5]. With above information in hand, we can surmise that a semen sample containing a greater number of live and actively motile spermatozoa will have comparatively higher metabolic activity.
To study metabolic activity of spermatozoa, three basic types of cell suspensions have been used: fresh semen (with seminal plasma), washed spermatozoa (without seminal plasma) and epididymal spermatozoa (no exposure to seminal plasma). While using the washed sperm cells, the investigator may keep in mind that dry weight of 100 million sperm cells is equal to about 2.5 mg [5], and hence calculations are to be adjusted accordingly while measuring oxygen uptake of spermatozoa. In addition, while using washed sperm cells, it must be understood that seminal plasma contains many substances, some stimulators and some inhibitors of metabolism of spermatozoa. Any interpretation of the result thus obtained must undoubtedly provide for direct or indirect influence of such factors. Nevertheless, investigator must consider a number of factors known to be more or less important in the control of metabolic rate. These are temperature, pH, concentration, inorganic phosphate, cations, anions, osmotic pressure, hormones, antibacterial agents (e.g. sulphanilamide is a depressant of metabolic rate) and several other factors [6, 7]. Moreover, there is an inverse relationship between the concentration of spermatozoa in semen and the resulting rate of metabolic activity per sperm cell. With above considerations in mind, an investigator may choose any of the several assays currently used in semen biology measuring metabolic activity of spermatozoa. To facilitate selection of an appropriate assay best suiting to his investigation, this chapter lays out procedures, principles, materials required as well as comparative merits of assays employed. These assays are:
-
By change in pH
-
Methylene blue reduction test
-
Resazurin reduction test
-
Fructose content of semen
-
Colorimetric assays
-
Enzymatic assay
-
Chromatographic assay
-
Oxygen utilization test
-
By pyruvate reduction
10.2 Comparing Assays Estimating Metabolic Activity of Spermatozoa
The values obtained by various reduction assays, fructose estimation and other assays are not absolute and are affected by other substances such as citrate, lactate and glucose, and conditions such as cell concentration, agglutination, viability and motility can affect the reduction rate [8,9,10]. Similarly, a linear temperature increase caused a similar response in the sperm reduction rate of methylene blue to leuco-methylene blue [8]. Therefore, all assays employed to assess metabolic rate of spermatozoa have their own intrinsic advantages, at the same time lacking in controlling the experimental conditions in other aspects. Therefore, despite luxury of having several assays and parameters to determine the metabolic rate of the spermatozoa, an investigator is advised to bear all factors in totality before arriving at a conclusion. Though spermatogenesis and fructose production are two independent events, it is not surprising to find that in spontaneous or experimentally induced oligospermia or aspermia [11], fructose levels are often above the normal average. Since the level of fructose in seminal plasma bears no relationship to sperm concentration, the ‘fructolysis index’ (FI) often fails to accurately express the metabolic activity of sperm. For example, oligospermic bulls often deliver ejaculates high in initial fructose, which is out of proportion to the low sperm count. Thus, very high FI of this bull will overevaluate the metabolic potency of the sperm population. In contrast, in samples with high sperm concentration with low initial fructose levels, the sugar may be exhausted within an hour. This sample will yield a low FI and therefore under-evaluate sperm metabolism. Moreover, FI poses another problem. This occurs when quantitative relationship of sperm to seminal fluid fructose is calculated on an individual sperm basis. The results show that the turnover of fructose is progressively lowered with increase in sperm concentration [12]. These two examples amply clarify that the problems arising during application of the FI might be due to natural variation in concentration of sperm and initial fructose content, degree of dilution and type of buffer used, all of which may affect the metabolic behaviour of sperm. Still, seminal fructose estimation is a valuable assay to assess male reproductive system. Reduction assays using methylene blue and resazurin have been developed to incorporate spectrophotometric evaluations making them quantitative. Similarly, chromatographic and enzymatic estimation of metabolic rates have their own merits. Under such circumstances, researcher will be well placed to evaluate various assays before embarking on any one to determine metabolic rate of spermatozoa in his experiment (Table 10.1).
10.3 Protocols
10.3.1 Estimation of Metabolic Activity by Measuring Change in pH
The products of the metabolic activity of spermatozoa are lactic acid and pyruvate. Therefore, for quantitative analysis, it is wise and easy to use seminal pH as an indicator of metabolic activity of spermatozoa of a given sample. With progression of standing time, more and more of lactic acid is produced by sperm metabolism. This effectively brings down the pH, which is then measured to compare metabolic activity of spermatozoa in a given sample.
It is also well known that most enzyme systems require a particular pH range for optimum response. Thus, with decreasing pH of the sample, metabolic activity of the sperm cells also decreases. It has been shown that pH exerts primary influence on the fructolysis rate of spermatozoa [5]. Inhibition of metabolic activity (as reflected in reduced motility) by acidic pH and stimulation of metabolic activity (as reflected by increased motility) by alkaline pH of the medium have long been recognized.
10.3.2 Methylene Blue Reduction Test (MBRT)
Principle
This test is based on the principle that live spermatozoon, by the action of intracellular enzyme (dehydrogenase) on the substrate provided in the test media, liberates hydrogen ions. The methylene blue (MB), a hydrogen acceptor, receives the liberated hydrogen ions. When MB is reduced by addition of two hydrogen ions, it loses its deep blue colour and turns into leuco-methylene, a white substance. The reaction must take place in the absence of air for the oxygen in the air rapidly oxidizes leuco-methylene to MB.
Because of metabolic activity of spermatozoa, hydrogen ions are liberated continuously. Greater the release of hydrogen ions per unit time lesser will be the time taken by MB to change its colour. Thus, a semen sample that has greater concentration of active spermatozoa will reduce MB in less time. A strong negative correlation has been established between MBRT and fertilizing ability of spermatozoa [13]. Reduction timing of MB can also be utilized to evaluate mitochondrial function of spermatozoa [14].
Materials
Fresh semen, egg yolk-Tris-glycerol (EYTG) extender, methylene blue dye (3,7-bis(dimethylamino)phenazathionium chloride), 2.9% sodium citrate dihydrate, DW, mineral oil (liquid paraffin), water bath with thermometer
-
Methylene Blue Solution
-
5 mg methylene blue.
-
Dilute to 10 mL using 2.9% sodium citrate dihydrate.
-
Procedure
-
(a)
Dilute 0.2 mL of neat semen with 0.8 mL of EYTG extender in a 10 mL tube.
-
(b)
To this, add 0.1 mL of MB solution, and mix well.
-
(c)
Seal the test tube using paraffin oil of 1 cm thickness.
-
(d)
Incubate this test tube in a covered water bath at 46.5 °C.
-
(e)
Note the time required to reduce the colour of MB to white.
Observations
Note that change in colour of MB is less evident at the top that has less perfect anaerobic condition (Table 10.2).
Discard the semen sample, which retains the colour for 9 min or more (Fig. 10.1).

Microphotograph showing sequential colour changes in semen sample subjected to methylene blue reduction assay. In the image above, ‘Control’ contains no semen sample, whereas others show reduction of methylene blue by spermatozoa after 1, 4, 7 and 11 min time intervals
Points to Ponder
-
(a)
Many factors affect MBRT and therefore the steps of operation should be uniform.
-
(b)
False results may be due to contamination by bacteria, epithelial cells or leucocytes.
-
(c)
MB may be used for undiluted semen but result needs adjustments.
-
(d)
Always use sterilized glassware and solutions as presence of microorganism might influence the result.
-
(e)
Presence of sugars and lipids in extender affects MBRT values.
-
(f)
Contact of the test solution with atmospheric O2 will interfere with the result.
-
(g)
Light hastens reduction and therefore the tests should be kept covered.
10.3.3 Resazurin Reduction Test (RRT): Qualitative
Principle
Resazurin (7-hydroxy-3H-phenoxazin-3-one-10-oxide) is a metabolic dye used in assessing fertility potential of bull semen [28, 18]. Resazurin reduction test (RRT) depends upon the ability of metabolically active spermatozoa to reduce the resazurin dye to hydroresorufin. The reaction is manifested by a series of gradual colour changes from blue (resazurin) to purple (resorufin, irreversible) followed by pink and finally white/colourless (dihydroresorufin). This test provides important information not only about concentration of metabolically active (live) spermatozoa but also about enzymatic function of prostate gland.
Materials
Resazurin dye, 3% sodium citrate dihydrate, DW, mineral oil (paraffin), water bath with thermometer
Resazurin Dye Solution
-
5.5 g resazurin dye.
-
Dilute to 100 mL DW.
Procedure
-
(a)
Take 1 mL of neat semen in a 10 mL tube.
-
(b)
To this, add 0.1 mL of resazurin dye solution, and mix well.
-
(c)
Seal the test tube using paraffin oil of 1 cm thickness.
-
(d)
Incubate this test tube in a water bath at 45 °C.
-
(e)
Note the time required to reduce the colour of resazurin dye to pink and then white.
Observation
-
(a)
Note that change in colour of resazurin dye is less evident at the top where the anaerobic condition is less perfect (Fig. 10.2).
Fig. 10.2 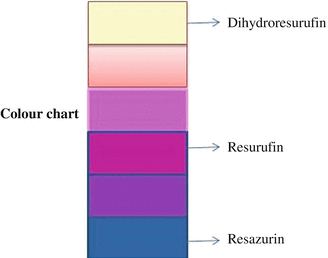
Microphotograph shows colour chart for resazurin reduction assay. Microphotograph shown can be used in reading the results of the RR assay. Resazurin reduction assay depends upon the ability of metabolically active spermatozoa to reduce the resazurin dye to hydroresorufin. The reaction is manifested by a series of gradual colour changes from blue (resazurin) to purple (resorufin, irreversible) followed by pink and finally white/colourless (dihydroresorufin)
-
(b)
In samples with higher concentration of live spermatozoa, the pink colour develops within 1 min, while it takes 3–4 min to develop the white colour.
-
(c)
The shorter is the reduction time, the higher are the concentration and motility and the better are the semen samples.

Points to Ponder
-
(a)
False results may be due to contamination by bacteria, epithelial cells or leucocytes.
-
(b)
Always use sterilized glassware and solutions.
-
(c)
Colour change is also influenced by presence of sugars and lipids in extender.
-
(d)
The resazurin test may be a valuable time-saving tool if properly conducted and intelligently interpreted, but should be supplemented by microscopic examination.
10.3.4 Resazurin Reduction Test: Quantitative
Although determination of resazurin reduction in the semen provides useful means of assessing semen quality and is simple and easy to perform, this assay being subjective has possibilities of human error in interpretation of results. Therefore, an objective assay modified for bovine semen involving similar principle of extent of resazurin reduction but measured using spectrophotometer [17] is described here.
Materials
Resazurin dye (sodium salt), normal saline solution (NSS), spectrophotometer
Resazurin Solution
-
50 mg resazurin.
-
Dilute to 100 mL NSS.
Procedure
-
(a)
Take 1 mL of paired test semen in two glass test tubes.
-
(b)
To the above, add 50 μL of resazurin solution.
-
(c)
The tube is placed in a switched-off water bath at 48 °C in an upright manner.
-
(d)
Monitor the temperature of water bath using thermometer for 1 h.
-
(e)
After 1 h, the temperature of water bath is reduced to 34 °C.
-
(f)
The developed colour in the test tube is matched with chart of 11 colours ranging from pink (grade 11, strongest reduction of resazurin) to dark purple (grade 1, weakest reduction). This is visual observation.
-
(g)
In the second step, the extent of resazurin reduction to resorufin is further subjected to spectrophotometric analysis.
-
(h)
After incubation of the sample as above (a–g), centrifuge the sample at 3000 g for 10 min.
-
(i)
Pipette the supernatant on another test tube and dilute with NSS at 1:5 ratio.
-
(j)
The wavelengths for measuring the optical density (OD) for resazurin (blue) and resorufin (pink) are 600 nm and 572 nm.
-
(k)
Read the OD of the sample at these two wavelengths simultaneously.
-
(l)
Use the ratio thus obtained as a probe to distinguish grades of test semen.
Observations
It is better to prepare a chart depicting relationship of various grades (good or poor) of quality semen with OD ratio. Compare test sample results with prepared chart.
Interpretations
-
(a)
True positive could be calculated as percentage of samples with 10 × 109 sperm, motility ≥70% (resazurin grades 5–11) and absorbance ratio of ≥2.25 that produced positive colour in the RRT.
-
(b)
The sensitivity (Se) of the test is defined as its ability to detect the reduction of resazurin from blue to pink and hence calculated as
where TP are true positives and TN are true negatives.
-
(c)
Similarly, specificity (Sp) is defined as the capacity of the test to avoid false positive and hence calculated as
Points to Ponder
Always use sterilized glassware for the test.
10.3.5 Fructose Content of Semen
The principle sugar present in the semen is fructose, secreted mainly by seminal vesicle (bull and ram). Testosterone is the hormone controlling production of fructose from glucose, sorbitol being intermediate compound. One of the most important markers for the seminal vesicular function is the concentration of fructose in seminal plasma. A normally functioning seminal vesicle is essential for maintain appreciable level of fertility. It has been shown that with decreasing function of seminal vesicle, semen coagulation, sperm motility, stability of sperm chromatin and semen immune protection are affected [29].
It is an important and preferential nutrient for the sperm cells; therefore, fructolysis has direct correlation with the metabolic activity of spermatozoa. Production of energy, fructolysis, is the main metabolic activity performed anaerobically by the bull and ram spermatozoa under anaerobic conditions to produce metabolic energy:
There are several assays by which fructose utilization of spermatozoa is evaluated. For example, rate of lactic acid accumulation (change in the pH over period) gives qualitative indication about fructolysis. Several other protocols measure actual utilization of fructose (rate of fructose disappearance) by a given number of spermatozoa over a fixed period (before and after). The rate of fructolysis of bull sperm is about 2 mg fructose per h for 109 sperm, equivalent to 1.8 × l06 molecules of fructose per second per sperm [30] (Table 10.3).
The parameters by which fructose content of a semen sample is used to estimate the metabolic activity of spermatozoa are:
Parameters
-
Fructose concentration
-
Fructose disappearance (FD) rate
-
Fructolysis index (FI)
The assays that are employed to determine fructose content are:
Assays
-
(a)
Colorimetric protocols
-
Based on ammonium molybdate reaction
-
Based on resorcinol reaction
-
Base on indole reaction
-
-
(b)
Enzymatic assay for determining seminal fructose
-
(c)
Chromatographic assay
-
By thin-layer (paper) chromatography
-
By gas chromatography
-
For fructose estimation, various protocols employing principles of spectrophotometry remain the assay of choice.
Interpretation
In addition to providing information about metabolic activity of spermatozoa in a given semen sample, estimation of fructose content relays a lot of other useful clinical information about the animal from which the sample was taken. Though these references are from human andrology, they hold good for assessing reproductive health of bull and ram as well (Table 10.4).
10.3.5.1 Colorimetric Methods
Preparation of Standard Fructose Solution*
In all of the assays employing colorimetric determination of fructose concentration, ‘standard fructose solution’ (SFS) is required. This can be prepared either in distilled water or in saturated benzoic acid, depending on the assay employed. When SFS is prepared in DW, it should be prepared at least 2 weeks beforehand and stored at 4 °C for future assays. Storing helps the solution to stabilize and ensure accurate results. However, when preparing SFS in saturated benzoic acid, storage period is not mandatory.
Investigation on stability of SFS [19] showed that there was a large variance of OD values within the first 2 weeks and that OD values remained relatively stable within the subsequent 2 weeks, falling quickly from 0.30 to 0.19 within the last 10 days. Fructose, a six-carbon polyhydroxyketone (C6H12O6), has dissymmetry carbon atoms with optical activity, which is mutarotation in water [40]. However, about 2 weeks later, five possible isomers, including types α (levo- and dextrorotation), β (levo- and dextrorotation) and straight chain, achieved a balance, in accordance with specific rotation achieving a balance with relative stability. This was the reason that OD values of standard fructose solution were relatively stable, with a slight variance 2 weeks after preparation. Further, about 4 weeks later, with the weak nucleophilic reagent of water, ketose was transformed into aldose and achieved a balance within a period. In colorimetric assays involving resorcinol, as resorcinol and concentrated hydrochloric acid react with ketose to form more reddish compound than with aldose, OD value would decrease rapidly within the last 10 days.
For these reasons, in order to gain accurate and reliable seminal fructose concentration, SFS prepared in water should be stabilized by storing it for 2 weeks before use. It can then be used for 10 days and subsequently discarded when the decrease in OD value is evident.
10.3.5.1.1 Ammonium Molybdate Reaction
Principle
This is based on the biochemical reaction in which blue colour develops when ammonium molybdate is added in the semen sample containing fructose and heated. The intensity of this colour development depends upon fructose concentration in the sample. Barakat and El-Sawaf first described the assay in 1964 [20]. This protocol is very sensitive and can be used to determine accurate concentrations of fructose as low as 20 μg/dL. Moreover, the experimental error does not exceed ±2%. This method is recommended for the estimation of seminal fructose for its accuracy and simplicity. However, presence of citric or ascorbic acid in the seminal plasma can react with the reagent, resulting in development of false blue colour. The neutralization of citric or ascorbic acid is achieved by adding manganese dioxide. The presence of seminal proteins also interferes with the OD values. Hence, at the beginning of this procedure, trichloroacetic acid is added to precipitate the proteins.
Materials
Sodium citrate 2.9%, trichloroacetic acid (TCA) solution 10%, manganese dioxide, ammonium molybdate reagent, SFS
Ammonium Molybdate Reagent
-
70 mL ammonium molybdate (8%)
-
60 mL H2SO4 (10%)
-
70 mL HCl (5%)
Standard Fructose Solution (0.4% Stock)
-
40 mg fructose.
-
Dilute to 10 mL DW.
Procedure
-
(a)
Determine sperm cell concentration and motility in the given semen sample.
-
(b)
Dilute the sample 1:1 with sodium citrate (2.9%, 0.4 mL each).
-
(c)
Take 0.1 mL from the above mixture in a test tube (marked 1), and incubate the rest in water bath at 37 °C under anaerobic conditions (CO2 incubator).
-
(d)
Add 3.9 mL TCA (10%) to 0.1 mL of the semen (marked 1) to precipitate the protein.
-
(e)
Add 0.2 g of manganese dioxide to get rid of citric acid.
-
(f)
Filter the mixture and take 2 mL of filtrate.
-
(g)
Add 8 mL of the freshly prepared ammonium molybdate reagent.
-
(h)
Keep the tube in the water bath at 85 °C for 10 min and allow to cool.
-
(i)
Estimate the OD of the developed colour using spectrophotometer (540 nm filter).
-
(j)
Plot the measured OD of sample against the standard curve and determine the concentration of fructose.
-
(k)
To obtain total fructose amounts, multiply the result with the total volume of the semen sample or seminal plasma.
Preparation of Standard Fructose* Curve
-
(a)
Prepare standard fructose solution at least 2 weeks in advance.
-
(b)
Take a set of nine tubes and mark them serially 1–9 (8 + 1, for SFS and blank, respectively).
-
(c)
Add 0.25, 0.5, 0.75, 1.0, 1.25, 1.5…2.0 mL of SFS to tubes marked 1–8.
-
(d)
Using DW, make up the volume to 2 mL.
-
(e)
In the tube marked 9, add 2 mL of DW.
-
(f)
Add 8 mL of ammonium molybdate reagent to tubes 1–9.
-
(g)
Now tubes 1–8 contain 1, 2, 3, 4, 5, 6, 7 and 8 mg of fructose/10 mL of solution, respectively, whereas the ninth tube is blank.
-
(h)
Keep all nine tubes in the water bath at 85 °C for 10 min and allow to cool.
-
(i)
Using blank, set the spectrophotometer reading to zero at 540 nM.
-
(j)
Now take OD of all eight tubes, and draw a standard calibration curve.
Fructose Concentration
Estimation of fructose concentration in a given sample is arrived at by deriving value from standard fructose curve as given before.
TCA solution is toxic and may cause severe burns. Always wear protective clothing when handling this reagent (gloves, lab vest, eye/face protection).
Fructose Disappearance (FD) Rate
To determine fructose disappearance, take 0.1 mL of semen from the sample in the beginning of the above protocol and store under anaerobic condition at 37 °C for 1 h. Thereafter, repeat the experiment as the above. The value thus obtained is expressed as fructose concentration (mg/dL) after 1 h. In FD assay, the amount of fructose disappeared is the quantity consumed by the motile sperm present in decilitres (dL) of the semen sample:
where
-
FD = …mg/number of motile sperm in dL
-
IFC = initial fructose concentration (mg/dL)
-
FC 1H = fructose concentration (mg/dL) after 1 h
Fructolysis Index (FI)
It is determined by measuring the disappearance of sugars and accumulation of lactic acid by a defined number of spermatozoa in a specific conditions and time. The fructolysis index determines mg of fructose utilized, or lactic acid produced, by 109 motile spermatozoa in 1 h, at 37 °C. The rate of fructose disappearance forms a convenient measure of sperm fructolysis. The normal rate of fructolysis in bull semen is 1.4–2 mg fructose per 109 sperm cells in 1 h at 37 °C. At this high level, it can be maintained until almost the whole reserve of fructose has been exhausted. A reduced rate of fructolysis is found in low-quality semen of subfertile and infertile animals (e.g. azoospermic bulls). FI is calculated by the following formula:
where
-
FI = …/109 motile sperm kept at 37 °C for 1 h
FI is a slow test and is not frequently used in semen laboratories. Mann [41] for the first time proposed fructolysis as an index for evaluating the activity of semen.
Interpretation
The fructose concentration of a sample is expressed as mg/dL. In this assay, the fructose concentration is determined in 2 mL filtrate by multiplying with 4.0. The initial fructose concentration in the semen sample provides good indication about the activity of the vesicular gland and/or androgenic activity of the testis. The initial fructose concentration in the bull semen is about 500–800 mg/dL. The average FI calculated for ram and bull ejaculate is 1.2:2 mg/109 motile sperm kept at 37 °C for 1 h. The FI can be calculated at a regular interval of 0, 1, 2 and 3 h also. The results would provide comprehensive information of fructose metabolism for a given sample [42].
Points to Ponder
-
(a)
The standard fructose* curve may be prepared using further diluted SFS depending upon the predicted value of fructose in any given sample.
-
(b)
Always standardize the standing time of semen. With the longer standing time, consumption of fructose from the sample will be more.
10.3.5.1.1.1 Resorcinol Reaction: 1
The protocol developed by [21] for fructose estimation in semen sample is as follows:
Principle
This assay is based on the reaction of seminal fructose with resorcinol in concentrated HCl solution to form a red compound under heating. The method is the assay of choice for its simplicity, high specificity and cost-effectiveness [19].
Materials
0.15 M barium hydroxide solution, 0.175 M zinc sulphate solution, 8.74 mM resorcinol solution, 10 M hydrochloric acid.
Barium Hydroxide Solution (0.15 M)
-
257 mg barium hydroxide (Ba(OH)2).
-
Dilute to 10 mL DW.
Zinc Sulphate Solution (0.175 M)
-
283 mg zinc sulphate (ZnSO4).
-
Dilute to 10 mL DW.
Resorcinol Solution (8.74 mM)
-
9.333 mg resorcinol (colourless crystalline solid).
-
Dilute to 10 mL DW.
Hydrochloric Acid (10 M)
-
10 mL HCl (32%) solution
SFS (0.4% Stock)
-
40 mg fructose.
-
Make up the volume to 10 mL DW.
Procedure
-
(a)
Determine sperm cell concentration and motility in the given semen sample.
-
(b)
Dilute 0.1 mL of semen sample with 2.9 mL of DW in tube marked ‘T’.
-
(c)
Add to it 0.5 mL each of barium hydroxide and zinc sulphate solutions.
-
(d)
Mix thoroughly, and allow it to stand for 5 min to remove seminal proteins.
-
(e)
Centrifuge the content at 3000 g for 15 min.
-
(f)
Take 1 mL of the supernatant for fructose estimation.
-
(g)
Take 1 mL of SFS (tube S, standard).
-
(h)
For blank, take 1 mL of DW in another test tube (tube B).
-
(i)
Add 1 mL of resorcinol solution and 3 mL of HCl to all the three tubes.
-
(j)
Maintain at 90 °C for 10 min.
-
(k)
Read OD value at 490 nm against blank.
Determination of Fructose Concentration in Sperm Suspension
Sometimes investigations require determination of fructose concentration in sperm suspension or in seminal plasma after freezing-thawing. The following procedures described by [19] can be followed in such cases. However, it should be noted that sperm cells per se do not contain fructose:
-
(a)
Take fresh semen sample.
-
(b)
Wash the sample twice using NSS.
-
(c)
Prepare sperm suspension of various concentrations.
-
(d)
Follow the procedure given above to determine fructose concentration.
Determination of Fructose Concentration in Seminal Plasma After Freezing-Thawing
This assay is employed to determine effects of cryopreservation on the fructose concentration in a given semen sample. Investigations have revealed that freezing-thawing had no influence on seminal fructose concentration. However, determination of fructose concentration in seminal plasma post-thaw could serve as a quality control product for determination of seminal fructose concentrations in different samples:
-
(a)
Take 2.5 mL of fresh semen sample.
-
(b)
Centrifuge it at 3000 g for 15 min to remove sperm cells.
-
(c)
Confirm by CASA/microscope that no sperm remains in the supernatant.
-
(d)
Freeze the supernatant at −20 °C for 20 days.
-
(e)
Every 48 h, take out 0.1 mL of sample, thaw, and estimate fructose concentration.
-
(f)
Re-thaw the remaining sample and repeat process as per need of the investigation.
-
(g)
Follow the procedure given above to determine fructose concentration.
Monitoring Stability of Standard Fructose Solution
-
(a)
Prepare 100 mL of stock fructose solution of known concentration.
-
(b)
From this, prepare 35 paired fructose solutions of 1 mL each and store at 4 °C.
-
(c)
Number them as (1,1), (2,2), (3,3) and so on.
-
(d)
Monitor the stability of SFS continuously for 35 days.
-
(e)
Eachday, transfer 1 mL of standard fructose solution, 1 mL of resorcinol solution (8.47 mmol/L) and 3 mL of HCL (10 mol/L) in another glass tube and mix well.
-
(f)
Repeat the process for paired fructose solution.
-
(g)
Maintain the paired prepared solution at 90 °C for 10 min.
-
(h)
For blank, replace standard fructose solution with DW and repeat as the above.
-
(i)
Read the OD values at 490 nm against blank.
-
(j)
Repeat the process for 35 days continuously.
Observations
Development of brown colour indicates production of lactic acid.
Calculation
Points to Ponder
-
(a)
Assays for fructose estimation to evaluate function of seminal vesicles should be performed within 3 h after ejaculation [43].
-
(b)
Alternately, remove spermatozoa cells from the semen sample to ensure accuracy of seminal fructose determination.
10.3.5.1.1.2 Resorcinol Reaction: 2
The protocol for determination of seminal fructose suggested by Mann [30] is given below.
Materials
Phosphate buffer saline (0.25 M, pH 7.4), zinc sulphate solution (2%), NaOH solution (N/10), resorcinol (0.1% in ethanol), hydrochloric acid (30%), benzoic acid (saturated), electric colorimeter
Phosphate Buffer Saline (PBS, 0.25 M, pH 7.4)
Standard Fructose Solution (0.4% Stock)
-
400 mg fructose.
-
Dilute to 100 mL saturated benzoic acid.
Procedure
-
(a)
Make semen-buffer mixture by diluting 0.4 mL of neat semen with 0.6 mL PBS in a test tube.
-
(b)
From the above tube, take 0.5 mL of diluted semen and mix with 1.5 mL of DW.
-
(c)
To the above mixture, add 1 mL of 2% zinc sulphate solution and 1 mL of N/10 NaOH solution for deproteinization (0-h sample, A).
-
(d)
Incubate semen-buffer mixture (‘as described in step a’, 0.5 mL) at 37 °C for 1 h and then add 1.5 mL of DW.
-
(e)
After incubation, deproteinize it as in ‘step c’ (1-h sample, B).
-
(f)
Heat the deproteinized samples A and B in boiling water bath for 1 min.
-
(g)
Cool and filter both the samples.
-
(h)
Take 0.5 mL of above filtrate in two separate tubes, marked again as A and B, respectively, and make the volume to 2 mL with DW.
-
(i)
Add 2 mL of 0.1% resorcinol in ethanol and add 6 mL of 30% HCl to each tube.
-
(j)
Mix the content properly and keep the samples in water bath at 80 °C for 10 min.
-
(k)
Immediately cool the contents to room temperature in running water.
-
(l)
After cooling, a reddish brown colour develops in the solutions.
-
(m)
Compare the intensity of colour with the help of colorimeter at 540 nm with a standard fructose solution of equal volumes plotted on a graph.
Preparation of Blank Solution
-
(a)
For blank, take 2 mL of DW in a tube marked blank (C).
-
(b)
Now repeat the steps c–k, even though there is no sample containing fructose. This is done to achieve highest degree of accuracy.
-
(c)
Using blank (C), set the spectrophotometer reading to zero.
Preparation of Fructose Solution for ‘Standard Curve’
-
(a)
Mark ten glass tubes from 1 to 10.
-
(b)
In the first tube, take 5 mL each of ‘standard fructose solution’ and saturated benzoic acid
-
(c)
Make a serial dilution up to ten tubes, that is, transfer 5 mL of solution from tube 1 to tube 2 and make up the volume to 10 mL using saturated benzoic acid.
-
(d)
Repeat the process for the next eight tubes.
-
(e)
Set the spectrophotometer reading to zero using blank ‘C’.
-
(f)
Take OD of all ten tubes at 540 nm. Plot a ‘standard curve’.
Preparation of Standard Fructose Solution
-
(a)
The fructose solution of 0.1 and 0.2% is prepared for comparison with 0 and 1 h samples, respectively.
-
(b)
For this, take two marked tubes (D and E).
-
(c)
Add 2.5 and 5.0 mL of ‘standard fructose solution’ in two tubes, and volume is made up to 10 mL using saturated benzoic acid.
-
(d)
Take the OD reading at 540 nm as the above.
Observations
Development of brown colour in the solution indicates production of lactic acid. The amount of fructose present in semen immediately after collection and 1-h incubation is worked out. The difference between the two concentrations of fructose is because of fructolysis in 1 h. This method is useful and provides a true comparison of metabolic activities of semen samples.
Calculations
-
By Formula
The following formula is applied to calculate concentration of unknown sample:
where
-
Unknown sample = A or B
-
Standard sample = D or E
-
Using ‘Standard Curve’
-
Prepare a standard curve as given above.
-
Take unknown sample and subject it to procedures a–k above.
-
Take OD of the test sample and calculate fructose concentration by plotting in the ‘standard curve’.
-
Points to Ponder
This assay gives satisfactory results if the proportions of the solutions used for deproteinizing, i.e. zinc sulphate and sodium hydroxide, are carefully adjusted to yield mixtures of pH 7.4–7.5.
10.3.5.1.2 Indole Reaction
This assay is commonly employed for fructose estimation in human semen [23] but is equally good for bovine semen as well.
Principle
When fructose is mixed with indole and heated, a complex is produced which absorbs light at 470–490 nm wavelength.
Materials
Tricarboxylic acid (TCA), concentrated HCl (32%), indole, sodium hydroxide (0.5 M), fructose standard, photometer, pipette, tips, centrifuge and tubes, Eppendorf tubes, water bath
Sodium Hydroxide (0.5 M)
-
2 g sodium hydroxide crystals.
-
Dilute to 100 mL DW.
Standard Fructose Solution*
-
3 mg fructose.
-
Dilute to 3 mL DW.
Preparation of Fructose Solution for Curve
-
(a)
Take six tubes marked A to F serially
-
(b)
Add 10, 20, 30, 40, 50 and 60 μL of SFS to each of the tubes
-
(c)
Make up the volume to 100 μL using DW
Procedure
-
(a)
Prepare SFS 2 weeks in advance as described earlier.
-
(b)
Estimate the number of live sperm cells in the test semen sample.
-
(c)
Take 100 μL each of test sample (G) in a tube.
-
(d)
Add 0.5 mL of TCA to tubes A–G and mix well.
-
(e)
Centrifuge at 1000 g for 10 min
-
(f)
Pipette 20 μL of supernatant from the above tubes in the next set of tubes also marked A–G.
-
(g)
For blank, take 20 μL of DW in another tube marked H.
-
(h)
Add 200 μL of concentrated HCl (32%) and 20 μL of indole to each of the tubes.
-
(i)
Seal the tubes and incubate at 37 °C for 30 min in a water bath.
-
(j)
Add 200 μL of sodium hydroxide solution to stop colour reaction.
-
(k)
Take spectrophotometer reading or pipette 200 μL into an empty well of plate reader and take OD value at 470–490 nm.
-
(l)
Set the spectrophotometer reading to 0 using blank.
-
(m)
Using OD value of tubes A–F, plot a graph against known fructose concentrations.
-
(n)
Standard curve is plotted by taking OD value on y-axis and respective fructose concentration on x-axis.
-
(o)
Fructose concentration of test sample G is determined from this graph.
Points to Ponder
-
(a)
TCA and HCl solutions cause severe burn.
-
(b)
Never add water to concentrated HCl.
-
(c)
Indole is highly inflammable.
10.3.5.2 Enzymatic Assay for Determining Seminal Fructose
A modified rapid and quantitative enzymatic assay to determine seminal fructose concentration described by Anderson et al. [22] is given below.
Principle
The protocol is based on reduction of fructose by an enzyme sorbitol dehydrogenase with the concomitant oxidation of NADH. The reduced form of nicotinamide adenine dinucleotide (NAD) is termed as NADH, whereas oxidized form is NAD+. The initial rate of NADH (a flavoprotein containing iron-sulphur centre) oxidation, which is proportional to the fructose content of seminal plasma, can be measured either with a recording spectrophotometer or by conventional two-point kinetic assay. The assay is reported to be more precise, sensitive and rapid than resorcinol method [22]. The procedure is recommended for both research and clinical use.
Materials
Sorbitol dehydrogenase, sodium phosphate monobasic, NADH
Sorbitol Dehydrogenase Preparation (pH 6.8)
-
10 μg of sorbitol dehydrogenase.
-
12 mg sodium phosphate monobasic (NaH2PO4, 0.1 M).
-
Dilute to 1 mL of DW.
Reaction Mixture
-
1.06 mg NADH (reduced sodium salt, 1.5 mM).
-
Dilute to 1 mL of sorbitol dehydrogenase preparation.
Procedure
-
(a)
Prepare SFS 2 weeks in advance as described before.
-
(b)
Take semen sample in a cryovial and centrifuge (5000 g) at 5 °C for 10 min.
-
(c)
Carefully pipette 100 μL of supernatant to another test tube and make up the volume to 0.5 mL using DW.
-
(d)
Place the tube in a boiling water bath for 7 min.
-
(e)
Centrifuge the above sample (2500 g) for 10 min to remove the precipitated material.
-
(f)
Take 100 μL of supernatant to another test tube and make up the volume to 1 mL using reaction mixture.
-
(g)
Repeat the procedure for SFS.
-
(h)
Determine the concentration of fructose by comparing the initial rate of decrease in absorbance of test and standard at 340 nm (25 °C).
-
(i)
Alternate quantitative seminal fructose by two-point kinetic assay.
-
(j)
In this protocol, OD values are taken at 0 (as above), 3 and 23 min.
-
(k)
Compare the total change in absorbance at 340 nm with that for fructose standard.
Calculation
By this protocol, the concentration of seminal fructose in bull was found as 30 ± 1 mmol/L.
10.3.5.3 Chromatographic Assay: By Thin-Layer (Paper) or Gas Chromatography
Most frequently used chromatographic techniques for separation of sugar mixtures are paper chromatography and thin-layer chromatography (TLC).
Thin-layer chromatography consists of the absorbant spread over an inert flat support usually glass or rigid plastic film. The layer is usually stabilized by incorporating a binding agent such as plaster of Paris (10%), and plates may be prepared by shaking mixtures of the absorbent and the binding agent with an appropriate volume of water. A uniform layer of the mixture (slurry) is spread over a clean plate and allowed to dry in an oven and stored in a desiccator. Nowadays, prepared plates coated with adsorbent are commercially available. There are many different ways in which chromatograms are run: ascending, descending, one dimensional, circular or horizontal and two dimensional.
The principle and procedures of paper chromatography for fructose identification are described below.
Principle
Chromatography (a word originally coined by Tswett in 1906) is a technique based on separation of the components of an unknown mixture by partitioning between two phases, one of which is stationary and the other is mobile, and the mixture to be separated is partially soluble in one phase whereas fully soluble in the other phase [44]. The British workers Consden, Gordon and Martin [45] carried out the early work on paper chromatography. Partridge [46] demonstrated that chromatography could be successfully applied to the separation and identification of carbohydrate mixtures.
The commercially available chromatography papers have variable speed of slow, medium or fast in their running characteristics. The mixture, in this case semen sample, suitably diluted, to be analysed is spotted on the paper. Dried and suitable solvent is allowed to flow along the sheet in ascending, descending or radial direction depending upon the available chamber and the sample to be analysed. The solvent front is marked and the paper is subjected to suitable reaction to develop chromatograph. The Rf value, i.e. ratio of the distance travelled by the dissolved solute over the solvent front, is more or less constant for a specific set of experiment and condition for a specific compound.
Rf = distance travelled by solute/distance travelled by solvent front
A modified paper chromatographic protocol to identify the presence of fructose [44] is given below.
Materials
Ethyl acetate, pyridine, fructose, aniline, acetone, phosphoric acid, glacial acetic acid, chromatographic chamber
Standard Fructose Solution
-
100 mg fructose.
-
Dilute to 1 mL DW.
Pre-saturation of Chromatographic Chamber
-
In chromatographic chamber, fill the boats with ethyl acetate/pyridine/water (12:5:4 by volume) solvent system.
-
Take a 300 mL of solvent in a beaker and place in the chamber overnight to pre-saturate it.
Solution A
-
13 mL aniline
-
800 mL acetone
Solution B
-
18 mL phosphoric acid
-
200 mL glacial acetic acid
Locating Agent (Alkaline Phosphoric Acid)
-
10 mL solution B
-
40 mL solution A
Procedure
-
(a)
Cut the chromatography paper (Whatman no. 1) according to the size of the chromatographic chamber.
-
(b)
Draw a base line with pencil parallel to the bottom edge of the paper about 5 cm distance from the top edge of the paper.
-
(c)
On the paper, mark two small circles evenly spaced with outer most mark at least 3 cm away from the edge of the paper on either sides.
-
(d)
Number the marks as SF (standard fructose) and T (test). The test sample can be many.
-
(e)
With the help of a pipette, place by capillary action 10 μL of ST on the designated mark.
-
(f)
Repeat the process for test sample(s). Allow the marks to dry.
-
(g)
Mount the chromatography paper in the chromatographic chamber saturated with solvent.
-
(h)
Allow the solvent to run up to 8–10 h or till the solvent front reaches the bottom end.
-
(i)
Mark the solvent front, and keep it from drying at room temperature by hanging.
Identification of Fructose in Test Sample
-
(a)
Take a fume cupboard, fill a plastic tray with locating solution, and pass each chromatogram once through the tray.
-
(b)
Hang the wet paper in fume cupboard and allow it to air dry.
-
(c)
Now keep the dried paper in hot air oven at 100–110 °C for 5 min.
-
(d)
Circle the spots carefully.
Observations
-
(a)
The sugar spot (ST) appears brown on a nearly colourless background.
-
(b)
The test spots (T) will also brown if fructose is present.
-
(c)
Other sugars such as glucose, maltose, sucrose and galactose will also produce brown spots if present in sample.
Calculation
Calculate Rf value by measuring the distance travelled by individual sugars divided by the distance travelled by solvent front. In the chromatogram, on the basis of distance travelled by each sugar in (in this case ST), the individual sugar present in the sample (T) can be identified.
Points to Ponder
-
(a)
Do not use ball/ink pen in place of pencil.
-
(b)
Wipe the capillary tube with tissue paper before applying on paper.
-
(c)
The spot of ST and T should be around 5 cm in diameter.
-
(d)
Always prepare locating agent in a dry beaker, and pour solution B first.
-
(e)
If a precipitate is formed while preparing locating agent, mix thoroughly to dissolve.
-
(f)
While dipping the chromatogram in the locating solution, just allow minimum time for wetting only.
-
(g)
Oven should be preheated to achieve a temperature of 100–110 °C.
-
(h)
Immediately circle the spots; otherwise, they may disappear.
10.3.6 Oxygen Uptake by Spermatozoa
Oxygen uptake by sperm is a measure of metabolic activity of live cells. In this assay, ‘respiratory quotient’ (RQ) of spermatozoa is calculated based on the fact that live and active spermatozoa take up higher volume of oxygen per unit of time. The volume of carbon dioxide produced by the volume of oxygen consumed in the given unit of time is measured, and the quotient obtained is called ‘respiratory quotient’ expressed as ZO2 of spermatozoa. Oxygen uptake by known concentration of spermatozoa in a test sample is measured with the help of Warburg respirometer. The average ZO2 value of bull semen is 21. This test indicates activity and live percentage of spermatozoa. The RQ is affected by composition, temperature and pH of the diluent used.
Oxygen uptake can be measured polarographically by using a modified Clark-type oxygen electrode and an oxygraph from Instech Laboratories (Philadelphia, PA, USA). This measures rapid changes in the rate of oxygen consumption by the cell [26]. Many measurements of the rate of respiration of bull sperm have been made, resulting in an average value of 21 μL O2 per h consumed by 100 million sperm [30]. This is equivalent to 1.7 × l06 molecules of O2/h/sperm.
10.3.7 Pyruvate Utilization Test
The pyruvate occupies pivotal position during the metabolic breakdown of the hexoses and other carbohydrates. The rapid oxidation of the pyruvic acid in semen and its preferential utilization as compared to other carbohydrates [47] attest to the importance of pyruvate in sperm metabolism. This assay is based on the observation that in an actively synthesizing tissue, such as the lactating mammary gland, pyruvate is completely oxidized and that its complete oxidation is brought about by 2,4-dinitrophenol (DNP) [48]. Since the DNP is known to inhibit synthetic reactions [49], it was believed that the magnitude of the effect of DNP on the respiration of spermatozoa metabolizing pyruvate might provide a measure of their metabolic vigour based on their synthetic activity. This led Melrose and Terner [27] to suggest that the quality of semen samples could be graded according to the oxygen consumption after the addition of pyruvate and pyruvate + DNP. Fluoride is added to the sample to reduce the exogenous metabolism to a low level. Following addition of pyruvate, the oxygen consumption increases in both high-fertility and low-fertility bull semen, whereas on addition of DNP, the oxygen uptake increases twofold in high-fertility but not in low-fertility bulls. The oxygen uptake is measured with the help of monometric equipment.
Interpretation
Melrose and Terner [27] suggested that pyruvate reduction assay can be used to:
-
(a)
Differentiate bulls producing semen of exceptionally high-quality form that of bulls producing semen of poor fertilizing capacity, which, because of its good appearance and motility, might otherwise be considered satisfactory.
-
(b)
Periodically check on the quality of semen produced by bulls of fluctuating fertility.
-
(c)
This assay may not be applicable in cases of pathological or genetic causes of infertility.
10.4 Background Information
Investigations on the metabolic activity of spermatozoa have always evoked great interest in the minds of many scientists the world over. Despite great interest in this field, a lot is yet to be elucidated concerning physiological process of sperm metabolism as it happens in the male gonads to their concluding point, i.e. at fertilization. Sperm cell metabolism must be studied under experimental conditions that permit accurate measurements to be made of small changes in amount of metabolic fluids (seminal plasma), of exchange between metabolic donators and acceptors and interactions among varying concentration of metabolites and spermatozoa and of minute gaseous exchange between sperm cell and immediate environment. While performing experiments, such measurements often require separation of spermatozoa from their normal physiological environment to an artificially produced condition that can easily be controlled and at the same time mimics normal physiological conditions. However, this need for technical simplicity introduces other complications. For example, many of the substances available in the seminal plasma are either stimulatory or inhibitory of cell metabolism; their interactions are yet to be explored completely. Under such circumstances, investigators are advised to provide enough leverage for either singly or cumulative effect of these factors before arriving at a conclusion.
While investigating metabolic activity of spermatozoa, Nakano [50] was the first scientist to use methylene blue. Resazurin was discovered by Weselsky in 1871 and at first utilized to assess the bacterial content of milk by Pesch in 1929 [Twigg, 51]. Since then, this dye has been used successfully in assessing fertility potential in humans [52], bulls [28], boars [53] and stallions [54]. Using the potential value of the resazurin reduction assay, home kits for the estimation of sperm quality have also been developed (FertilitySCORE, Belgium; Androscore, USA). Considering the disadvantage of using methylene blue and resazurin as a subjective test, several workers have modified the protocol to evaluate colour change using spectrophotometer [17, 55, 56]. This conferred advantage of objective evaluation of results. This chapter includes one such assay. Other workers [16] have reported a strong inverse correlation between the reducing capacity of semen and reactive oxygen species production, therefore suggesting that the resazurin test could possibly reveal the presence of excessive oxidative stress of spermatozoa.
In methylene blue reduction assay, one cannot be sure of the source of hydrogen atom transferred to MB neither be certain that these atoms would have been accepted by oxygen in the normal metabolic pattern. Because of the uncertainties mentioned above, the uptake of oxygen by the spermatozoa in the micro-respirometers may provide information on respiratory activity of spermatozoa. The most commonly used instruments for such purpose is manometers of Warburg or Barcroft type. Recently, O2 electrodes have been used to estimate metabolic activity of spermatozoa [57]. However, as these procedures require sophisticated equipment and other alternate protocols are available, only principal and salient points of protocol for determining oxygen uptake are discussed in this chapter.
Literature Cited
Mann T (1945) Studies on the metabolism of semen: 2. Glycolysis in spermatozoa. Biochem J 39(5):458–465
Harrison RAP (1977) The metabolism of mammalian spermatozoa. In: Greep RO, Koblinsky MA (eds) Frontiers in reproduction and fertility control. MIT Press, Cambridge, pp 379–407
Mann T (1959) Sperm metabolism. In: Metz CB, Monroy A (eds) Fertilization: comparative morphology, biochemistry, and immunology, vol 1. Academic Press, New York, p 114
Bedford JM, Hoskins DD (1990) In: Lamming GE (ed) Marshall’s physiology of reproduction, vol 2. Churchill Livingstone, Edinburg, p 379
Salisbury GW, VanDemark NL, Lodge JR (1985) Physiology of reproduction and artificial insemination of cattle, 2nd edn. WH Freeman and Company, San Francisco, pp 268–274
Salisbury GW, Adkiey WC (1957) Factors influencing metabolic activity of bull spermatozoa. J Dairy Sci 40:1343
Salisbury GW, Graves CN, Nakabayashi NT, Cragle RG (1963) Observations on the aerobic metabolism of bull and goat epididymal spermatozoa. J Reprod Fertil 6:341–349
Beck GH, Salisbury GW (1943) Rapid methods for estimating the quality of bull semen. J Dairy Sci 26:483–494
Chandler JE (1976) The nature of serum agglutination of bovine spermatozoa: a proposed mode of action and its metabolic effects. PhD Dissertation, Virginia Polytechnic Institute and State University, Blacksburg
Witters WL, Foley CW (1976) Effect of selected inhibitors and methylene blue on a possible phosphogluconate pathway in washed boar semen. J Anim Sci 43:159–167
Gassner FX, Hill HJ, Sulzberger L (1952) Relationship of seminal fructose to testis function in the domestic animal. Fertil Steril 3(2):121
Bishop M, Campbell RC, Hancock J, Walton A (1954) Semen characteristics and fertility in the bull. J Agric Sci 44:227
Branton C, James CB, Patrick TE, Newsom MH (1951) The relationship between certain semen quality tests and fertility and the interrelationship of these tests. J Dairy Sci 34:310–316
Chandler JE, Harrison CM, Canal AM (2000) Spermatozoal methylene blue reduction: an indicator of mitochondrial function and its correlation with motility. Theriogenology 54:261–271
Martin LM, Crenshaw CC, Dean JA Jr, Dart MG, Purdy PH, Ericsson SA (1998) Determination of the number of motile sperm within an ovine semen sample using resazurin. Small Ruminant Res 32:161–165
Zalata A, Hafez T, Mahmoud A, Comhaire F (1995) Relationship between resazurin reduction test, reactive oxygen species generation, and c-glutamyltransferase. Hum Reprod 10:1136–1140
Reddy KVR, Bordekar AD (1999) Spectrophotometric analysis of resazurin reduction test and semen quality in men. J Expt Biol 37:782–786
Dart MG, Mesta J, Crenshaw C, Ericsson SA (1994) Modified resazurin reduction test for determining the fertility potential of bovine spermatozoa. Arch Andro 33:71
Lu J, Chen F, Xu H, Huang Y, Lu N (2007) Standardization and quality control for determination of fructose in seminal plasma. J Androl 28(2):207–213
Barakat MZ, El-Sawaf E (1964) The determination of semen fructose. Microchem J 98(2):123–130
Huang YF, Xu RJ (eds) (1999) Nan Ke Zhen Duan Xue [in Chinese]. Shanghai 2nd Military Medical University Press, Shanghai, pp 219–221
Anderson RA Jr, Reddy JM, Oswald C, Zaneveld LJD (1979) Enzymic determination of fructose in seminal plasma by initial rate analysis. Clin Chem 25(10):1780–1782
WHO laboratory manual for the examination and processing of human semen, 5th edn, World Health Organization, 2010
Lewin LM, Beer MS, Lunenfeld B (1977) Paper chromatographic estimation of fructose and myo-inositol in human seminal fluid: a method for evaluating seminal vesicle and prostatic function. Intl J Fertil 22:48–51
Cicero TJ, Bell RD, Wiest WG (1975) Function of the male sex organs in heroin and methadone users. N Engl J Med 292:882–887
Córdoba M, Mora N, Beconi MT (2006) Respiratory burst and NAD(P)H oxidase activity are involved in capacitation of cryopreserved bovine spermatozoa. Theriogenology 4:882–892
Melrose DR, Terner C (1953) The metabolism of pyruvate in bull spermatozoa. Biochem J 53(2):296–305
Erb RE, Ehlers FH (1950) Resazurin reducing times as an indicator of bovine semen fertilizing capacity. J Dairy Sci 32:853
Montagnon D, Valtat B, Vignon F, Koll-Back MH (1990) Secretory proteins of human seminal vesicles and their relationship to lipids and sugars. Andrologia 22:193–205
Mann T (1964) The biochemistry of semen and the male reproductive tract. Methuen and Co, London, pp 37–69. 237–254
Bhosrekar MR (1990) Semen production and artificial insemination. Ajay Offset, Pune
Gassner FX, Hill HJ (1952) Correlation of fructose content of semen and rate of fructolysis to breeding efficiency of bulls. Proceeding of the second international congress of physiology and pathology of animal reproduction and of artificial insemination II: 62
Abdou MSS, El-Guindi MM, El-Menoufy AA, Zaki K (1977) Some biochemical and metabolic aspects of the semen of bovines (Bubalus bubalis and Bos Taurus). Z Tierzucgtg Zuchtgsbiol 95:16–26
Moon KH, Bunge RG (1971) Seminal fructose as an indicator of androgenic activity: critical analysis. Investig Urol 8:373–376
Kise H, Nishioka J, Satoh K, Okuno T, Kawamura J, Suzuki K (2000) Measurement of protein C inhibitor in seminal plasma is useful for detecting agenesis of seminal vesicles or the vas deferens. J Androl 21:207–212
Kumar R, Thulkar S, Kumar V, Jagannathan NR, Gupta NP (2005) Contribution of investigations to the diagnosis of bilateral vas aplasia. ANZ J Surg 75:807–809
Manivannan B, Bhande SS, Panneerdoss S, Sriram S, Lohiya NK (2005) Safety evaluation of long-term vas occlusion with styrene maleic anhydride and its non-invasive reversal on accessory reproductive organs in langurs. Asian J Androl 7:195–204
Carpino A, De Sanctis V, Siciliano L, Maggiolini M, Vivacqua A, Pinamonti A, Sisci D, Ando S (1997) Epididymal and sex accessory gland secretions in transfusion-dependent beta-thalassemic patients: evidence of an impaired prostatic function. Exp Clin Endocrinol Diabetes 105:169–174
Buckett WM, Lewis-Jones DI (2002) Fructose concentrations in seminal plasma from men with nonobstructive azoospermia. Arch Androl 48:23–27
Tan ZH, Jin SH, Li N (eds) (2005) Basic organic chemistry [in Chinese]. Science and Technology Literature Press, Beijing, p 538
Mann T (1948) Fructose content and fructolysis in semen. Practical application in the evaluation of semen quality. J Agr Sci 38:323
Hopwood DA, Bibb MJ, Chater KF, Kieser T, Bruton CJ, Kieser H, Lydiate DJ, Smith CP, Ward JM, Schrempf H (1985) Genetic manipulation of Streptomyces. A Laboratory Manual. The John Innes Foundation, Norwich
Rui H, Morkas L, Purvis K (1986) Time- and temperature-related alterations in seminal plasma constituents after ejaculation. Int J Androl 9:195–200
Srivastava AK (2008) Chromatography of sugars using standard mixtures. In: Saini M (ed) A practical manual of analytical biochemistry. Anupam Press, Bareilly, pp 27–29
Consden R, Gordon AH, Martin AJD (1944) Qualitative analysis of proteins: a partition chromatographic method using paper. Biochem J 38:224–232
Partridge SM (1948) Filter-paper partition chromatography of sugars. Biochem J 42:238
Terner C (1957) Effect of nitrophenols on the metabolism of spermatozoa. Federation Proc 16:261
Terner C (1959) The Effect of 2,4-Dinitrophenol and p-Nitrophenol on the aerobic and anaerobic metabolism of bull spermatozoa. Biochlm et Biophys Acta 36:479
Clifton CE (1952) In: Sumner JB, Myrback K (eds) The Enzymes, 2(2) Academic Press, New York
Nakano H (1930) Med Akad Zu Kyoto 4:174–198
Twigg RS (1945) Oxidation-reduction aspects of resazurin. Nature 155:401–402
Glass RH, Drouin MT, Ericsson SA, Marcoux LJ, Ericsson RJ, Sullivan H (1991) The resazurin reduction test provides an assessment of sperm activity. Fertil Steril 56:743–746
Mesta J, Ericsson SA, Dart MG, Wansley RG, Weyerts PR (1995) Assessment of fertility potential of porcine spermatozoa using the reducible dyes methylene green and resazurin. J Anim Sci 73(Suppl. 1):26
Carter RA, Ericsson SA (1998) Assessing the fertility potential of equine semen samples using the reducible dyes methylene green and resazurin. Archives Androl 40:59–66
Zrimsek P, Kunc J, Kosec M, Mrkun J (2004) Spectrophotometric application of resazurin reduction assay to evaluate boar semen quality. Intl J Androl 27:57–62
El-Battaway KA (2008) Resazurin reduction test as a tool for assessment of rabbit semen quality. 9th world rabbit congress, June 10–13, Verona
Fernandez S, Cordoba M (2016) Progesterone causes metabolic changes involving aminotransferases and creatine kinase in cryopreserved bovine spermatozoa. Anim Reprod Sci 164:90–96
Key References
Salisbury and others. See above [5] In-depth discussion and excellent background information related to physiology of sperm metabolism and application of various assays in determining sperm metabolism
Zalata et al. See above [16] Pointed out relationship of resazurin reduction rate with oxidative stress of spermatozoa
Lu and co-workers. See above [19] Described in detail assay to determine seminal fructose concentration and in sperm suspension, and need to stabilize the standard fructose solution prepared in water
Anderson and co-workers. See above [22] This group of researchers have provided in-depth discussion of enzymatic assay to determine sperm metabolism, with stepwise description of related protocol
Author information
Authors and Affiliations
Corresponding author
Editor information
Editors and Affiliations
Rights and permissions
Copyright information
© 2017 Springer Nature Singapore Pte Ltd.
About this chapter
Cite this chapter
Srivastava, N., Pande, M. (2017). Estimating Metabolic Activity of Spermatozoa. In: Srivastava, N., Pande, M. (eds) Protocols in Semen Biology (Comparing Assays). Springer, Singapore. https://doi.org/10.1007/978-981-10-5200-2_10
Download citation
DOI: https://doi.org/10.1007/978-981-10-5200-2_10
Published:
Publisher Name: Springer, Singapore
Print ISBN: 978-981-10-5199-9
Online ISBN: 978-981-10-5200-2
eBook Packages: Biomedical and Life SciencesBiomedical and Life Sciences (R0)