
Abstract
The provision of urban services, such as potable water supply and safe sewage disposal, is often energy intensive and contributes to overall carbon emissions. Though the prime objective is to improve public health and environmental quality, poorly conceptualized and implemented projects often require, among others, significant amounts of energy, thus negatively affecting the environment. Besides, the high energy-intensive systems become unsustainable and fail to provide the intended benefits. Pumping installations consume large amounts of energy, often determining the overall cost of service provision. Wastage of water in the system further adds to the energy usage and thus carbon emissions. A high proportion of non-revenue water is common in almost all towns across India and other developing countries.
The term “green infrastructure” is thus coined signifying the environmental friendliness. Given the large-scale development the urban sector in India is witnessing, enhancing environmental sustainability is essential. One of the main criteria that determine environmental sustainability is carbon emissions. Going beyond the routine techno-economic studies and integrating green concerns such as potential carbon emissions are essential. This chapter examines energy consumption vis-à-vis carbon emissions from urban water and sewerage infrastructure facilities in three case study towns with diverse characters.
Access provided by Autonomous University of Puebla. Download chapter PDF
Keywords
These keywords were added by machine and not by the authors. This process is experimental and the keywords may be updated as the learning algorithm improves.
13.1 Introduction
Infrastructure is generally defined as basic physical and organizational structures and facilities needed for the operation of community or an enterprise. This chapter focuses on physical infrastructure, such as water supply, sewerage, and storm water drainage, which supports the people in living and performing their activities; is important to human, social, and economic development; and plays a vital role in poverty reduction. Infrastructure also plays a vital role in improving the environment, and in many cases, it is also contributing to the degradation of environment by high resource consumption, generating problematic pollutants, and encroaching into ecologically sensitive areas.
The word “green” is thus prefaced to infrastructure denoting whether or not particular infrastructure facility is comparatively environmental friendly. “Green infrastructure” is an “approach that communities can choose to maintain healthy waters, provide multiple environmental benefits and support sustainable communities. It incorporates both the natural environment and engineered systems to provide clean water, conserve ecosystem values and functions, and provide a wide array of benefits to people and wildlife. Reducing greenhouse gas emissions is one of the key challenges of our generation” (Environmental Protection Agency, USA).
In India, urban areas are home to 31.2 % of total 1.21 billion population (Census 2011); this figure is likely to go up to 50 % by 2030 (World Population Prospects 2008). The urban sector contribution to India’s economic growth is enormous; urban sector contribution to the gross domestic product (GDP) has increased from 29 % in 1950–1951 to 47 % in 1980–1981 and is currently pegged at 62–63 %. The 11th Five-Year Plan (11th FYP) acknowledges urbanization as a key indicator of economic development and should be seen as a positive factor for overall development. The 11th FYP Vision for Urban Infrastructure, Housing, Basic Services, and Poverty Alleviation indicates that “Indian cities to be the locus and engine of economic growth over the next two decades and realization of an ambitious goal of 9–10 % growth in GDP depends fundamentally on making Indian cities much more liveable, inclusive, bankable, and competitive” (Planning Commission, Govt. of India).
Urban infrastructure situation in many urban centers in India is abysmal. Increasing population has put tremendous pressure on already overloaded and inadequate infrastructure facilities. The Government of India embarked on urban infrastructure development, according to high priority, and launched various programs. Many other urban infrastructure programs/projects are in implementation in various states with the assistance of multilateral/bilateral agencies like Asian Development Bank, World Bank, and Japan International Cooperation Agency (JICA). Water supply, wastewater, and drainage infrastructure accorded priority in most of the projects.
It is important to understand green infrastructure concept in the urban sector, which is witnessing large-scale development. One of the main issues with urban basic infrastructure that determines environmental friendliness is the energy usage. It is therefore important to understand the role that energy consumption plays in determining the carbon footprint of infrastructure and to integrate the same in project planning, design, construction, and operation. Consideration of carbon footprint in early stages of project preparation shall go a long way in greening the urban infrastructure in India.
Providing households with safe drinking water and wastewater disposal is an energy-intensive process. Electricity costs are usually between 5 and 30 % of the total operating costs among water and wastewater utilities (WWUs). The share is usually higher in developing countries and can go up to 40 % or more in some countries. Such energy costs often contribute to high and unsustainable operating costs that directly affect the financial health of water and wastewater utilities. Improving energy efficiency (EE) is at the core of measures to reduce operational cost at WWUs. Since energy represents the largest controllable operational expenditure of most WWUs, and many energy efficiency measures have a payback period of less than 5 years, investing in energy efficiency supports quicker and greater expansion of clean water access for the poor by making the system cheaper to operate (Energy Sector Management Assistance Program, World Bank). In this chapter, energy consumption by environmental infrastructure like wastewater treatment and water supply (based on different types of sources) and their contribution to CO2 emissions are discussed and appropriate recommendations are mentioned.
13.1.1 Energy Consumption in Environmental Infrastructure
Generally, energy consumption in water supply system and sewerage mainly involves water pumping including extraction of raw water from source to treatment plants and pumping clear water to service reservoirs, and wastewater pumping includes sewage pumping from pumping stations to sewage treatment plants. Poorly planned and designed systems are high energy intensive (Vigneswaran and Sundaravadivel 2004). Energy-intensive activities in water supply and sewerage are shown in Fig. 13.1.

Energy-intensive activities in water supply and sewerage
13.1.2 Carbon Emissions from Environmental Infrastructure
Carbon emissions from water industry are largely associated with grid electricity use. Key processes consuming electricity are (1) treating water to a potable standard, (2) pumping water around the supply network, (3) pumping wastewater around the sewer network, and (4) treating wastewater to discharge standards.
Carbon emissions associated in supplying drinking water to the public have been assessed based on the type of source like surface water, groundwater, and combination of both surface and groundwater. Pratapgarh, Jalore, and Sri Ganganagar towns in Rajasthan were chosen for the study purpose.
13.1.3 Description of Project Towns
13.1.3.1 Pratapgarh
Pratapgarh is the Tehsil headquarter of Pratapgarh district. The population of the town is 42,079 as per Census 2011. Town is situated at the border of Madhya Pradesh and famous for its opium production. The area of the town is almost undulating and hilly. The water table of the town is about 10–20 m. The climate of the area is dry. The minimum and maximum temperatures of the town are 2–42 °C. The average rainfall of the town is about 900 mm. The first water supply scheme was executed for Pratapgarh town in 1955 with source as three Nos open wells. Due to the reduction in the production from open wells/groundwater sources and increased demand, reorganization scheme was proposed in the year 1994. Surface source, Jakham Dam, was taken as the source of water to meet out the demand of town Pratapgarh. The capacity of Jakham Dam is 5,015 MCFT. At present surface, water is available in sufficient quantity for domestic purposes throughout the year. The quality of surface water in Jakham Dam requires prior treatment for human consumption. Currently, the Public Health Engineering Department is extracting water from Jakham Dam. 2.5 MLD of water is being abstracted from Jakham Dam. A filter plant of 3.6 MLD capacity is under operation to treat the raw water. Raw water is being pumped to clariflocculator along with pre-chlorination (2 ppm) and then to filter beds.
Pratapgarh town has 78 % of storage capacity over daily supply of water. As per the CPHEEO norms, 33 % of storage capacity against total supply of water should require. Pratapgarh has a total storage capacity of 1.94 ML comprising four elevated storage reservoirs (ESR), one ground level storage reservoir (GLSR) and one clear water reservoir (CWR). However, in some zones, the PHED directly pumps into the distribution system from CWR.
At present, the PHED divided ULB area into eight water supply zones. The total length of existing water distribution network in Pratapgarh town is around 36 km, which includes transmission mains, trunk mains, feeder mains, and distribution mains. After the second scheme, PHED extended distribution lines as per the requirement. The existing distribution system covers 72 % of road length. Sixty-five percent of pipe material used in the distribution network is of AC pipe material. Due to this, leakages are very common in the system resulting in energy wastage.
The existing water supply service connections covered 61 % of total property tax assessments in the town (Year 2011). All water connections are metered including commercial and industrial connections. However, 95 % of meters are nonfunctional due to poor maintenance. In total, there are 8,277 domestic and 561 non-domestic water connections and 174 public standposts (Year 2011).
There are 6 pumping stations in the town supplying water to the town. A total of 19 pump sets have been installed during different years. Out of 19 pump sets, three are 25 years old, 13 are 15 years old, and three are 10 years old. Existing pumps are in poor condition and leakages in valves result in high energy consumption. Most of the pumps need immediate replacement. Pumping stations and pumping machinery are installed and function with sufficient capacity to cater to the present-day demand. However, there is no proper account of their efficiency, and there are no measures seem taken to ensure that they are operated at an optimum level. Pumps/motors reporting efficiencies lesser than 50 % shall be replaced in phased manner.
13.1.3.2 Jalore
Jalore town is the district headquarters and has a population of 54,081 persons as per Census 2011. Jalore is situated in the southwestern part of Rajasthan State. The district shares boundary with Barmer district in the northwest, Pali district in the northeast, and Sirohi district in the southwest and shares border with Gujarat in the south. The temperature in Jalore would reach as high as 48 °C in the summer and as low as 2 °C during winter. In summer months, humidity remains relatively very low. The average annual rainfall of the Jalore is about 389 mm.
Groundwater is the major available source for catering to the drinking water needs to Jalore town. Hence, the municipality is depending on groundwater source.Footnote 1 At present, groundwater is available in sufficient quantity for domestic purposes at depth around 50–230 m throughout the year.
Currently, the PHED is extracting water from 25 tube wells and 2 open wells. 5.1 MLD of water is abstracted from these tube wells and open wells. The average yield of each tube well is 0.2 ML per day and each tube well is operated for 20 h in a day. The tube wells are fitted with submersible pumps with a head of 75 m.
There are 6 pumping stations in the town to supply water to the town. A total of 22 pump sets have been installed during different years. Out of 22 pump sets, three are 30 years old, five pumps are 22 years old, and the remaining are 10 years old. Existing pumps are in poor condition and leakages in valves. Due to this, high energy is being consumed. Most of the pumps need immediate replacement. Pumping stations and pumping machinery are installed and functioning with sufficient capacity to cater to the present-day demand. However, there is no proper account of their efficiency, and there are no measures seem taken to ensure that they are operated at an optimum level. Pumps/motors reporting efficiencies lesser than 50 % need replacement in a phased manner. Some of the existing pump sets are having efficiency around 35–40 %. Suction and delivery valves are also throttled at some locations.
Jalore is having 126 % of storage capacity over daily supply of water. As per the CPHEEO norms, 33 % of storage capacity against total supply of water is enough. Jalore has a total storage capacity of 6.44 ML comprising 9 elevated storage reservoirs (ESR) and 7 clear water reservoirs (CWR). At present, the PHED has divided the ULB area into 24 water supply zones. The total length of existing water distribution network in Jalore town is around 363 km, which includes transmission mains, trunk mains, feeder mains, and distribution mains. The existing distribution system covers 90 % of the town area. Eighty percent of pipe used in the distribution network is of AC pipe material. Due to this, leakages are very common in the system resulting in energy wastage.
PHED delivers water to the civic through service connections and public standposts. Thirty-nine percent of total assessed properties in the town have been provided with water supply connections. All water connections are metered including commercial and industrial connections. However, 66.7 % of meters are nonfunctional due to poor maintenance. In total, there are 3,345 domestic and 751 non-domestic water connections and 20 public standposts (2011).
13.1.3.3 Sri Ganganagar
Sri Ganganagar, the district headquarters, is situated toward the northernmost part of the State. The town is situated at the point where the Satluj Waters enter the Rajasthan State. It is the largest urban center in the canal irrigated area of northern west of Rajasthan. Sri Ganganagar Municipal Council has a population of 2.38 lakhs (Census 2011) which accounts for 44 % of the total urban population in the district. The climate of Sri Ganganagar is generally hot and arid with extreme conditions. In summers, the temperature reaches up to 50 °C, while in winters, the temperature dips just around 0 °C. The average maximum temperature in summer is 41.2 °C, while in winter, it is 6 °C. Sri Ganganagar receives an average annual rainfall of about 300 mm. The maximum rainfall is received during the months of June to September.
The first water supply scheme was executed for Sri Ganganagar Town in 1954 and commissioned in the year 1959 taking Gang Canal as the source of water. Both surface water and groundwater source are available for serving drinking water needs to Sri Ganganagar town. Currently, the PHED is extracting water from two surface water sources and 7 tube wells. 32 MLD of water from surface sources and around 6 MLD water from 7 tube wells are extracted. The average yield of each tube well is 0.85 ML per day, and each tube well is operated for an average of 18 h per day. The tube wells are fitted with submersible pump.
Two water treatment plants having a total capacity of 42 MLD are under operation to treat the raw water. Raw water is pumped to rapid gravity and slow sand filters after pre-chlorination (2 ppm). Post-chlorination (3 ppm) is carried out before transmitting to clear water reservoir and then pumped to Over Head Service Reservoir (OHSRs). There are 13 filter beds and recycling tank in WTP.
Sri Ganganagar has 53 % of storage capacity over daily supply of water. As per the CPHEEO norms, there should be 33 % of storage capacity against total supply. Ganganagar has 18 elevated storage reservoirs (ESR) and 13 clear water reservoirs (CWR).
At present, the PHED has divided ULB area into 18 water supply zones. The total length of the existing water distribution network in Sri Ganganagar town is around 709 km, which includes transmission mains, rising mains, feeder mains, and distribution mains. After the implementation of the second scheme, PHED extended distribution lines as per the requirement. The existing distribution system covers 80 % of road length. The material used for pipe diameter below 150 mm was PVC, AC, and CI &GI, and more than 150 mm AC and PVC material. Eighty-five percent of pipe used in the distribution network is of AC pipe material. Due to this, leakages are very common in the system resulting in energy wastage.
There are 15 pumping stations in the town to supply water. Existing pumps are in poor condition and leakages in valves. Due to this, high energy is being consumed. Most of the pumps need immediate replacement. Pumping stations and pumping machinery are installed and function with sufficient capacity to cater to the present-day demand. However, there is no proper account of their efficiency and there are no measures seem taken to ensure that they are operated at an optimum level. Pumps/motors reporting efficiencies lesser than 50 % need replacement in phased manner. Static head is higher at some locations. This also results in high energy consumption.
All water connections are metered including commercial and industrial connections. In total, there are 30,140 domestic and 5,266 non-domestic water connections (Year 2011). The PHED is serving potable water to 80 % of Ganganagar population.
13.2 Reasons for High Energy Consumption in the Towns
The following are the reasons for high energy consumption in the towns:
-
1.
Transmission and distribution losses: Around 65–85 % of the water supply network in the three towns is of AC pipe material. Due to this, leakages are common in all the towns which results in low consumer end supply and energy losses.
-
2.
High storage capacity: As per CPHEEO norms, 33 % storage capacity is sufficient enough against the total production. But in the three towns, storage capacity is more than 53 %. Highest storage capacity is in Jalore which is 126 % and followed by Pratapgarh of 78 %. Due to lack of comprehensive planning, high storage capacity has been provided in the town. High storage capacity results in intensive energy consumption to pump the clear water from treatment plant to service reservoirs located at different parts of the town. Figure 13.2 shows the existing storage capacity in three towns.
Fig. 13.2 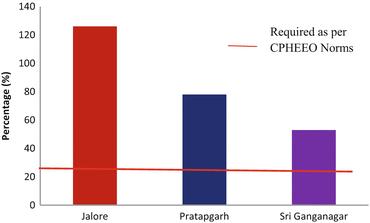
Existing storage capacity in the towns
-
3.
Poor condition of pump sets: Most of the pump sets in the clear water pump house are of more than 20 years old. Leakages from the valves are common. Due to poor condition of pump sets, high energy is consumed to pump the water.
-
4.
Less utilization of treatment capacity: Treatment plants in the towns are running with undercapacity of treatment. Only 75 % of treatment capacity is being utilized. This results in high energy consumption per MLD of treatment.
-
5.
Lack of bulk flow meters: There are no bulk flow meters in the water supply system of the town. Due to this, there is no measurement of quantity being produced and being supplied at consumer end. This practice results in high non-revenue water which results in high operation and maintenance cost.

13.3 Analysis of CO2 Emissions
The population of Pratapgarh, Jalore, and Sri Ganganagar towns are of different sizes and production of water varies from town to town. To do the comparative study of CO2 emissions per capita in the towns, energy consumption has been calculated with respect to per capita in all the three towns, and for uniformity purpose, population size of 50,000 and rate of supply as 100 lpcd have been considered for different types of sources. Per capita energy consumption is calculated based on the energy consumption in the case study year. To estimate the CO2 emissions, grid emission factor of northern grid 0.90 tCO2e/Mwh has been considered. Details of town wise energy consumption with respect to source are given in Table 13.1
As per the analysis, energy consumption for a town with a population of 50,000 and rate of supply of 100 lpcd with source of water as surface water is around 141 kWh/year/capita, whereas energy consumption with source of water as groundwater is 34 kWh/year/capita and with both surface- and groundwater is 96 kWh/year/capita.
Contrary to the popular belief, sourcing water from a surface source is not always energy economical. It is therefore important to take into consideration the lifecycle energy consumption as an attribute in determining the project feasibility and finalizing the alternative.
As per the analysis of the above three towns, energy consumption in surface water source is more due to treatment, and extensive pumping is involved, whereas in groundwater, energy consumption is comparatively less due to the absence of water treatment and less pumping. An amount of 151 kg CO2 emissions per capita per year is being contributed through surface water source, and 29 kg CO2 emissions per capita per year is being contributed through groundwater source. CO2 emissions with respect to type of source are shown in Fig. 13.3.

CO2 emissions with respect to type of source
In sewerage system, the major energy consumption is involved in wastewater treatment (Report on Sewage Treatment in Class I Towns: Recommendations and Guidelines, Ganga River Basin Environmental Management Plan). Depending on the type of technology, adoption for treatment energy consumption varies. Different wastewater treatment technologies like Waste Stabilization Ponds (WSP), Sequential Batch Reactor (SBR), Activated Sludge Process (ASP), and Moving Bed Biofilm Reactor (MBBR) technologies have been considered. Carbon emissions from Waste Stabilization Pond are very less (56 tons of CO2 emissions/MLD/year), whereas MBBR is very high (2,205 tons of CO2 emissions/MLD/year). Figure 13.4 shows CO2 emissions for different types of technologies.

CO2 emissions based on sewage treatment technology
13.4 Low Impact Development: A Case Study
Located close to the national capital, Delhi, at about 30 km north, Sonepat is an important town in Haryana. It is the district headquarter of Sonepat district. The town is well connected by both roads and railways. National Highway 1 (NH 1) connecting Delhi and Wagah Border in Punjab and connecting many important cities passes near the town. In Sonepat, at present, there is no proper storm water drainage system. Due to flat topography, there is no proper natural drainage system developed in the town. Except a major drain constructed and maintained by Irrigation Department, and a 1.5 m dia RCC pipe drain along Gohana Road that serves some part of the town and disposes storm water in major drain, there are no storm water drains in the town. Flooding and water accumulation during monsoon are therefore very common in some localities.
It is proposed to construct major drains of total length 14 km in Sonepat. Four rain water harvesting structures are proposed in the project (Fig. 13.5). Surface runoff collected through storm water drains can be diverted into the rainwater harvesting wells (Mehta 2009).

Proposed storm water drain network with rainwater harvesting structures in Sonepat
13.5 Issues Related to Energy Consumption in Water Supply and Wastewater System
The collection, distribution, and treatment of drinking water and wastewater consume tremendous amounts of energy and release carbon dioxide. The following are the issues causing high energy consumption:
-
Real losses (leaks, physical losses) and apparent losses (theft or metering inaccuracies)
-
Increase in static head in pumping systems
-
Having more storage capacity than actually required
-
Depending on boosting system instead of gravity system
-
Lack of comprehensive project planning approach in water supply system
-
Inappropriate technology selection for treating wastewater
13.6 Recommendations
The following are the recommendations to improve energy efficiency and reduce carbon dioxide emissions:
-
Reducing static head on the pumping system directly reduces power consumption. It can be reduced by keeping water level high in sump/reservoir.
-
Maintaining power factor to a minimum of 0.95.
-
Run standby transformer in parallel with main transformer sharing the load.
-
Using online pumping wherever feasible to reduce static head.
-
Replacing old pipe lines/AC pipes in rising main/transmission/distribution network.
-
Identification and regularization of illegal/unauthorized consumer water connections.
-
Conducting leak detection exercise to identify and reduce leakage loss.
-
Establishing bulk water meters at pumping stations and service reservoirs and providing good quality water meters to consumers.
-
Regular cleaning of strainers and foot valves to avoid head loss.
-
Pumps should not be operated with suction/delivery valve throttled.
-
Sluice valves or butterfly valves on delivery/suction side, non-return valves, and foot valves should be of good quality and should be functional.
-
Proper pump selection at the time of procurement that meets the duty parameters like head and discharge.
-
Selection of proper size of suction/delivery pipes and valves plays a crucial role in efficient function of pumps.
Notes
- 1.
Central Ground Water Board has released a report on Ground Water Scenario in Jalore District. (Ground Water Brochure of Jalore district, Rajasthan, June 2008). According to the CGWB, out of 07 blocks, the southern part with 3 blocks have very low groundwater sources (Raniwara, Bhinmal, and Soyala). The Hardness of groundwater and Chloride content dropped down in the central part of Jalore district, but the alkalinity has gone up in the blocks of Sarnau, Bhinmal, Dedwa, and Jalore Blocks.
References
Mehta M (2009) Water efficiency saves energy, in reducing global warming pollution through water use strategies. Natural Resources Defense Council, New York
Report on Sewage Treatment in Class I Towns: Recommendations and Guidelines, Ganga River Basin Environmental Management Plan (GRB EMP), Report Code: 003_GBP_IIT_EQP_S&R_02_Ver 1_Dec 2010
Sharon Hophmayer T (2006) Wastewater management strategy: centralized V. decentralized technologies for small communities, The Centre for Clean Technology and Environmental Policy, University of Twente, The Netherlands
Vigneswaran S, Sundaravadivel M (2004) Recycle and reuse of domestic wastewater. In: Saravanamuthu (Vigi) Vigneswaran (ed) Wastewater recycle, reuse, and reclamation. Encyclopedia of Life Support Systems (EOLSS), Developed under the Auspices of the UNESCO, Eolss Publishers, Oxford, UK. http://www.eolss.net
Vigneswaran S, Sundaravadivel M (2010) Recycle and reuse of domestic wastewater. UNESCO – EOLSS (2010)
World Population Prospects Report (2008) United Nations, Department of Economic and Social Affairs
Author information
Authors and Affiliations
Corresponding author
Editor information
Editors and Affiliations
Rights and permissions
Copyright information
© 2015 Springer India
About this chapter
Cite this chapter
Aleti, A.R., Talacheeru, K.C. (2015). Green Infrastructure: Issues and Recommendations. In: Dev, S., Yedla, S. (eds) Cities and Sustainability. Springer Proceedings in Business and Economics. Springer, New Delhi. https://doi.org/10.1007/978-81-322-2310-8_13
Download citation
DOI: https://doi.org/10.1007/978-81-322-2310-8_13
Publisher Name: Springer, New Delhi
Print ISBN: 978-81-322-2309-2
Online ISBN: 978-81-322-2310-8
eBook Packages: Business and EconomicsEconomics and Finance (R0)